xVector Data Engineering Handbook
xVector Data Engineering Handbook
Section titled “xVector Data Engineering Handbook”Principles and Practices for Building Scalable, Reliable, Outcome-Driven Data Applications
xVector Labs — 2026 Edition
Introduction
Section titled “Introduction”A Data Engineer is responsible for designing, building, and maintaining scalable data infrastructure and pipelines that enable organizations to ingest, process, and activate data of any modality, such as structured tables, documents, images, audio, or knowledge graphs, efficiently and at scale. Their work ensures that data across all forms is available, reliable, semantically consistent, and optimized for analytics, machine learning, retrieval-augmented generation, and agentic applications.
In the absence of a Data Engineer, organizations face data entropy: fragmented, unoptimized pipelines, soaring storage and compute costs, and unreliable information that degrades downstream model quality and decision-making. Without this foundational oversight, data scientists and analysts are forced to perform manual cleanup and use modality-specific workarounds, stalling strategic innovation in favor of constant firefighting and leaving multimodal AI capabilities perpetually out of reach.
Data engineers working with the xVector Platform are responsible for building and maintaining the data infrastructure that powers analytics and AI applications across structured, unstructured, and multi-modal data. Key responsibilities include:
-
Pipeline Development and Monitoring: Automate ingestion and transformation across structured, semi-structured, and unstructured data sources, including images, monitor pipeline performance across modalities, and resolve issues promptly.
-
Storage Layout Design: Define partitioning strategies, record keys, file sizing, vector index configurations, and data organization to optimize query performance and control storage costs across tabular, graph, and embedding-based datasets.
-
Schema Management and Evolution: Manage schema and representation changes across datasources and datasets of varying modalities, ensuring backward compatibility, coordinating deprecations, and minimizing disruption to downstream consumers, including ML models and retrieval pipelines.
-
Data Quality and Validation: Implement data quality checks across all modalities, including completeness, format integrity, embedding validity, and entity consistency, enforce schema contracts, and validate integrity across pipeline stages to prevent bad data from propagating into curated or materialized layers.
-
Enrichment and Custom Function Authoring: Apply the platform’s built-in DML enrichment functions and author user-defined transformation and business logic functions tailored to specific use cases, including modality-specific enrichment such as entity extraction.
-
Materialization and Synchronization: Plan and maintain materialized datasets across tabular, graph, and vector stores, configure/update policies to balance data freshness with infrastructure costs, and monitor for schema drift, embedding staleness, and representational inconsistency.
-
Metadata and Lineage Management: Maintain catalog metadata and track data lineage across all modalities and processing stages to support auditability, impact analysis, and downstream discoverability, including lineage for embedding generation and model feature derivation.
-
Governance Enforcement: Apply and maintain data governance policies across structured and unstructured data assets, including access controls, classification of sensitive content across modalities, audit logging, and regulatory compliance.
This handbook covers essential topics that a Data Engineer is responsible for. Each section explains the underlying principle, why it matters, and how the xVector Platform implements it across structured, unstructured, and multi-modal data.
Applying Data Engineering Principles to Use Cases
Section titled “Applying Data Engineering Principles to Use Cases”The handbook is organized around xVector’s three-layered data architecture. Three running examples are used throughout to ground the concepts in real-world scenarios:
SaaS Enterprise App
Section titled “SaaS Enterprise App”The SaaS Enterprise App demonstrates a comprehensive end-to-end analytics framework for subscription-based businesses, modeling the complete customer lifecycle from acquisition through renewal and expansion. It covers Customer, Product, Sales, and Marketing Analytics, showing how these domains interconnect through shared entities such as users, accounts, subscriptions, and revenue.
Pharma Leads App
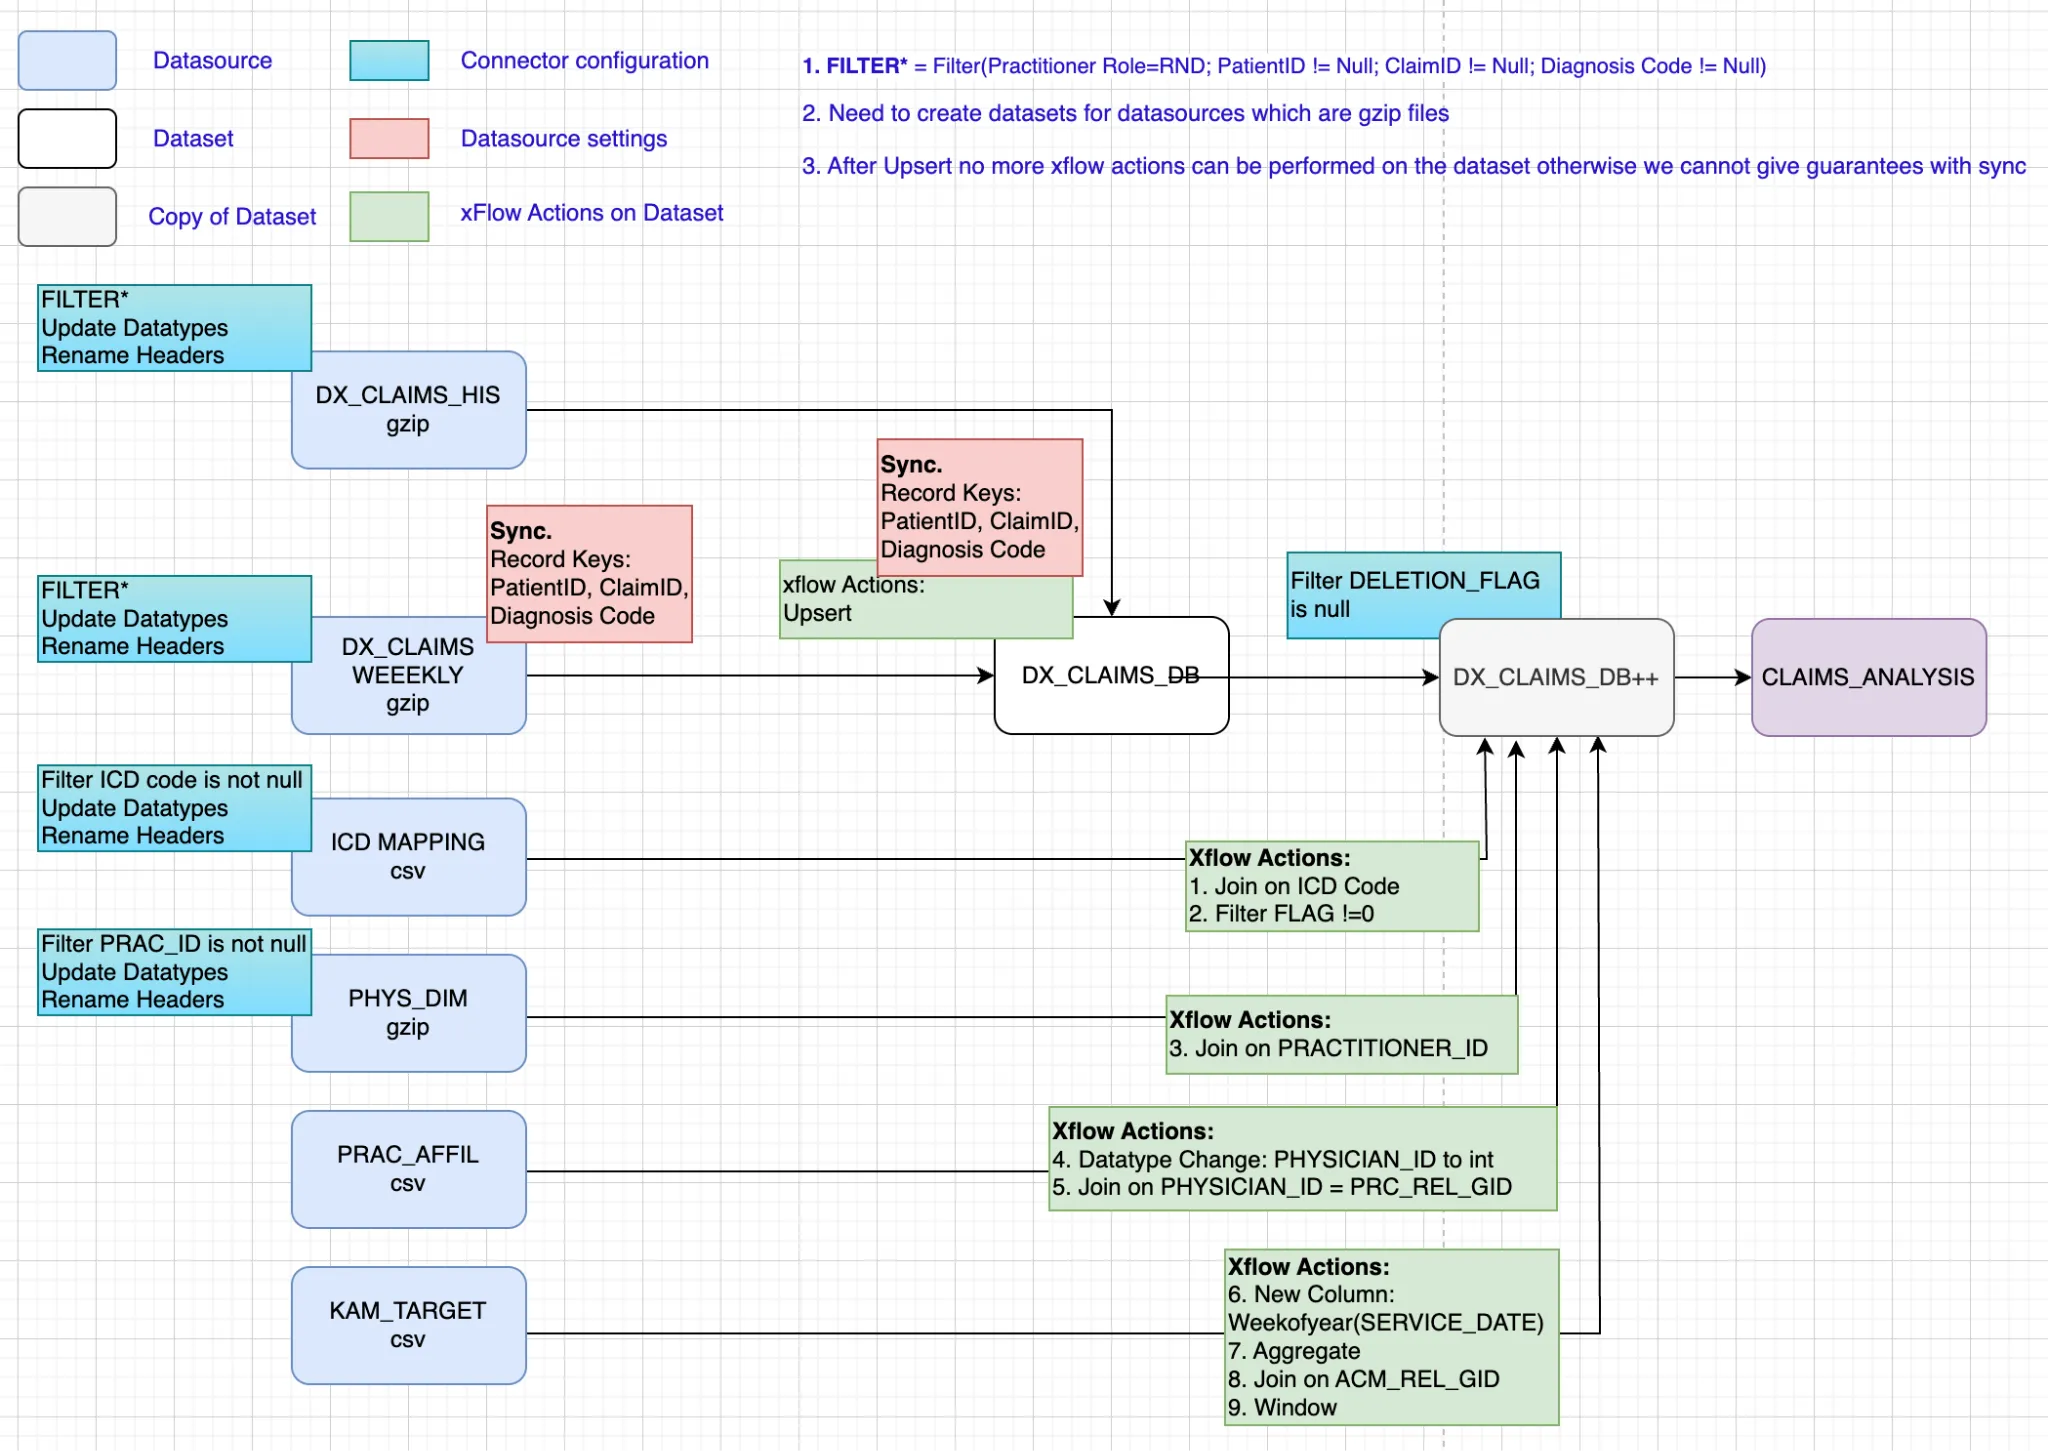
Section titled “Pharma Leads App”A Pharma company mines approximately 800 million claims records (both historical and ongoing) and provides insights to help sales representatives be more impactful. They identify unusual activity by analyzing claims data and alerting the sales team by setting thresholds. The system alerts the appropriate sales representatives, who can then act accordingly. The data comprises multiple tables that store claims for diagnostic, procedural, and surgical services, as well as information on patients, providers, and drugs.
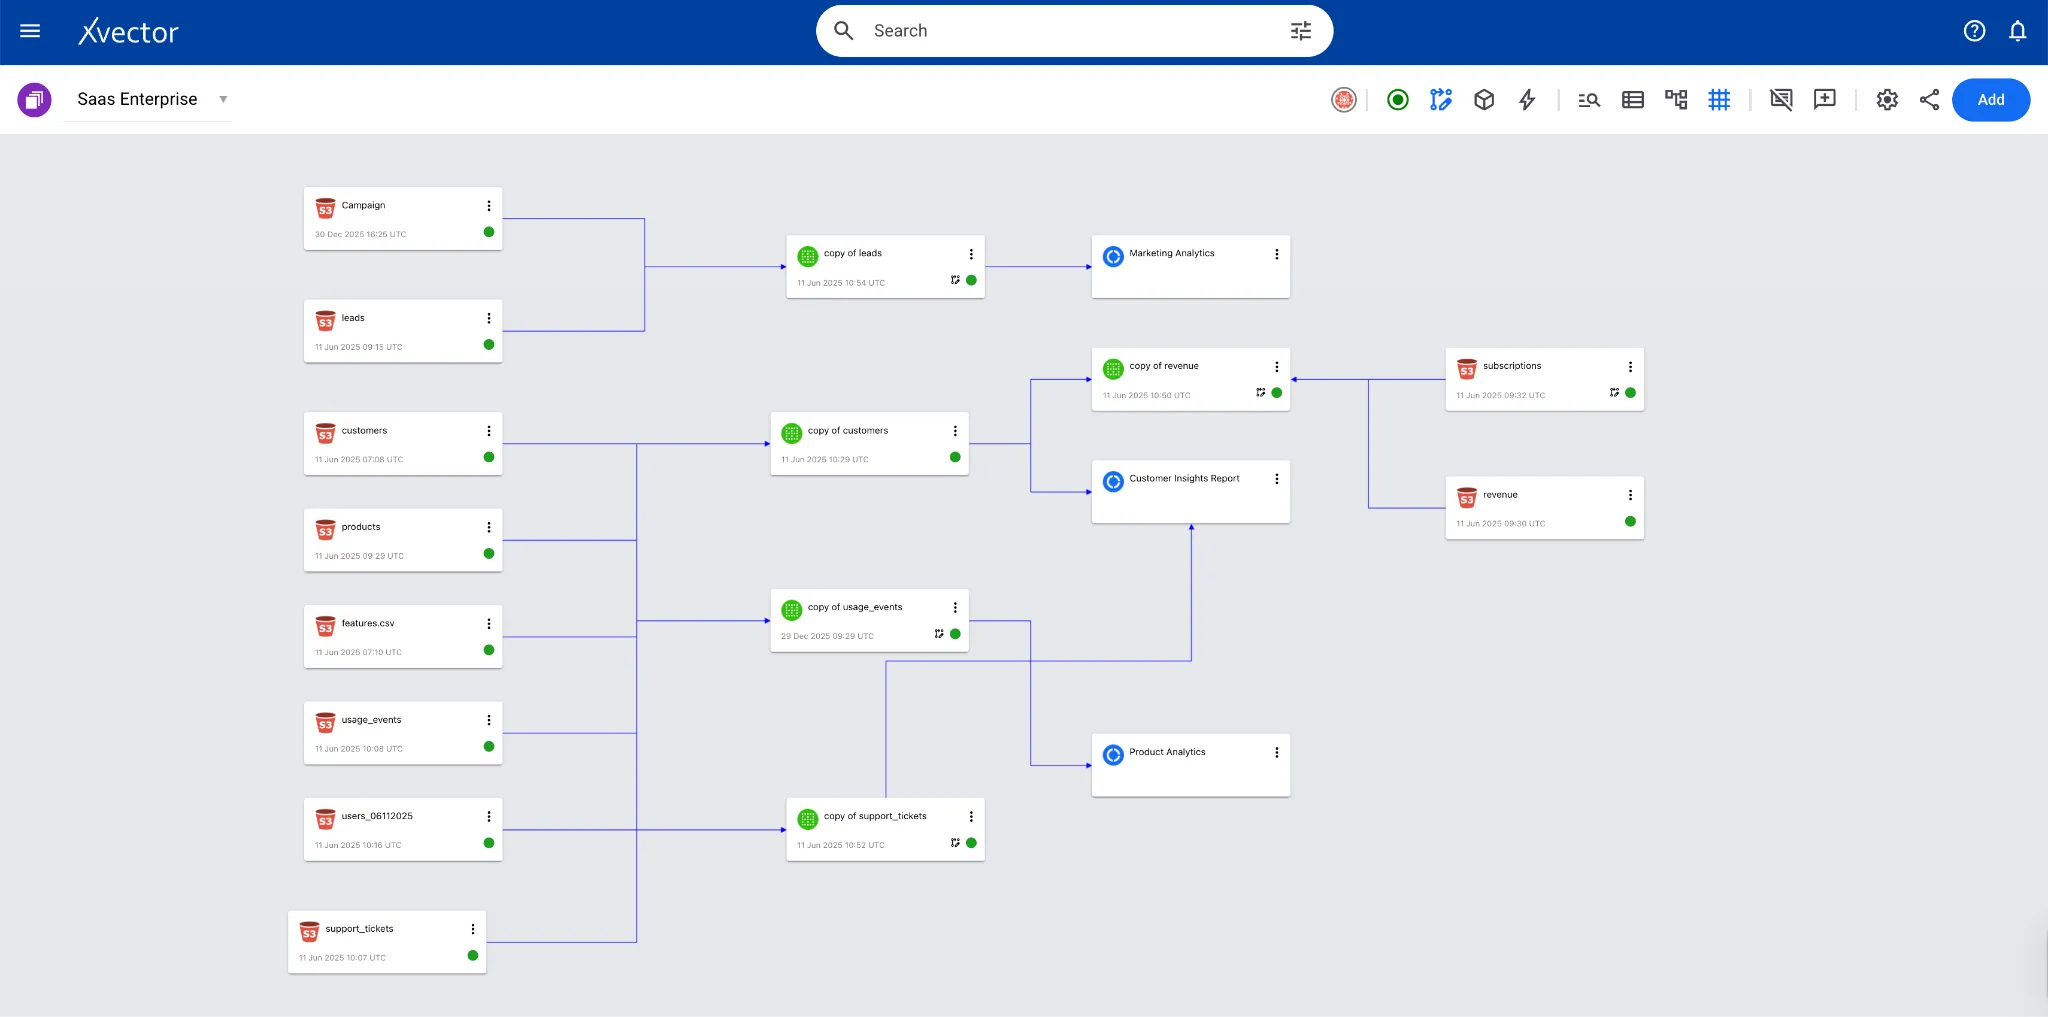
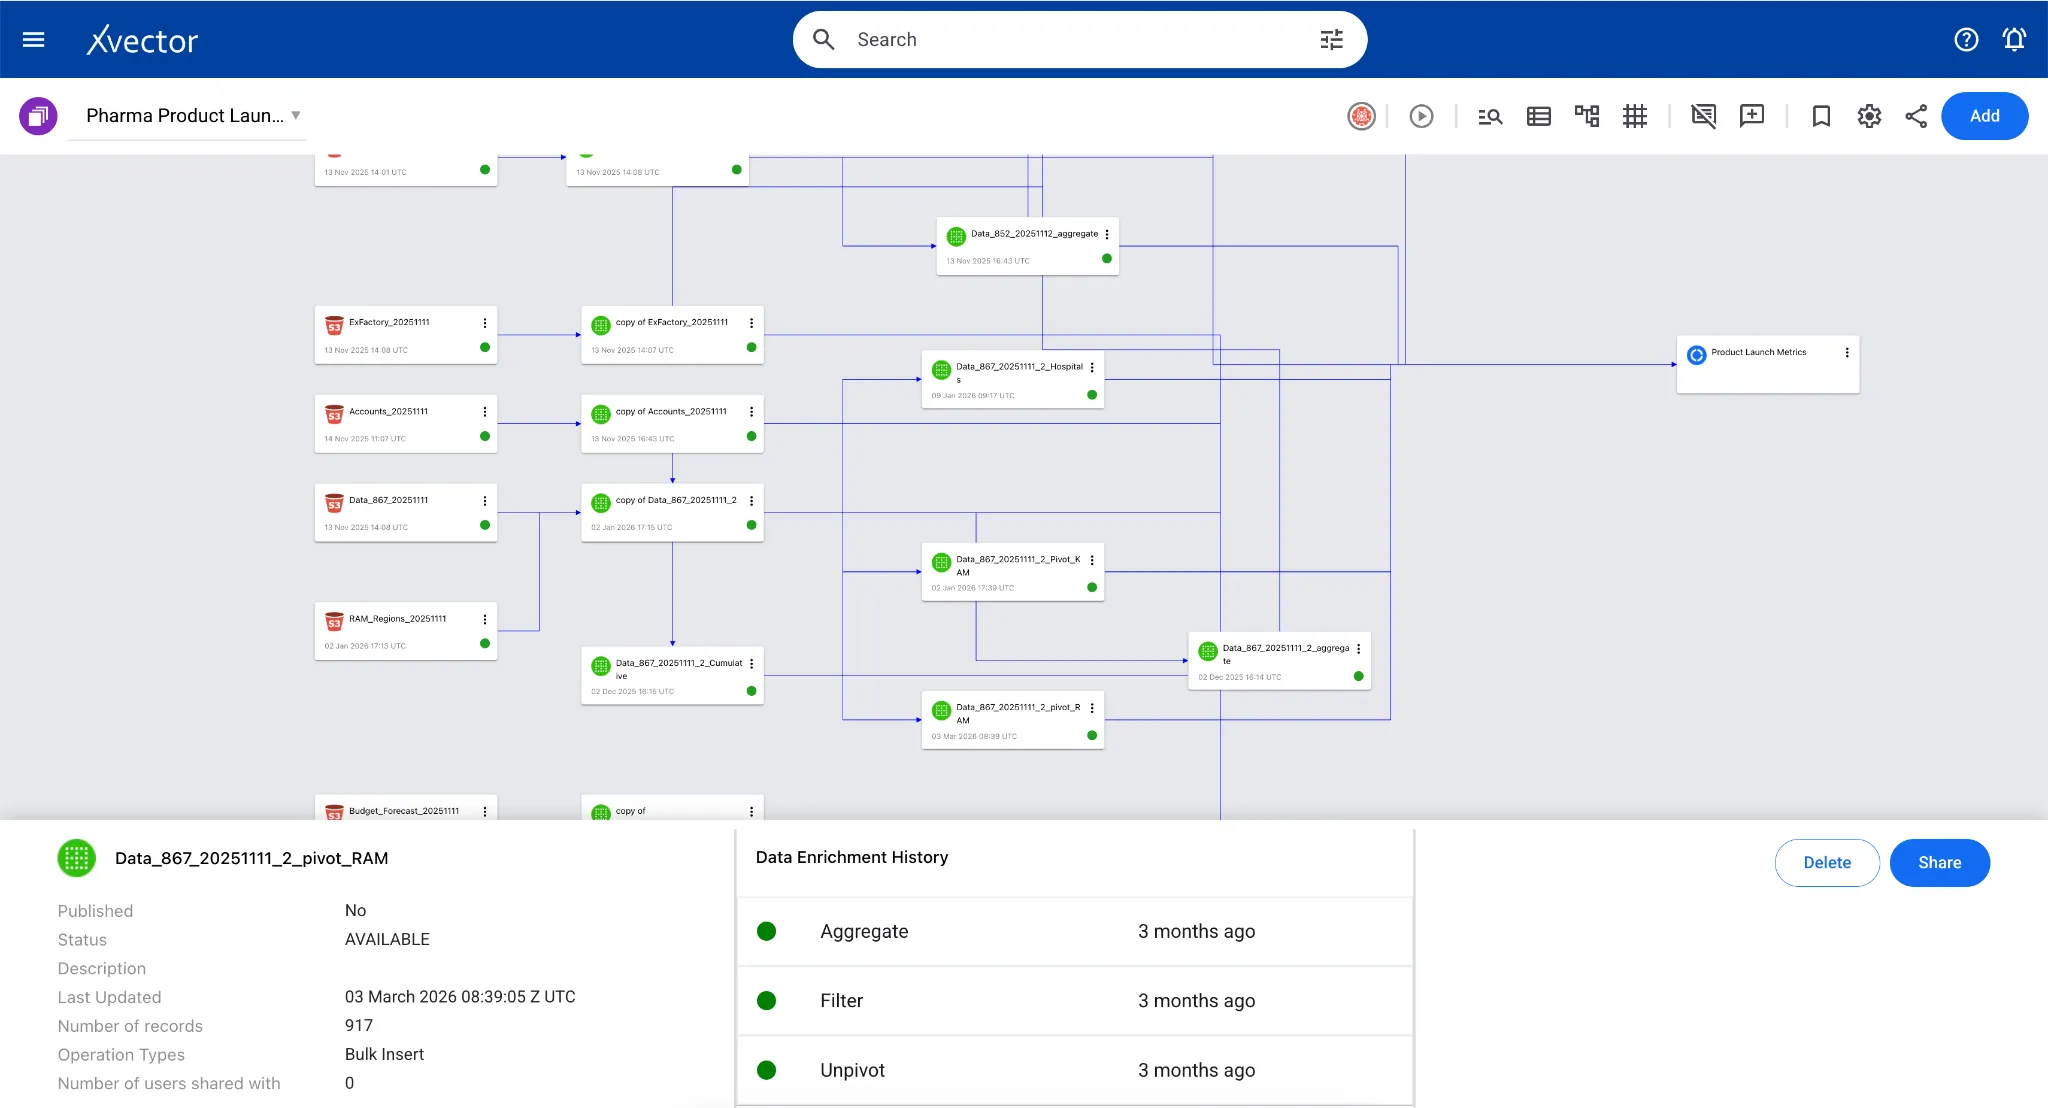
The screenshot below shows the pipeline in the xVector Platform:
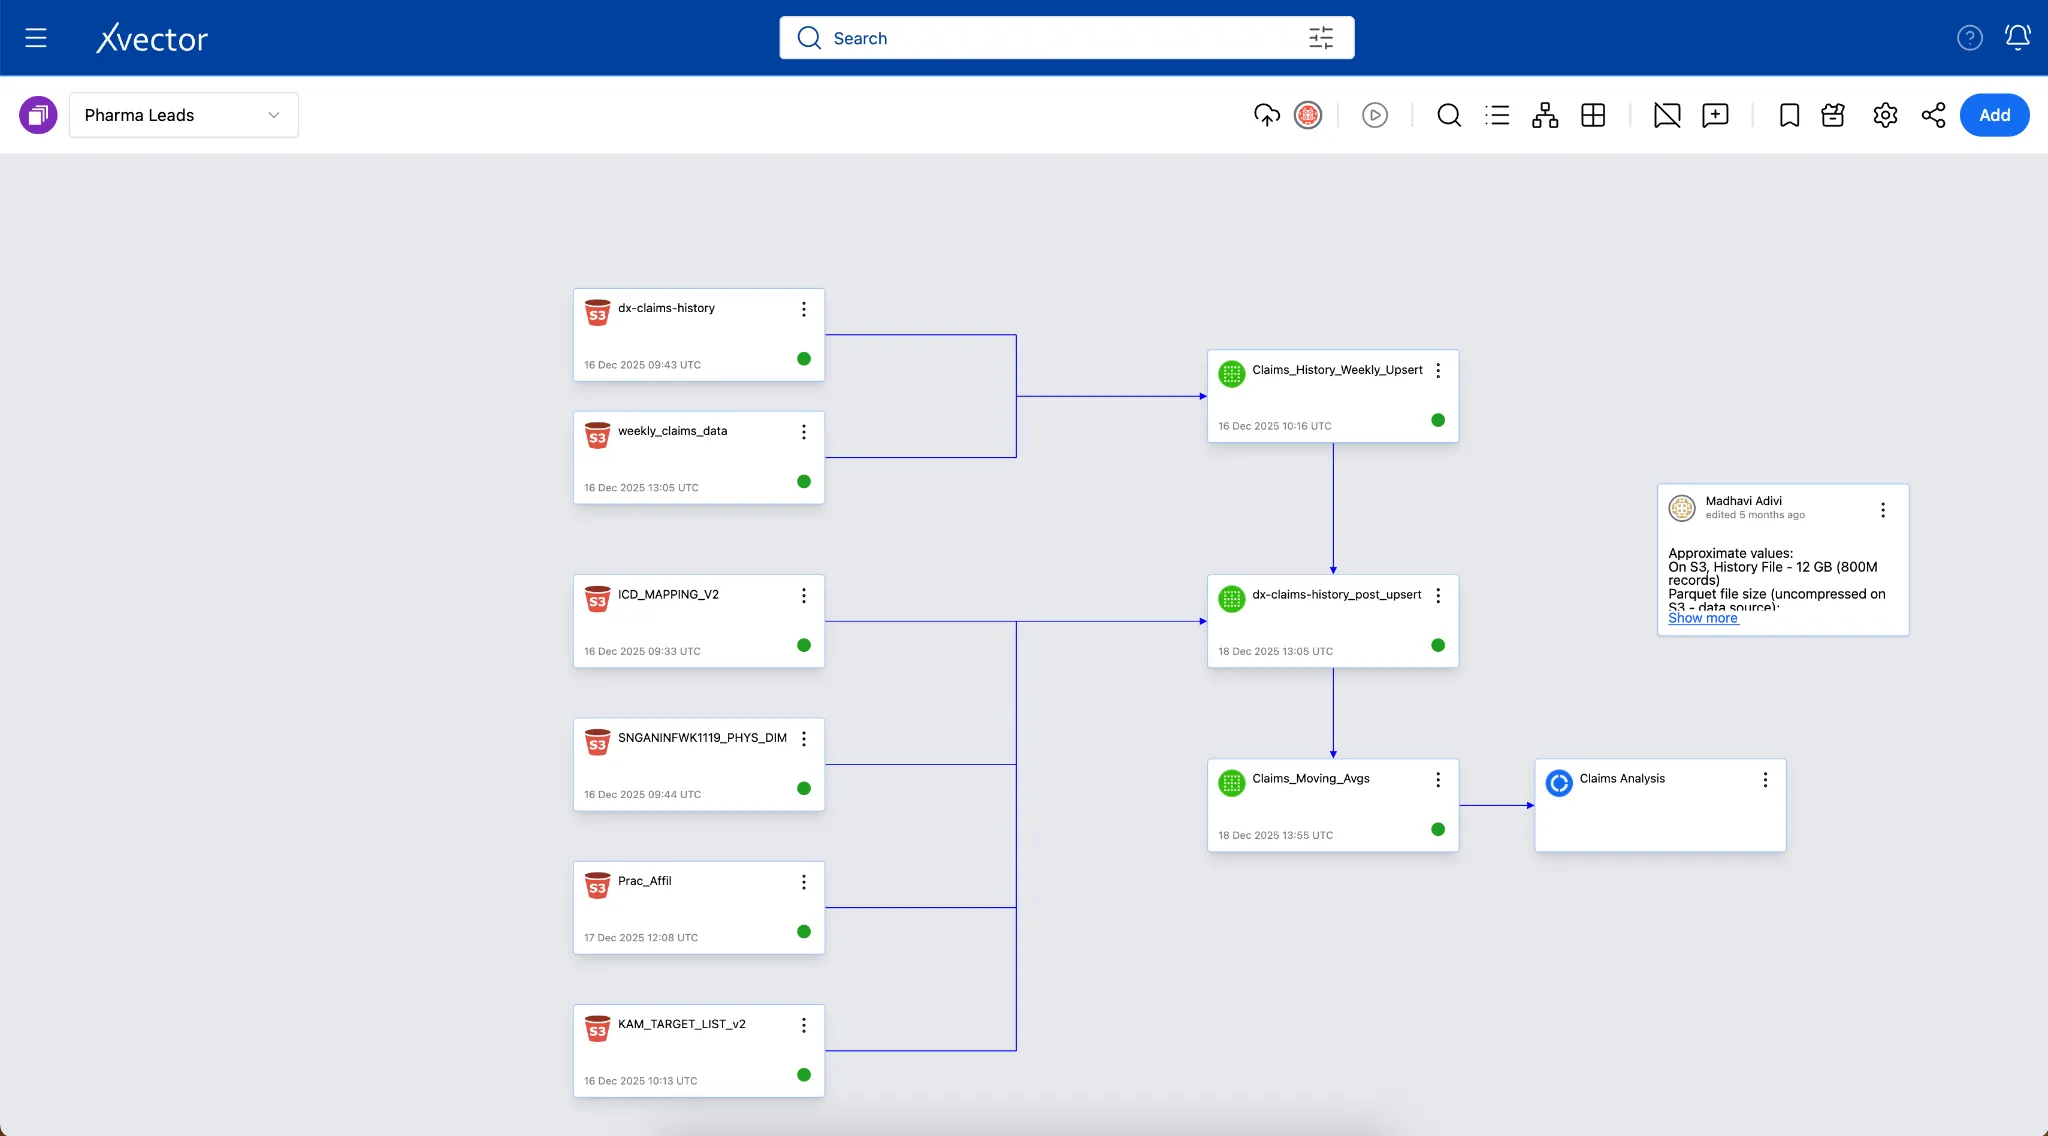
The screenshot below describes the entire pipeline in detail:
Pharma Product Launch Metrics App
Section titled “Pharma Product Launch Metrics App”A pharmaceutical company develops an antibiotic indicated for drug-resistant infections, targeting approximately 140,000 patients who do not respond to standard empiric therapies. The analytics challenge is to unify disparate supply chain datasets (manufacturer shipments: Ex-Factory, distributor inventory: 852, and reseller-to-account transactions: 867), competitive market data from third-party aggregators, customer affiliation hierarchies, and quarterly rolling forecasts into a coherent platform. This unified view enables the sales organization, structured around Regional Account Managers and Key Account Managers, to monitor supply chain activity, benchmark against competitors, track forecast accuracy, and identify accounts where prescribing patterns signal growth opportunities or require intervention.
Three-Layered Data Architecture
Section titled “Three-Layered Data Architecture”xVector adopts a three-layered enterprise data architecture. Each layer has distinct goals and techniques for ensuring availability, integrity, and performance.
| Layer | Purpose |
|---|---|
| Digital Twin Layer | Ingest and mirror source systems into a near-real-time enterprise replica |
| Reference Data Layer | Organize, clean, enrich, and standardize data into logical domains |
| Business Use Case Layer | Pre-compute data from the Reference layer, extract actionable insights, and power analytics applications |
Data flows from sources into the Digital Twin Layer, is then refined and organized in the Reference Data Layer, and is consumed by applications and users in the Business Use Case Layer. Each layer builds on the guarantees established by the layer beneath it. The sections below frequently reference Apache Iceberg, the open table format used by the xVector Platform. Details of this can be found in the Open Table Formats section in the Appendix.
Layer 1: Digital Twin Layer
Section titled “Layer 1: Digital Twin Layer”Ingesting, storing, and synchronizing a faithful replica of your enterprise data.
The Digital Twin Layer provides a near-real-time view of the enterprise, capturing its structure, interactions, and operational state. It is the foundation of the entire data architecture and ensures that data flows reliably from source systems into the platform.
Key capabilities of this layer include integrating with various data sources to maintain a consistent enterprise view, supporting seamless schema changes without disrupting downstream analytics, and interoperating with existing systems through a broad library of connectors.
Connecting to Data Sources
Section titled “Connecting to Data Sources”The xVector Platform ingests data from a wide variety of sources via its connector framework, including object stores (e.g., S3), databases, APIs platforms, and flat files. Let’s understand this through the platform’s apps.
Pharma Leads App
Section titled “Pharma Leads App”The Pharma Leads App ingests 800 million records of historical claims data spanning 4 years, along with weekly claims data that are either updates to existing claims or new claims. These sources are gzip-compressed files on S3, totaling 15.2 GB across 49 objects. These files are uncompressed data stored as Parquet files on S3. Since there are 49 files with the same schema, the platform can ingest the entire folder in a single operation.
Weekly incremental files contain either updates to existing claims or new claims. xVector’s S3 connector automatically handles decompression, schema inference, and partitioned storage.
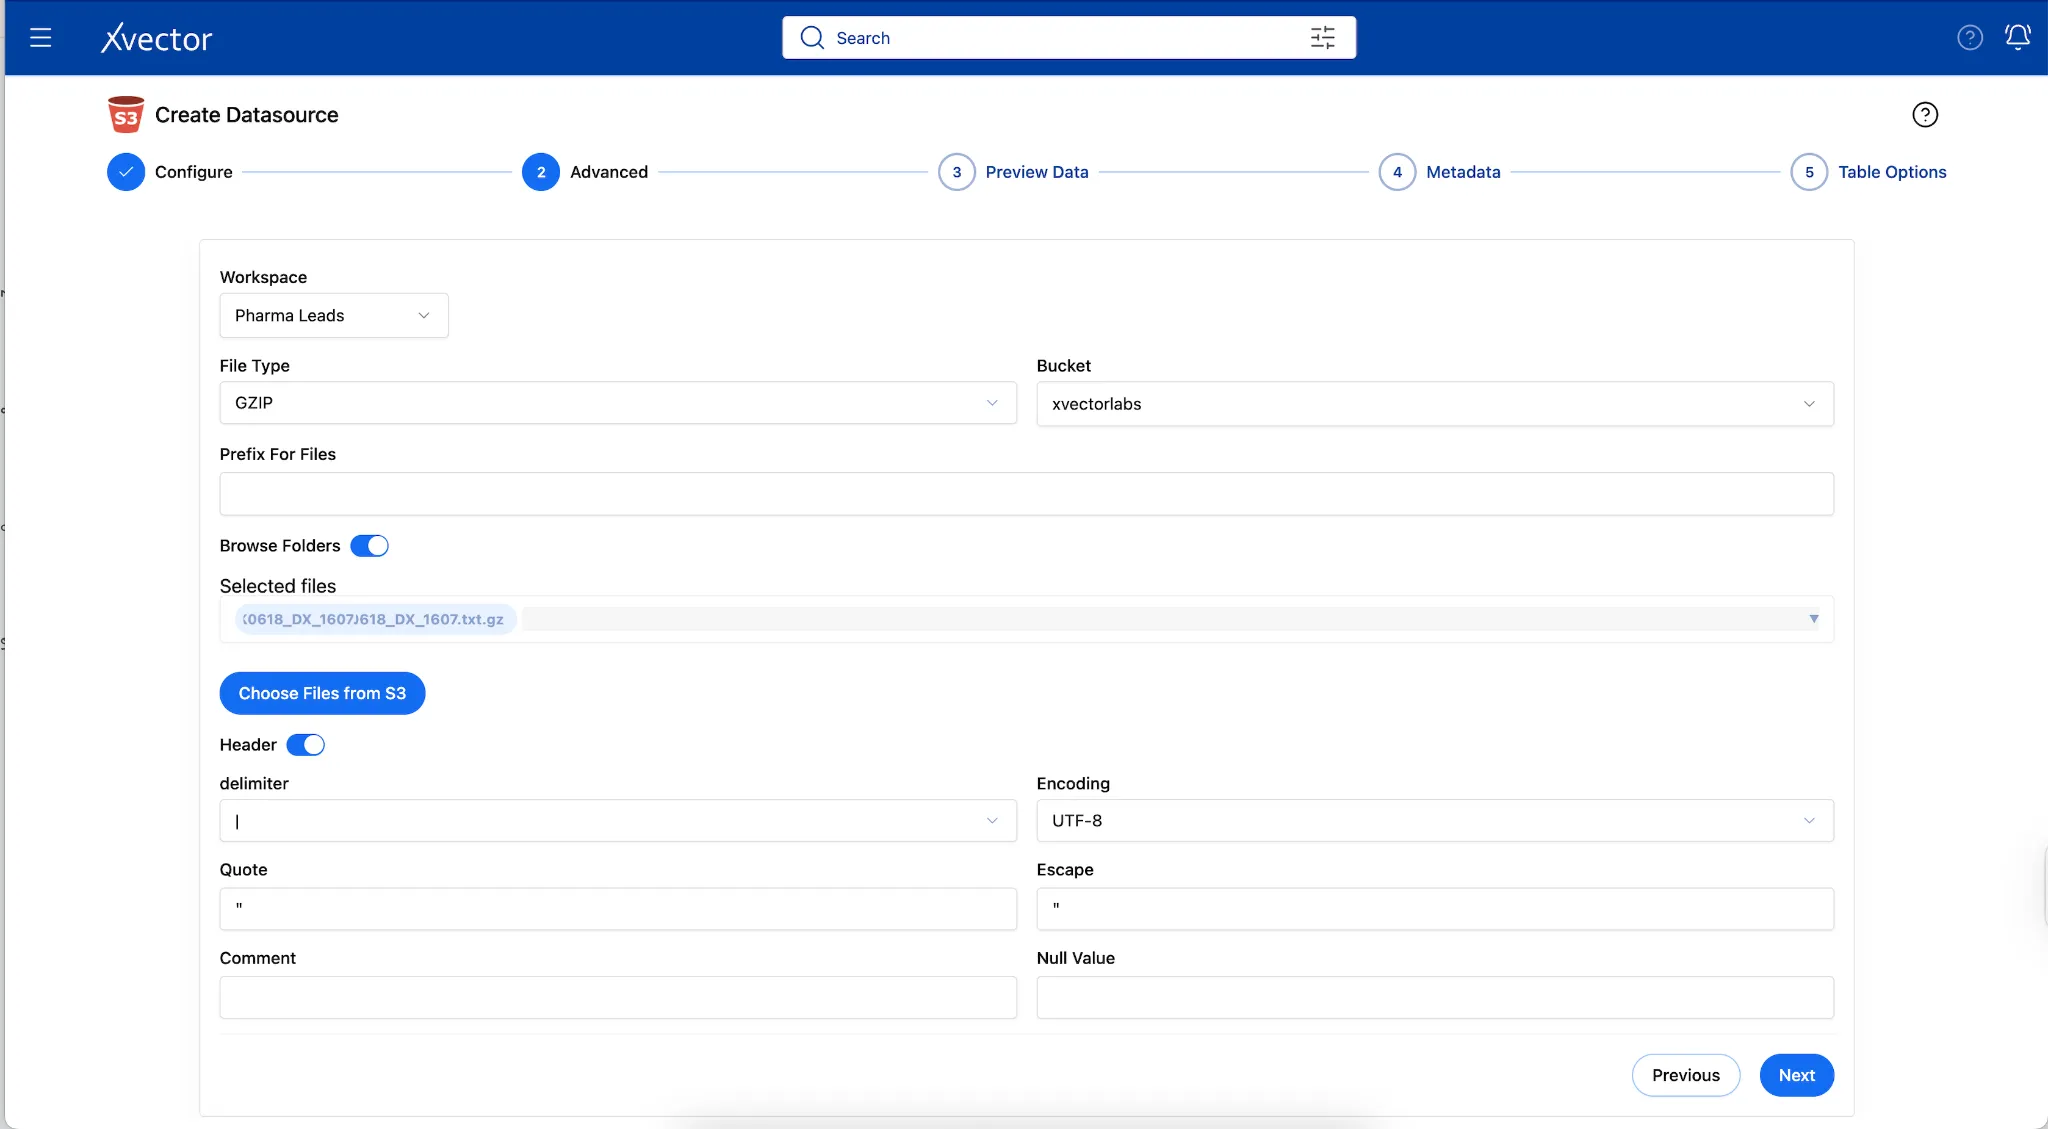
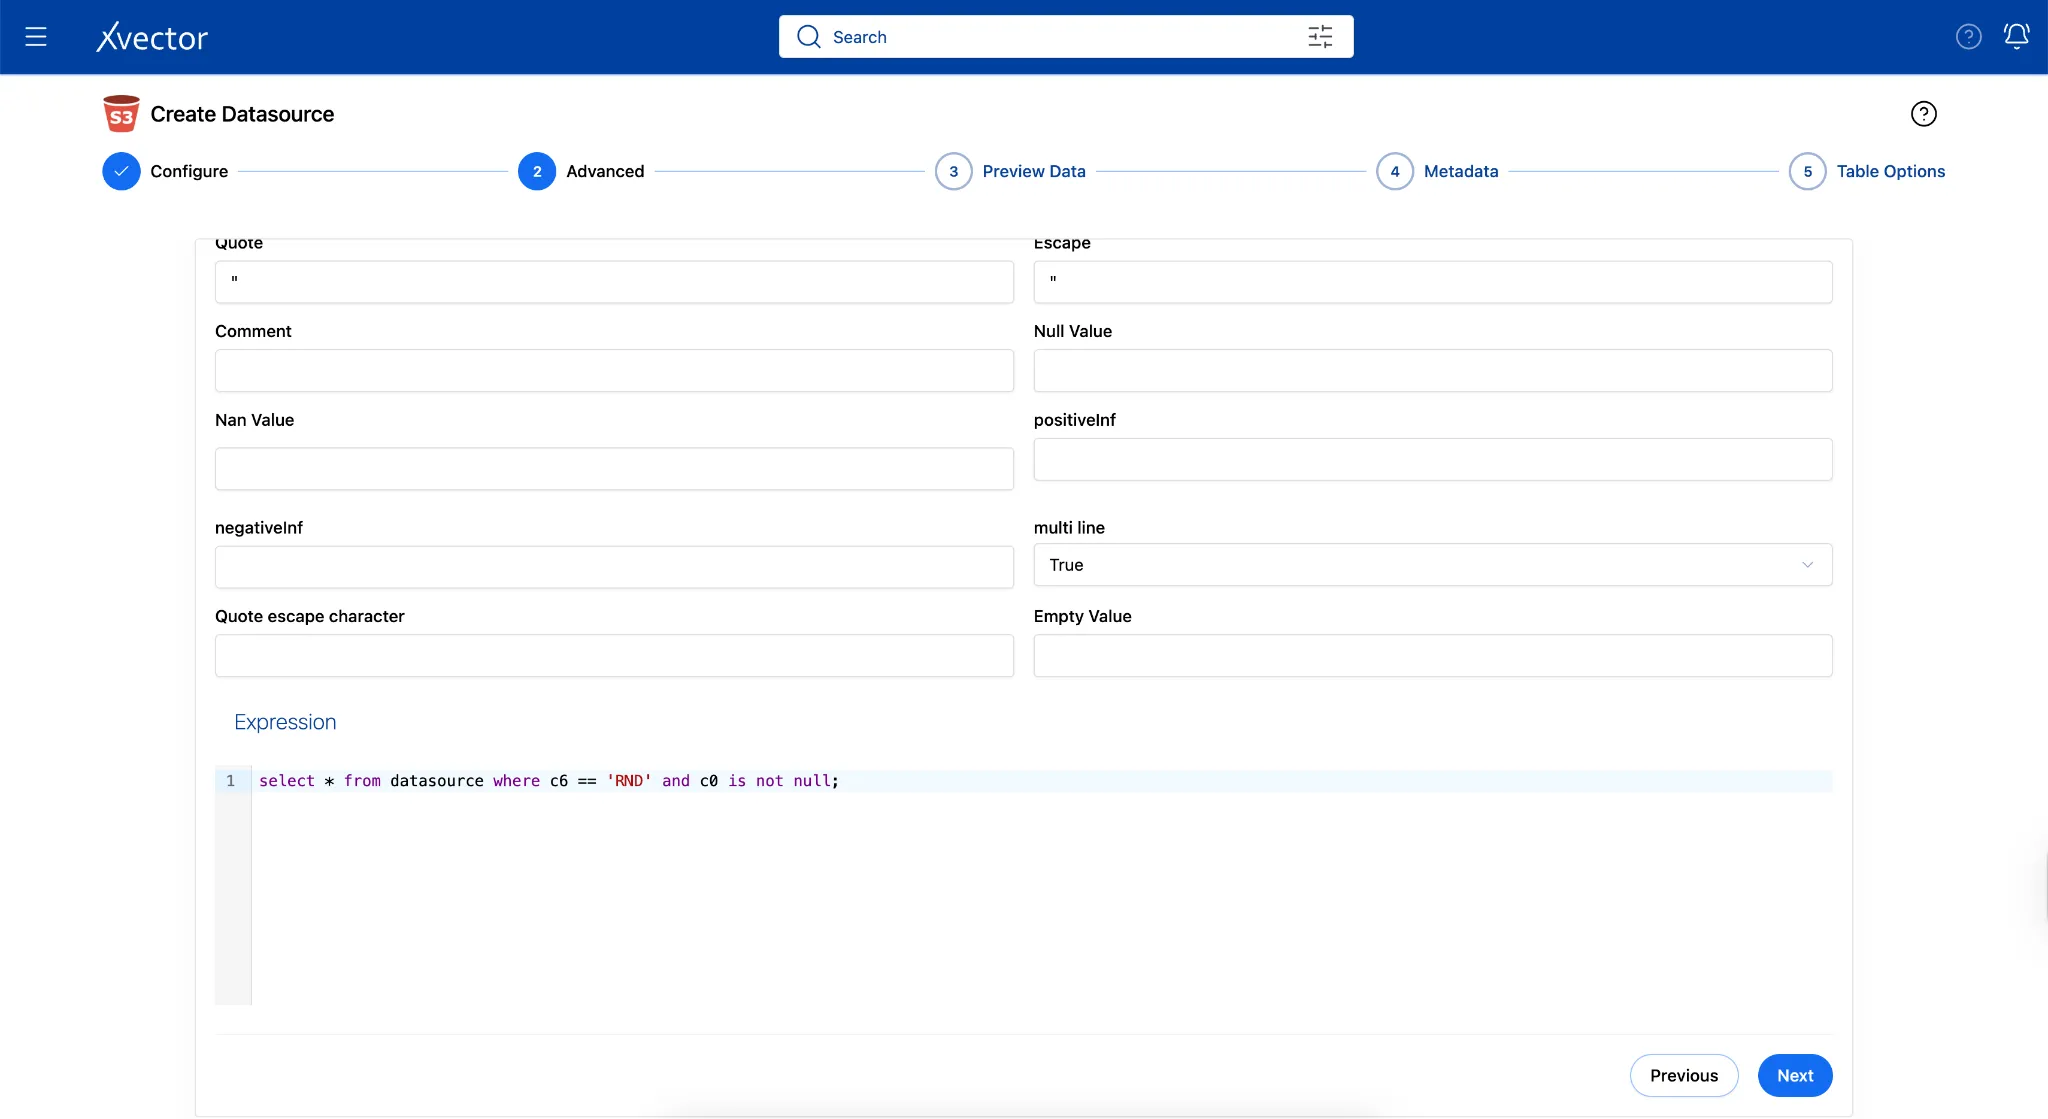
Note: To apply a filter and bring in only a subset of the 800M records, users can do so via the Advanced tab in the Connector. In this example, the filter restricts data to
PRACTITIONER_ROLE = 'RND'(Rendering Practitioner), resulting in 12.69 GB of uncompressed data in the workspace, stored as Parquet files on S3.
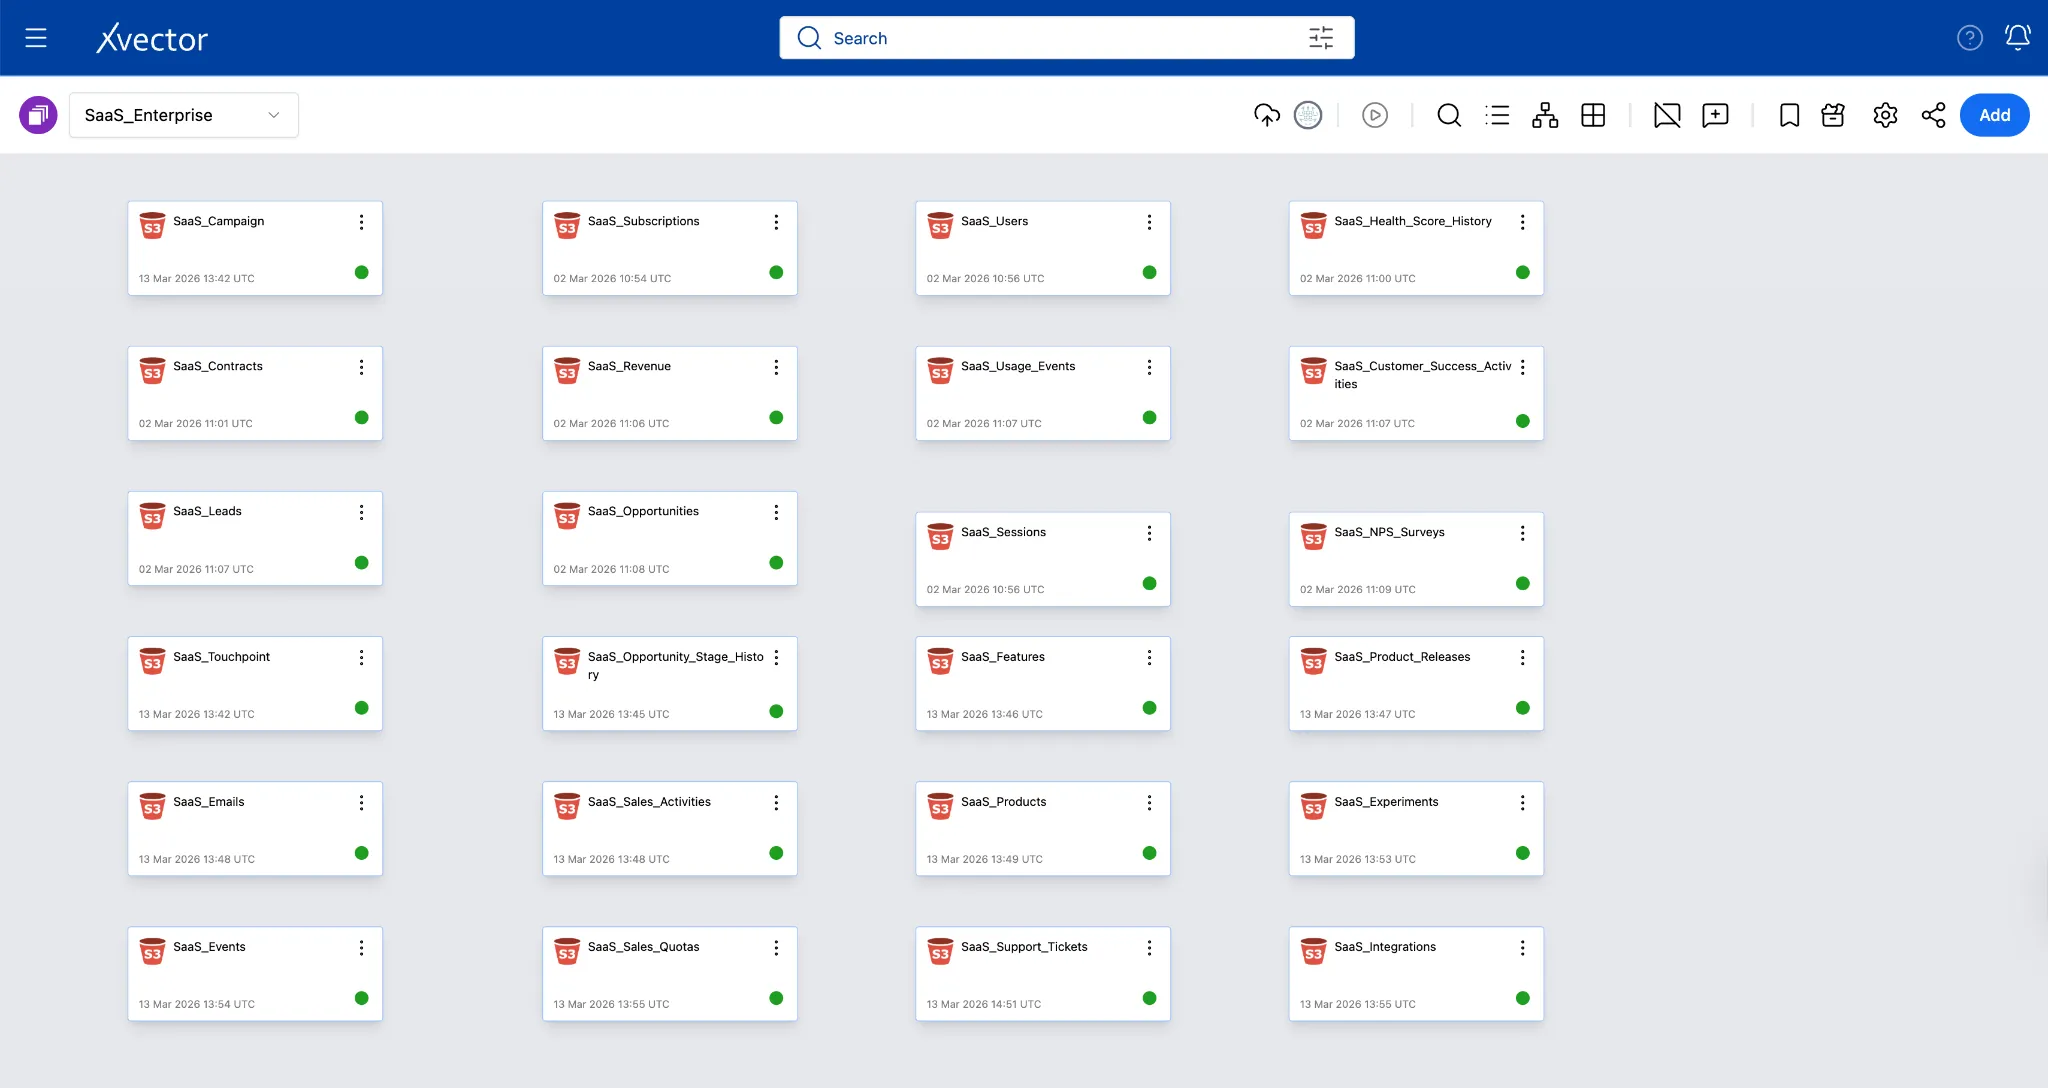
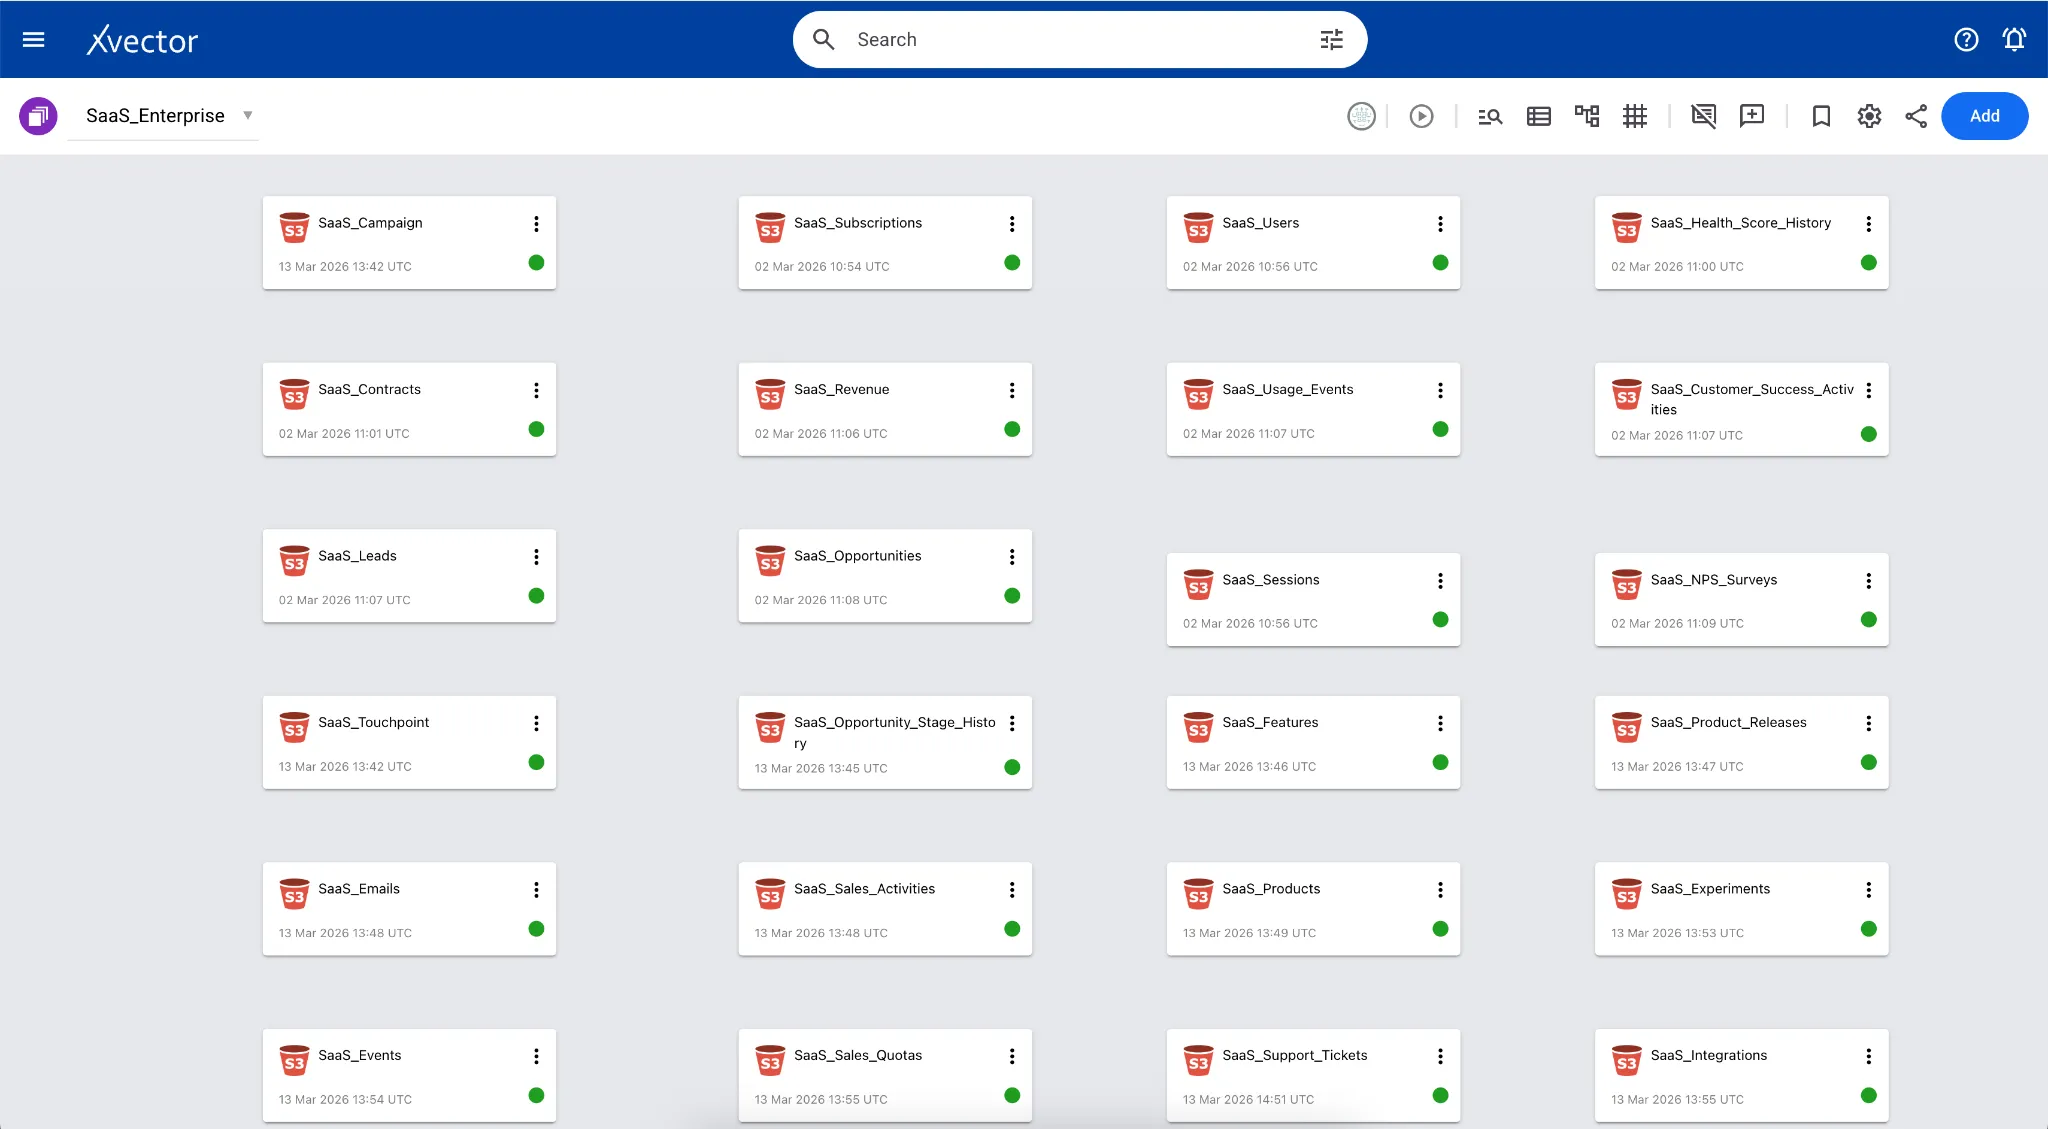
SaaS Enterprise Apps
Section titled “SaaS Enterprise Apps”Our SaaS Enterprise application aggregates approximately 25 CSV datasets from diverse sources, including CRM, product telemetry, customer success, billing, and support systems. This connector uses automated schema inference to instantly identify data types and metadata. To maintain control over data modeling, the workflow includes a “human-in-the-loop” step that allows users to review and override inferred schemas before committing the data to the platform. Here, all the sources are brought together into a single workspace.
Metadata Updates
Section titled “Metadata Updates”When data is ingested in formats such as CSV files, the data types are automatically inferred, and users can verify and update accordingly. In the Pharma Leads App, since the source is a gzip file, all column datatypes are set to string by default. Users can update the datatypes of these columns to their actual types in the metadata tab during data ingestion.
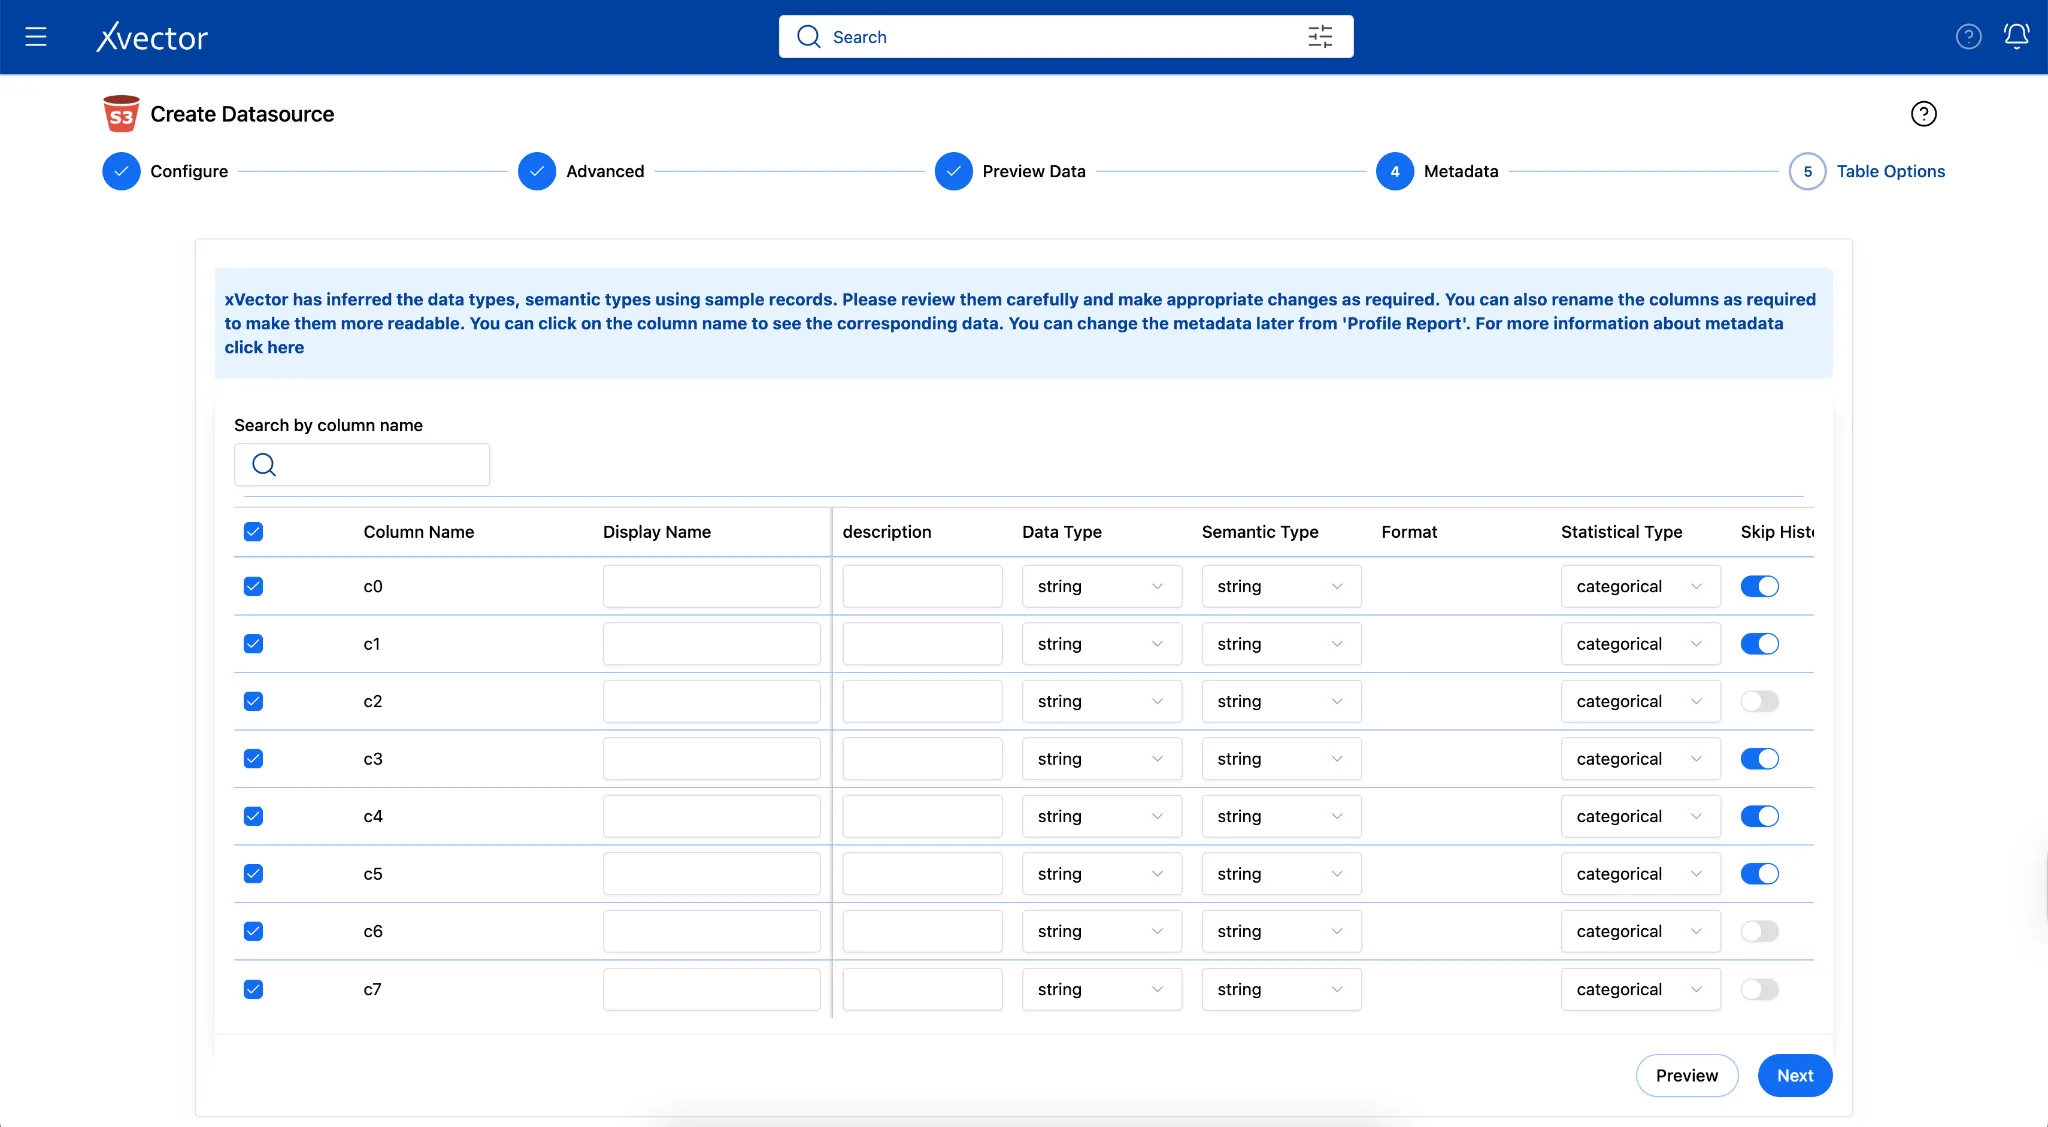
Column Metadata Structure
Section titled “Column Metadata Structure”Each ingested dataset stores a column_metadata JSONB array in PostgreSQL. This drives schema validation, PII classification, semantic-layer enrichment, and BI-tool rendering.
Key fields:
| Field | Type / Values | Purpose |
|---|---|---|
| id | INT | Stable column ID |
| name | TEXT | Raw column name from source (e.g. sepallength) |
| data_type | TEXT (e.g., floating, string) | Source-native type |
| mapped_data_type | TEXT (e.g., double, string) | Normalized type used in Spark |
| semantic_type | TEXT (e.g. float, string, date, email) | Semantic classification — drives PII scanner heuristics |
| statistical_type | ENUM: numerical, categorical, temporal, boolean | Used for histogram decisions, metric aggregation, and BI rendering |
| measure/dimension | BOOL | measure=true → aggregatable metric; dimension=true → group-by / filter axis |
| nullable | BOOL | Whether NULLs are permitted, used in schema compatibility checks |
| skip_histogram | BOOL | If true, histogram computation is skipped for this column during profiling |
| expression / computed | TEXT / BOOL | Derived column expression; computed=true means it is not a raw source column |
| description/label | TEXT | Human-readable display label and description for BI consumers |
Synchronization
Section titled “Synchronization”Synchronization is the process of keeping data consistent across multiple systems, whether in real time or in batch mode. In a modern data stack, this means keeping operational databases, data warehouses, data lakes, and downstream applications aligned with source systems. Without effective synchronization, organizations face data inconsistencies, duplicate or missing records, and analytics built on stale data.
The challenge intensifies in distributed architectures where data flows through multiple stages: from source systems to staging areas, from raw storage to transformed datasets, and ultimately to dashboards, reports, and machine learning models.
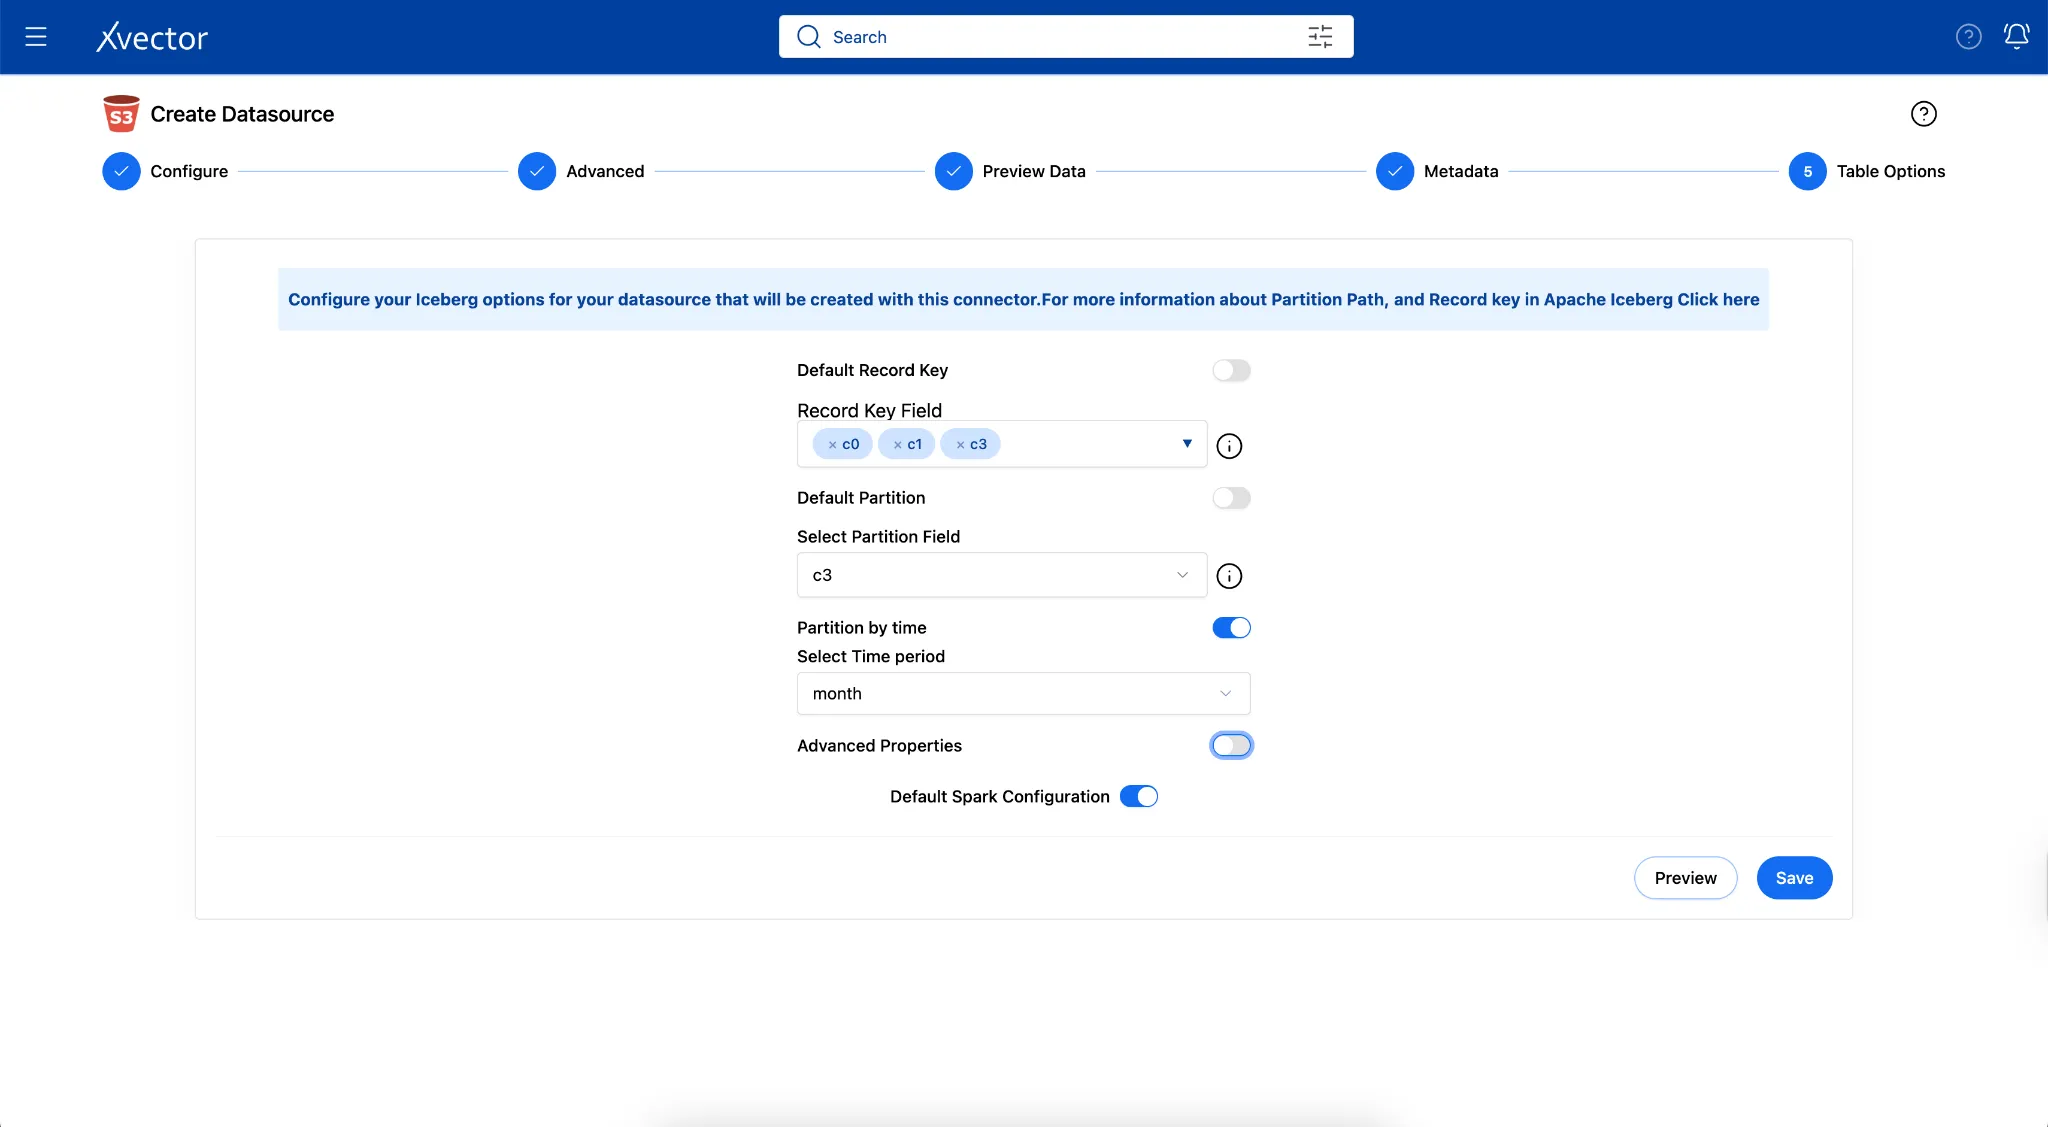
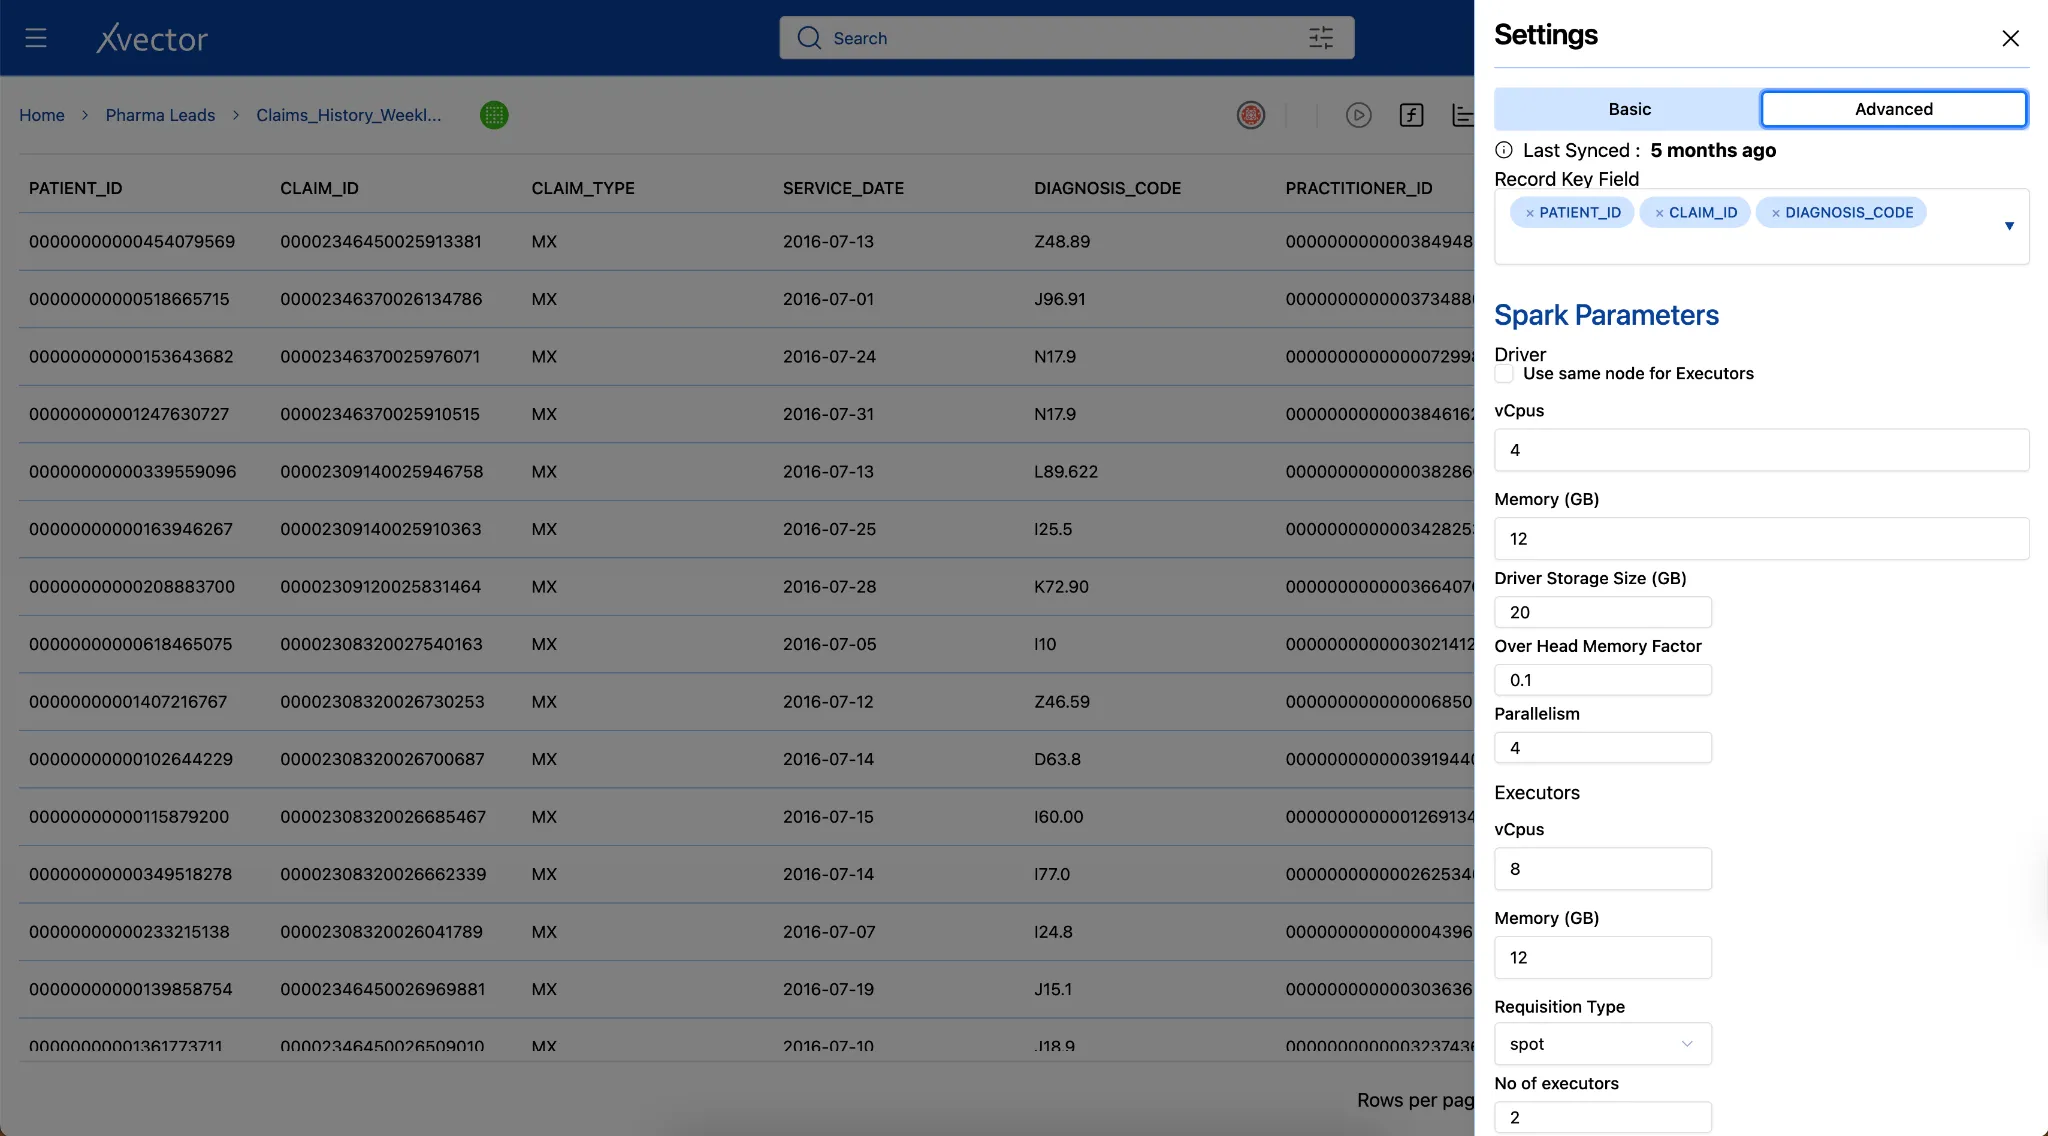
Record Keys
Section titled “Record Keys”Effective synchronization requires unique identifiers — record keys — to determine which records are new, which need updates, and which should be deleted. In xVector, users define record keys for datasources/datasets to enable proper merge operations during synchronization. For example, a pharmaceutical dataset uses a composite key (Claim_id, Patient_id, Diagnosis_code) to uniquely identify each record. When new data arrives, xVector uses these keys to match incoming records to existing ones, performing upserts rather than appending duplicates.
Implementing Synchronization Policies
Section titled “Implementing Synchronization Policies”xVector addresses synchronization through configurable update policies attached to each resource in a DataApp:
- On-Demand: Manual refresh when triggered by a user.
- OnEvent: Automatic update when upstream data changes.
- OnSchedule: Time-based refresh at specified intervals.
- Rules: User-defined rules to update based on complex conditions.
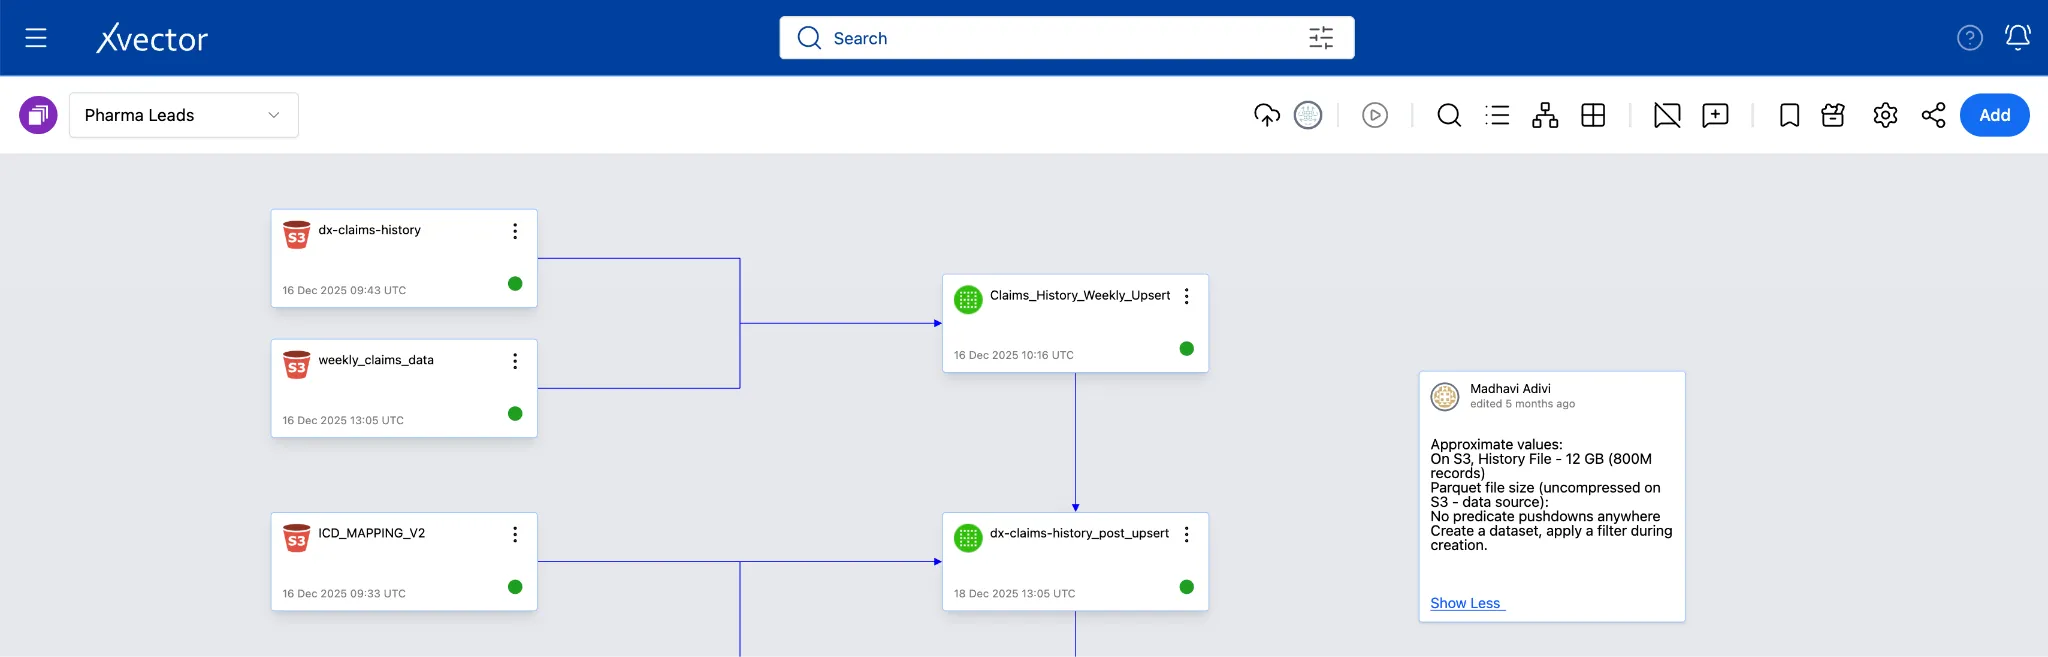
This policy-based approach handles complex dependency chains. For example, in the Pharma Leads App, the claims data is updated weekly, while reference data such as ICD code mappings and physician dimensions is updated only occasionally.
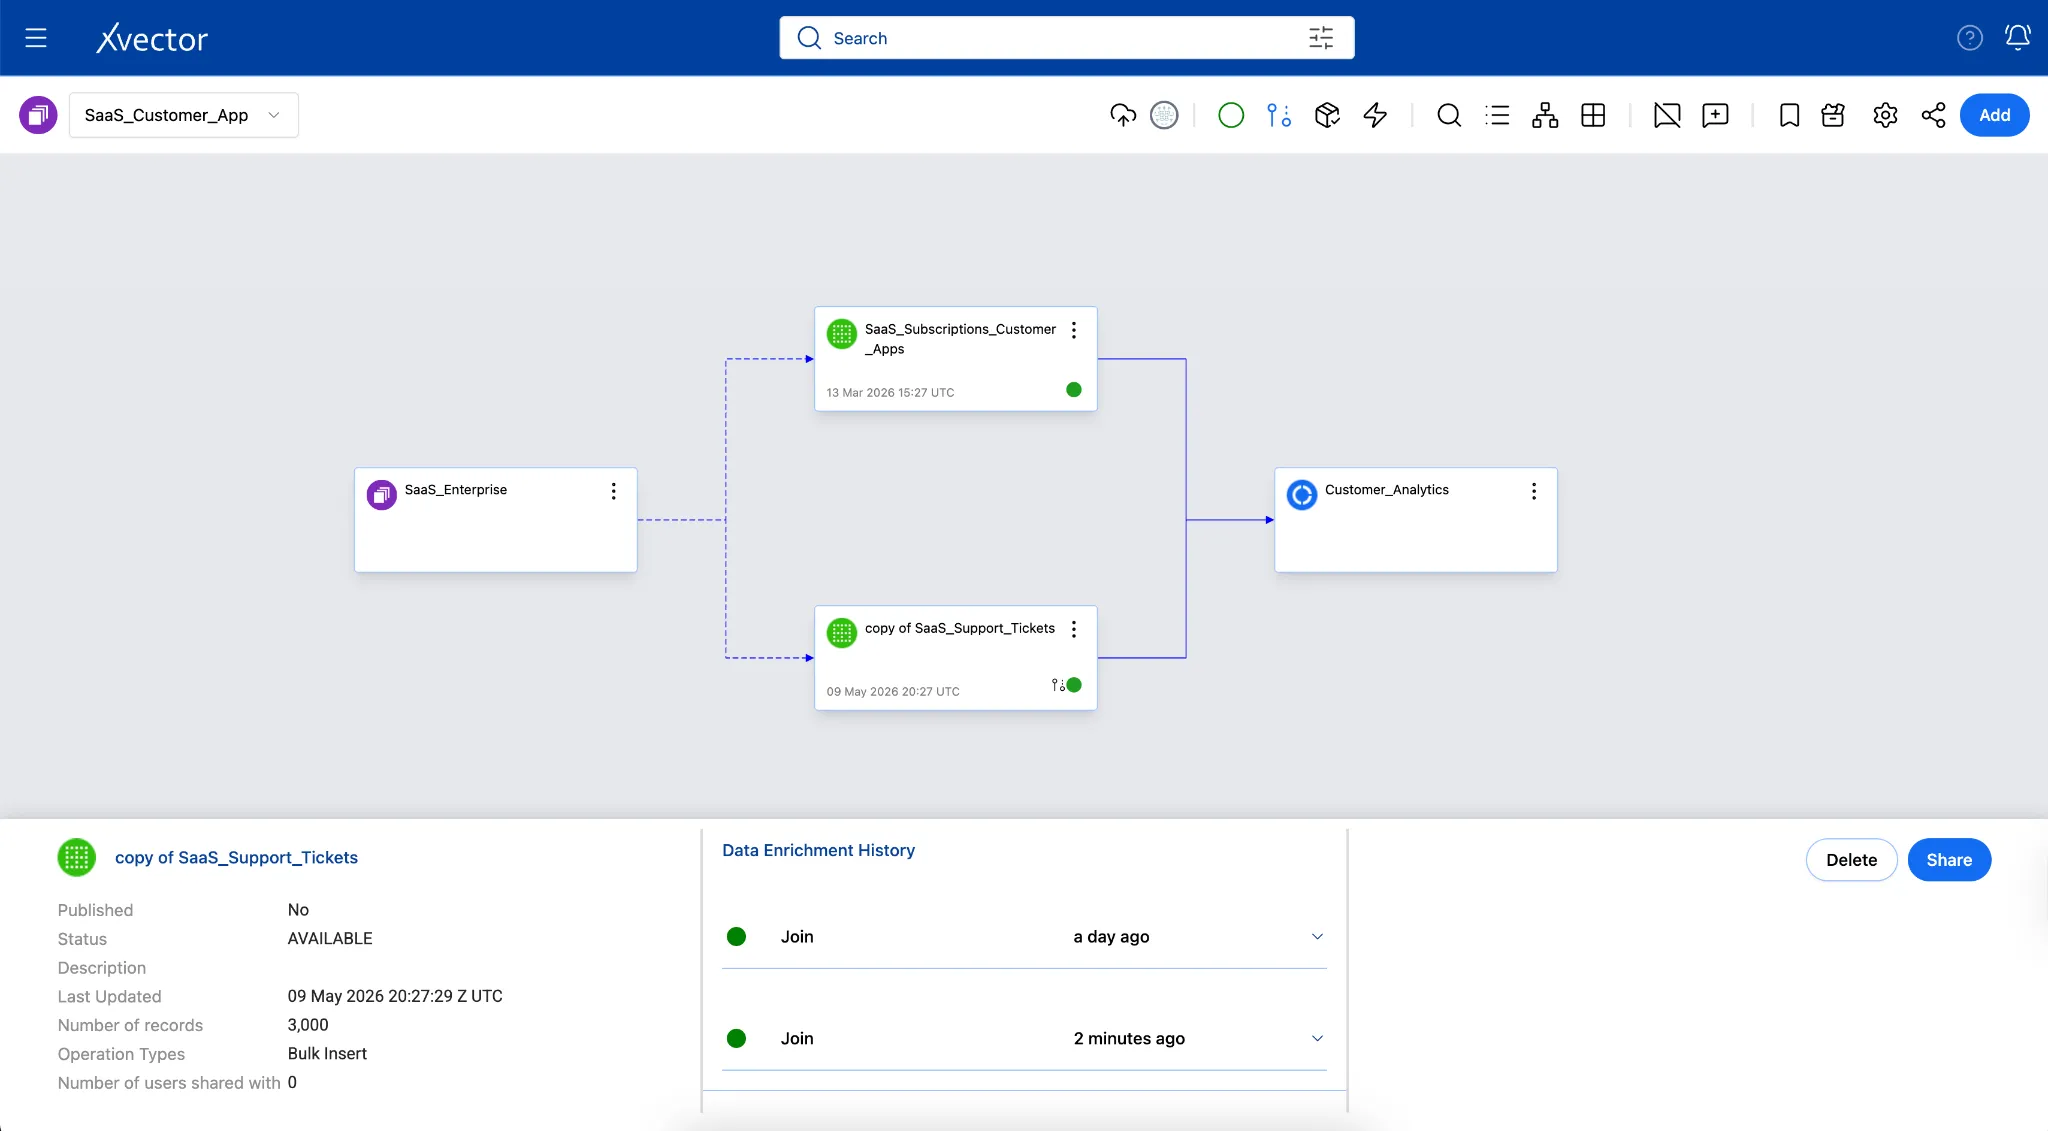
You can set up synchronization after creating the data source on the Datasource view page.
Figure 4: Synchronization Update Policies and Dependency Chains
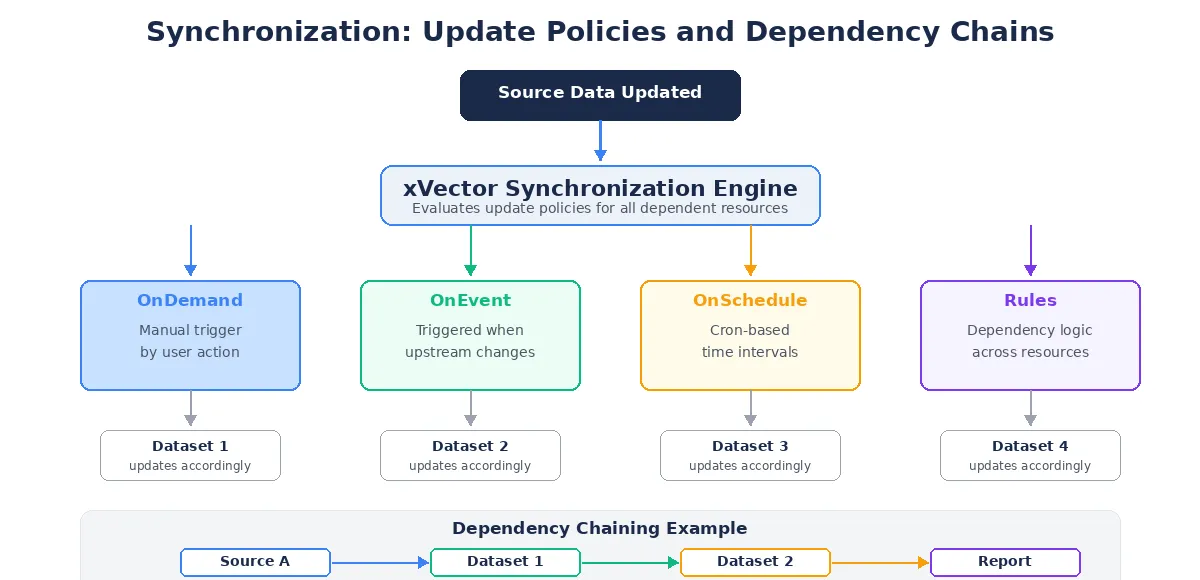
The Pharma Leads App uses an event-driven synchronization model. The ingestion pipeline is triggered automatically whenever a new weekly dataset lands in the designated S3 folder. This trigger initiates the synchronization job, executing all required DML operations to ensure the data is immediately consistent.
Additionally, xVector’s native connectors support predicate pushdown, ensuring that only the required data subsets are filtered and ingested during each sync, optimizing both performance and storage.
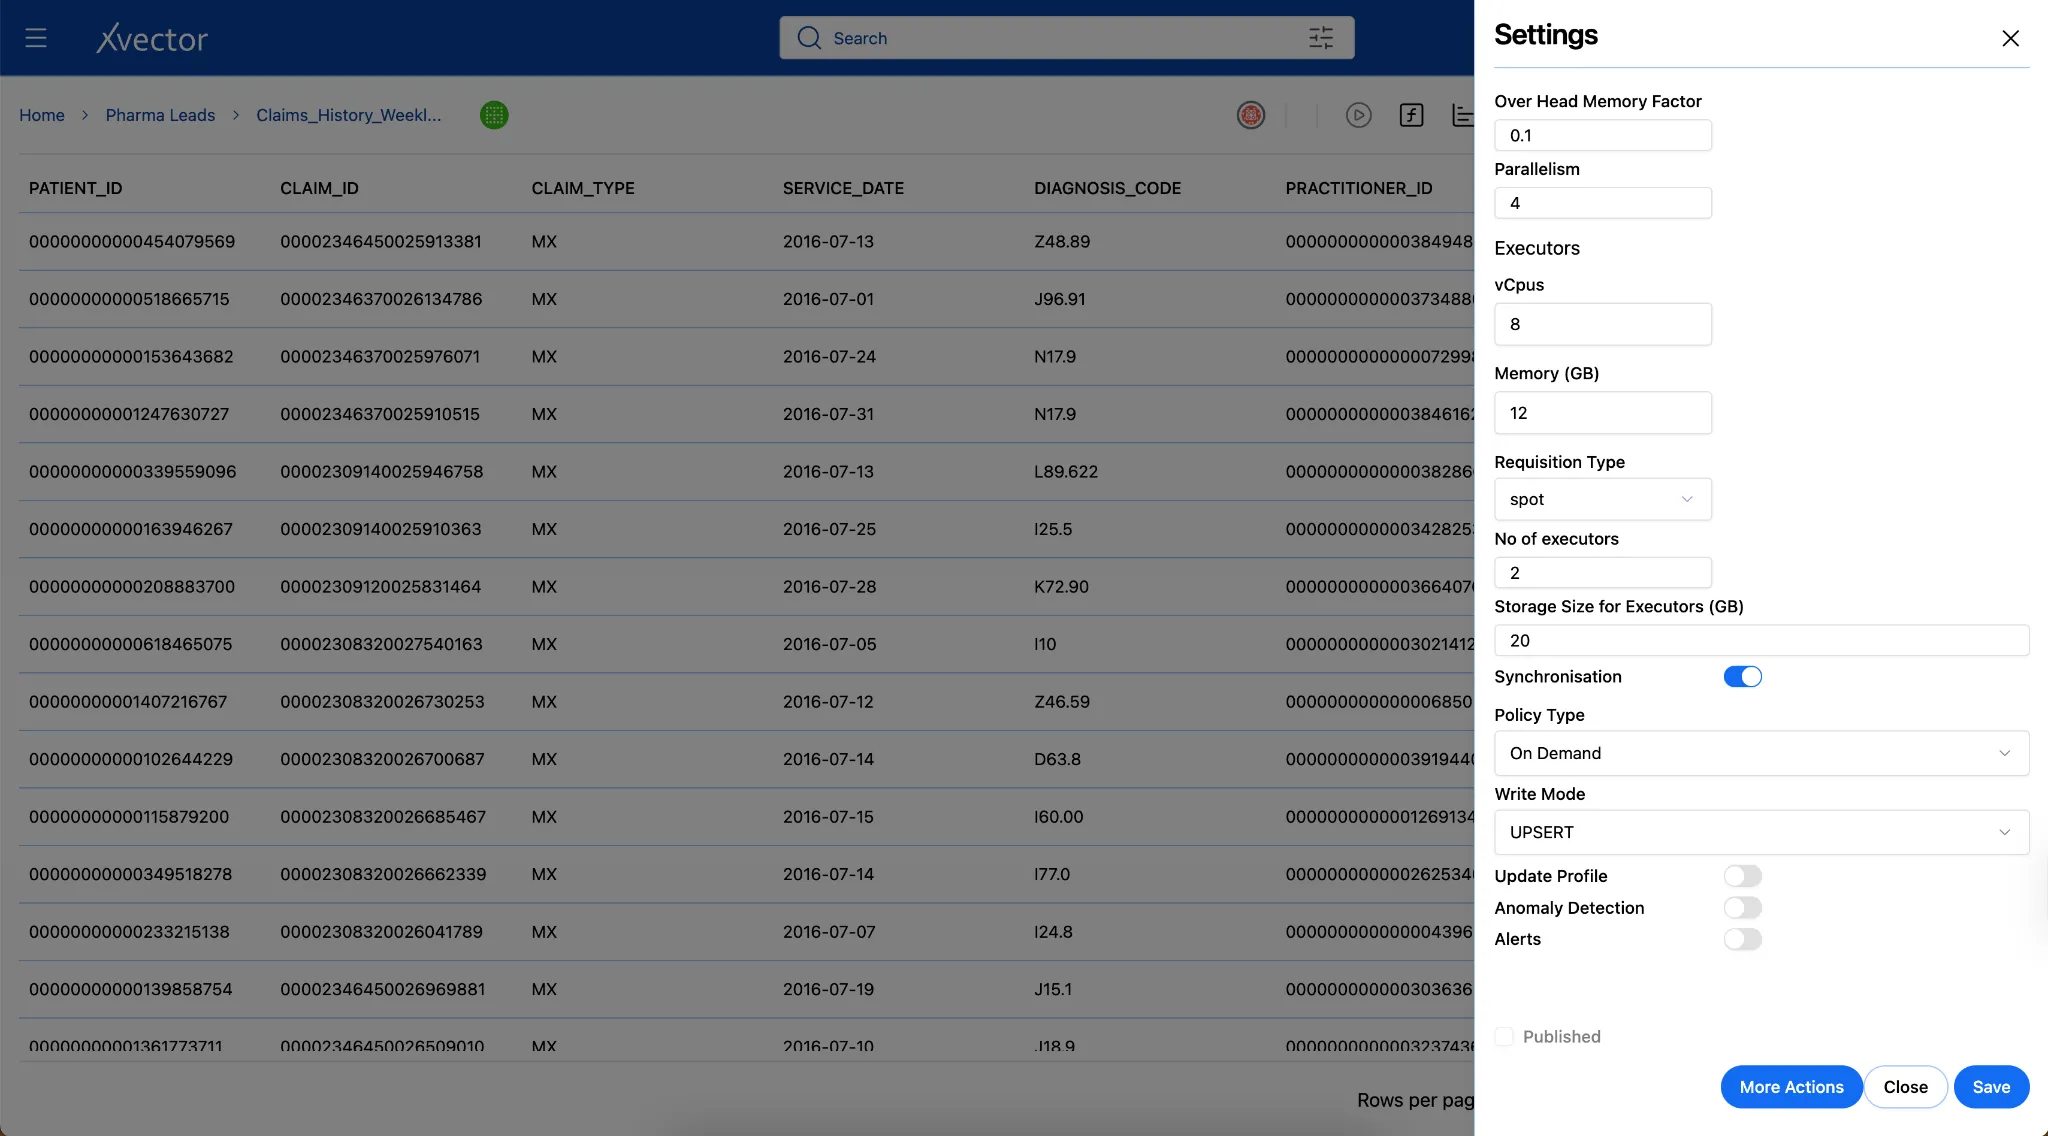
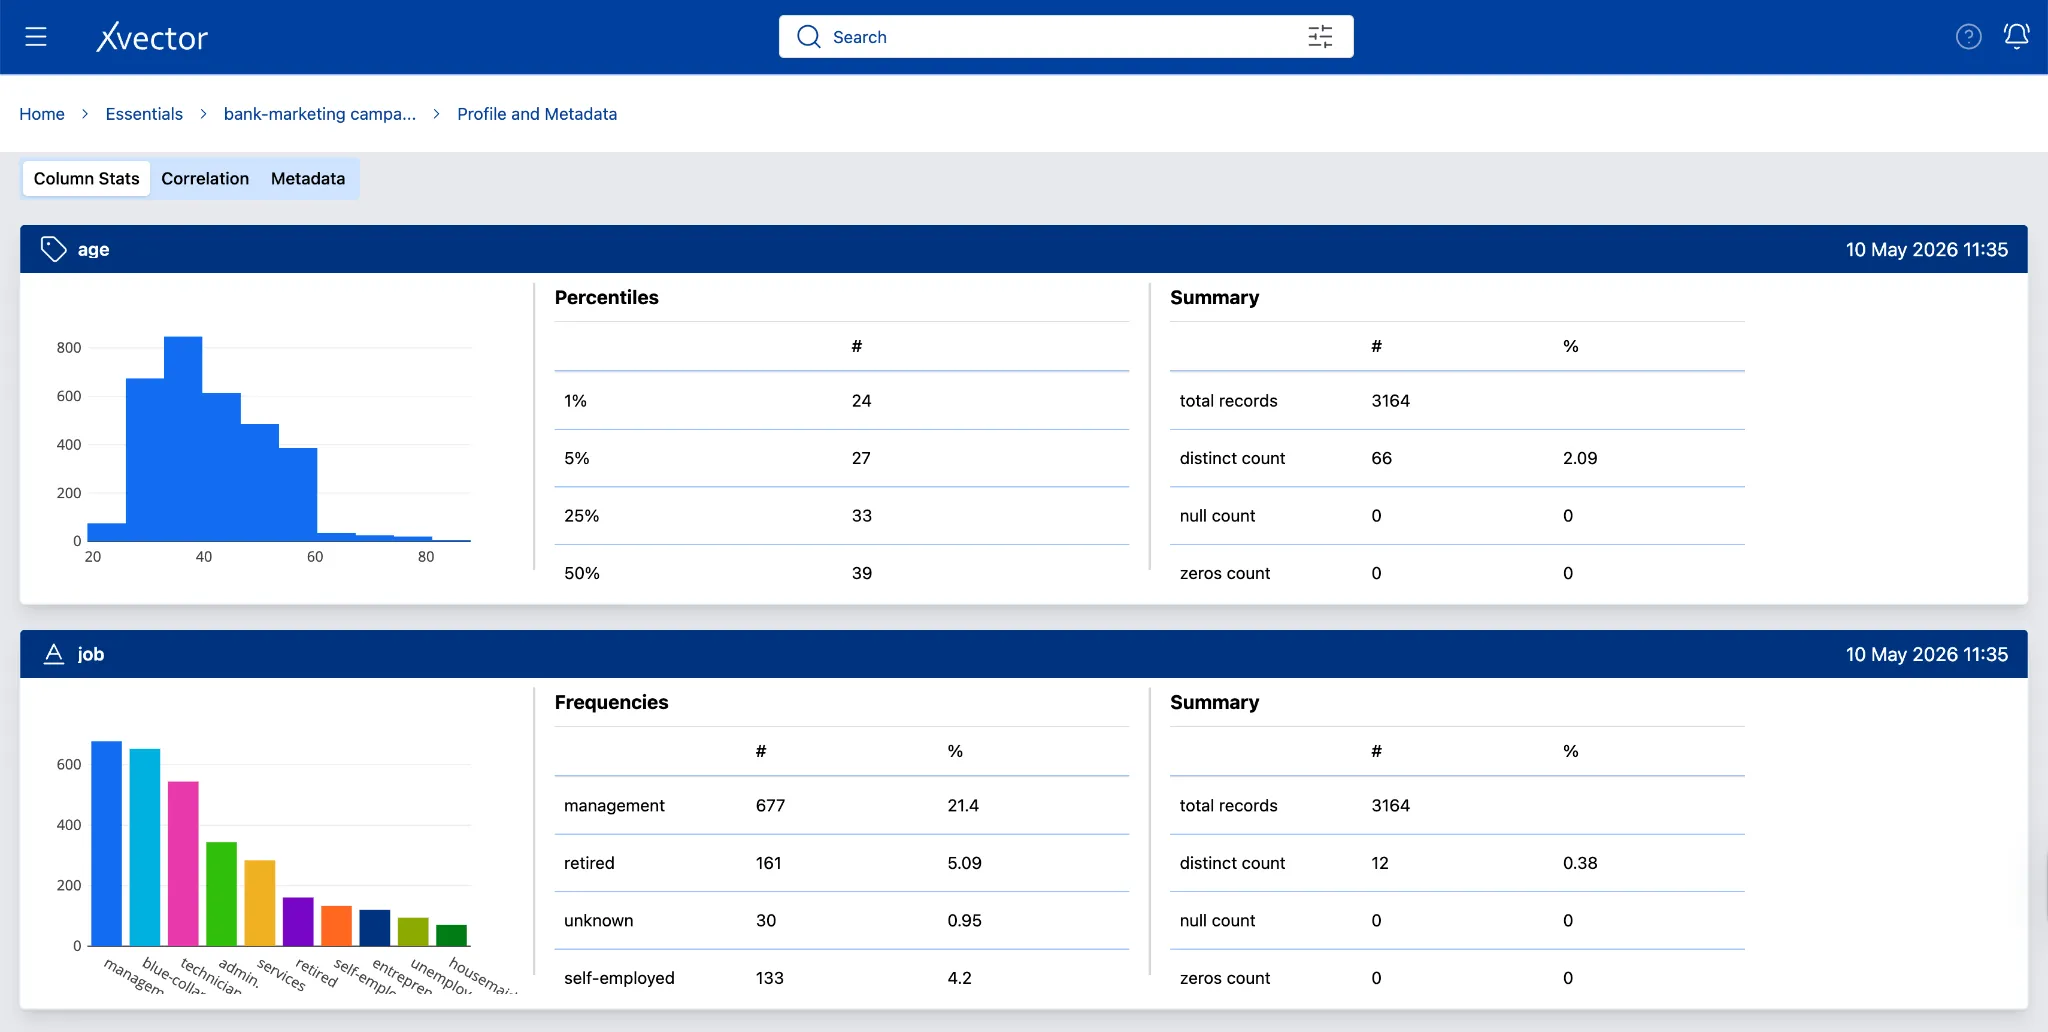
Update Modes
Section titled “Update Modes”xVector provides three options to update datasets: Insert, Upsert, and Bulk Insert.
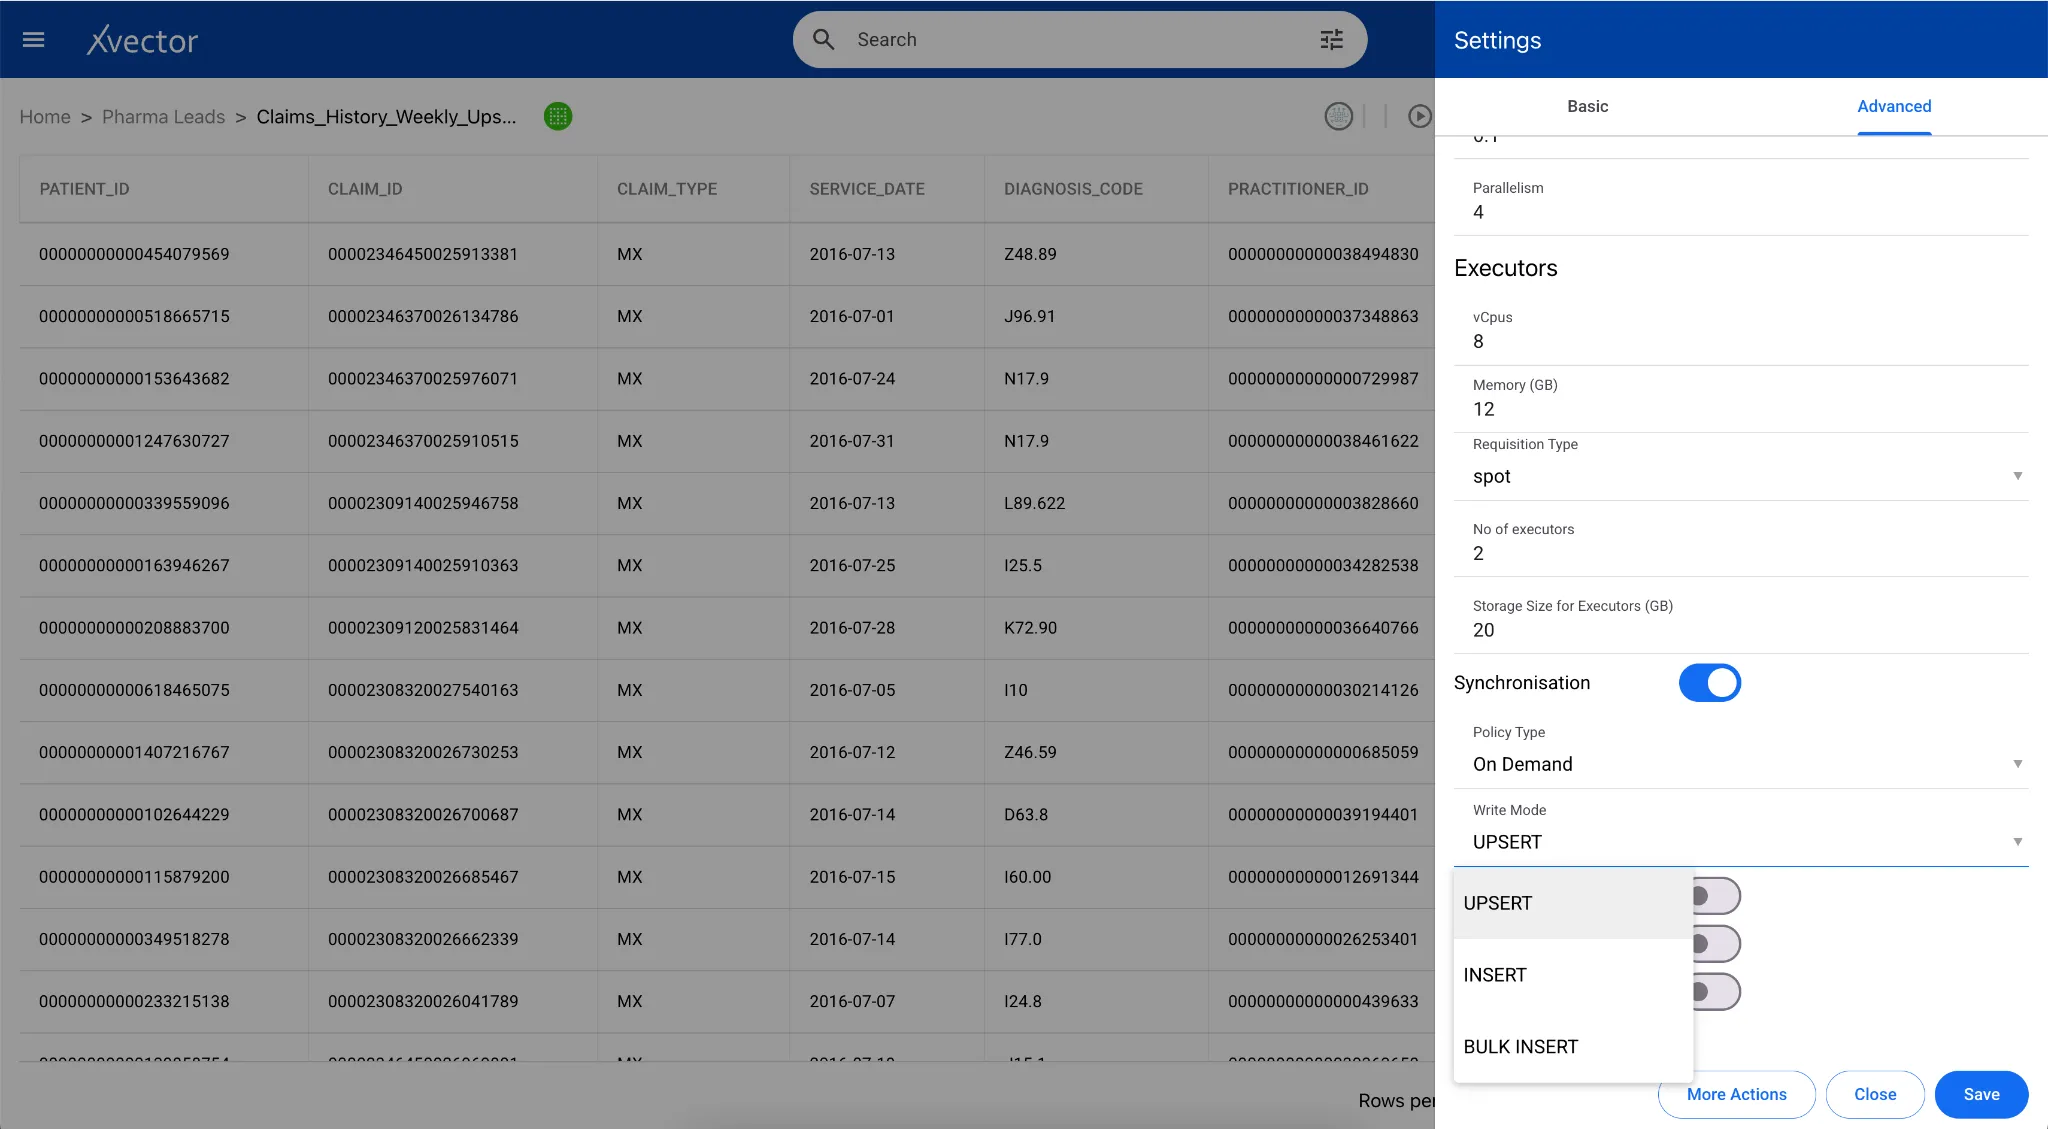
Insert
Section titled “Insert”Insert writes new records into a table without checking for existing matches. Each incoming record is appended as a new row regardless of whether a record with the same key already exists.
This mode is appropriate for append-only datasets such as event logs, transaction records, and CDC append streams, where every record represents a distinct event and no updates are expected. Insert operations have the lowest write overhead, since no key comparisons or file rewriting are required.
Upsert
Section titled “Upsert”An upsert (update + insert) is an operation that updates a row if a matching key already exists, or inserts it if it does not. In traditional data lakes built on raw Parquet or ORC files, efficiently updating or deleting individual rows requires rewriting entire files. Apache Iceberg solves this with native support for row-level mutations.
Iceberg provides two strategies for handling upserts: Copy-on-Write and Merge-on-Read. xVector uses Copy-on-Write as its default strategy. During updates, Iceberg replaces the entire data file with a new version that contains only the changed rows. Reads are very fast since files are clean and compact, but writes can be more expensive.
When configuring a data source in xVector, users specify record keys and choose between bulk insert, insert, or upsert synchronization modes. The platform uses PyIceberg’s upsert API, which identifies matching rows using join columns, loads only the matching subset to minimize I/O, and executes updates and inserts within a single transaction.
Bulk Insert
Section titled “Bulk Insert”Bulk Insert replaces the entire dataset with a fresh load on each synchronization cycle. Rather than appending or merging at the row level, the platform overwrites the existing table contents with the incoming dataset in a single operation. This mode is suited for reference datasets that are periodically republished in full, such as code tables, product catalogs, or externally sourced dimension files. Bulk Insert simplifies pipeline logic by eliminating the need to track changes to individual records, but it assumes that each load represents a complete, current snapshot of the source.
Layer 2: Reference Data Layer
Section titled “Layer 2: Reference Data Layer”Organizing, cleaning, enriching, and standardizing data into governed, analytics-ready domains.
The Reference Data Layer organizes ingested data into logical business domains that align with analytical needs. In the SaaS Enterprise App, domains include Customer, Product, Sales, and Marketing Analytics. This layer serves as the curated foundation for all analytics, dashboards, and models.
Profiling and Quality
Section titled “Profiling and Quality”Raw data arrives with inconsistencies that compromise analytical accuracy. Data quality frameworks implement systematic validation to detect and help users remediate issues before they propagate downstream.
Validation Rules: Validation rules enforce required fields and data constraints. xVector handles validation through filtering and enrichment: remove records with null values or apply enrichment actions to fill nulls with default values. For complex validation logic, users can write custom expressions that evaluate record validity based on multiple conditions.
In the case of the Pharma Leads App, instead of bringing in all the 800 million records, since the business wants to understand claims analytics, all claims should, at a minimum, have a claim ID. We filter out records with a null claim ID.
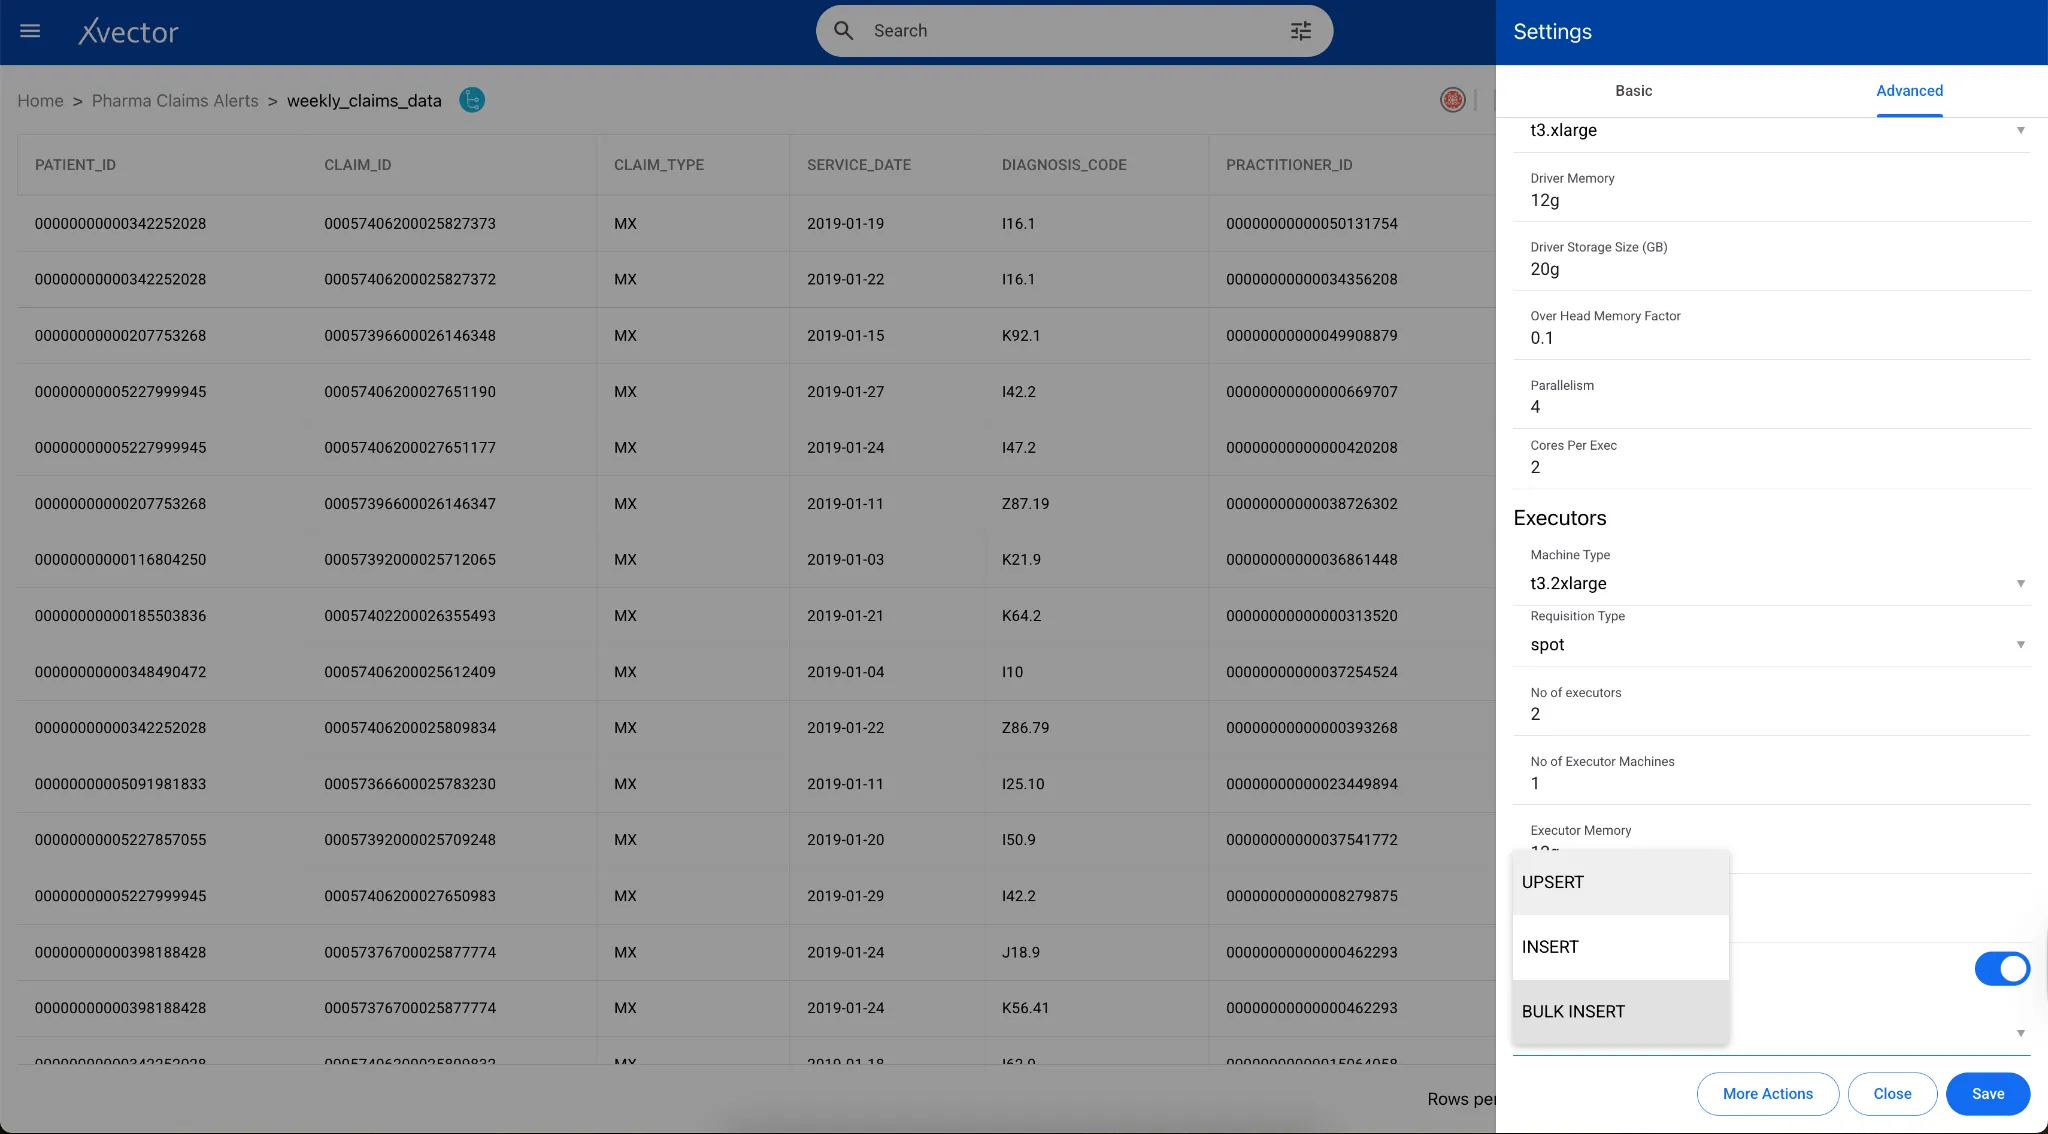
Data Profiling: Systematically analyze datasets to understand structure, quality, and statistical properties. xVector provides out-of-the-box profile reports, custom column-level profiling, and histogram visualizations.
Profile Metadata — Dataset
Data profiling computes statistics, including minimum/maximum values, missing records, and the frequency of distinct values. Anomalies can be identified when exploring the data in the profile page and handled appropriately.
Anomaly Detection: The user can run anomaly detection to identify outliers or anomalies in the data.
The Metadata Updates section of “Layer 1: Digital Twin Layer” applies equally to all datasets across the Reference Data Layer.
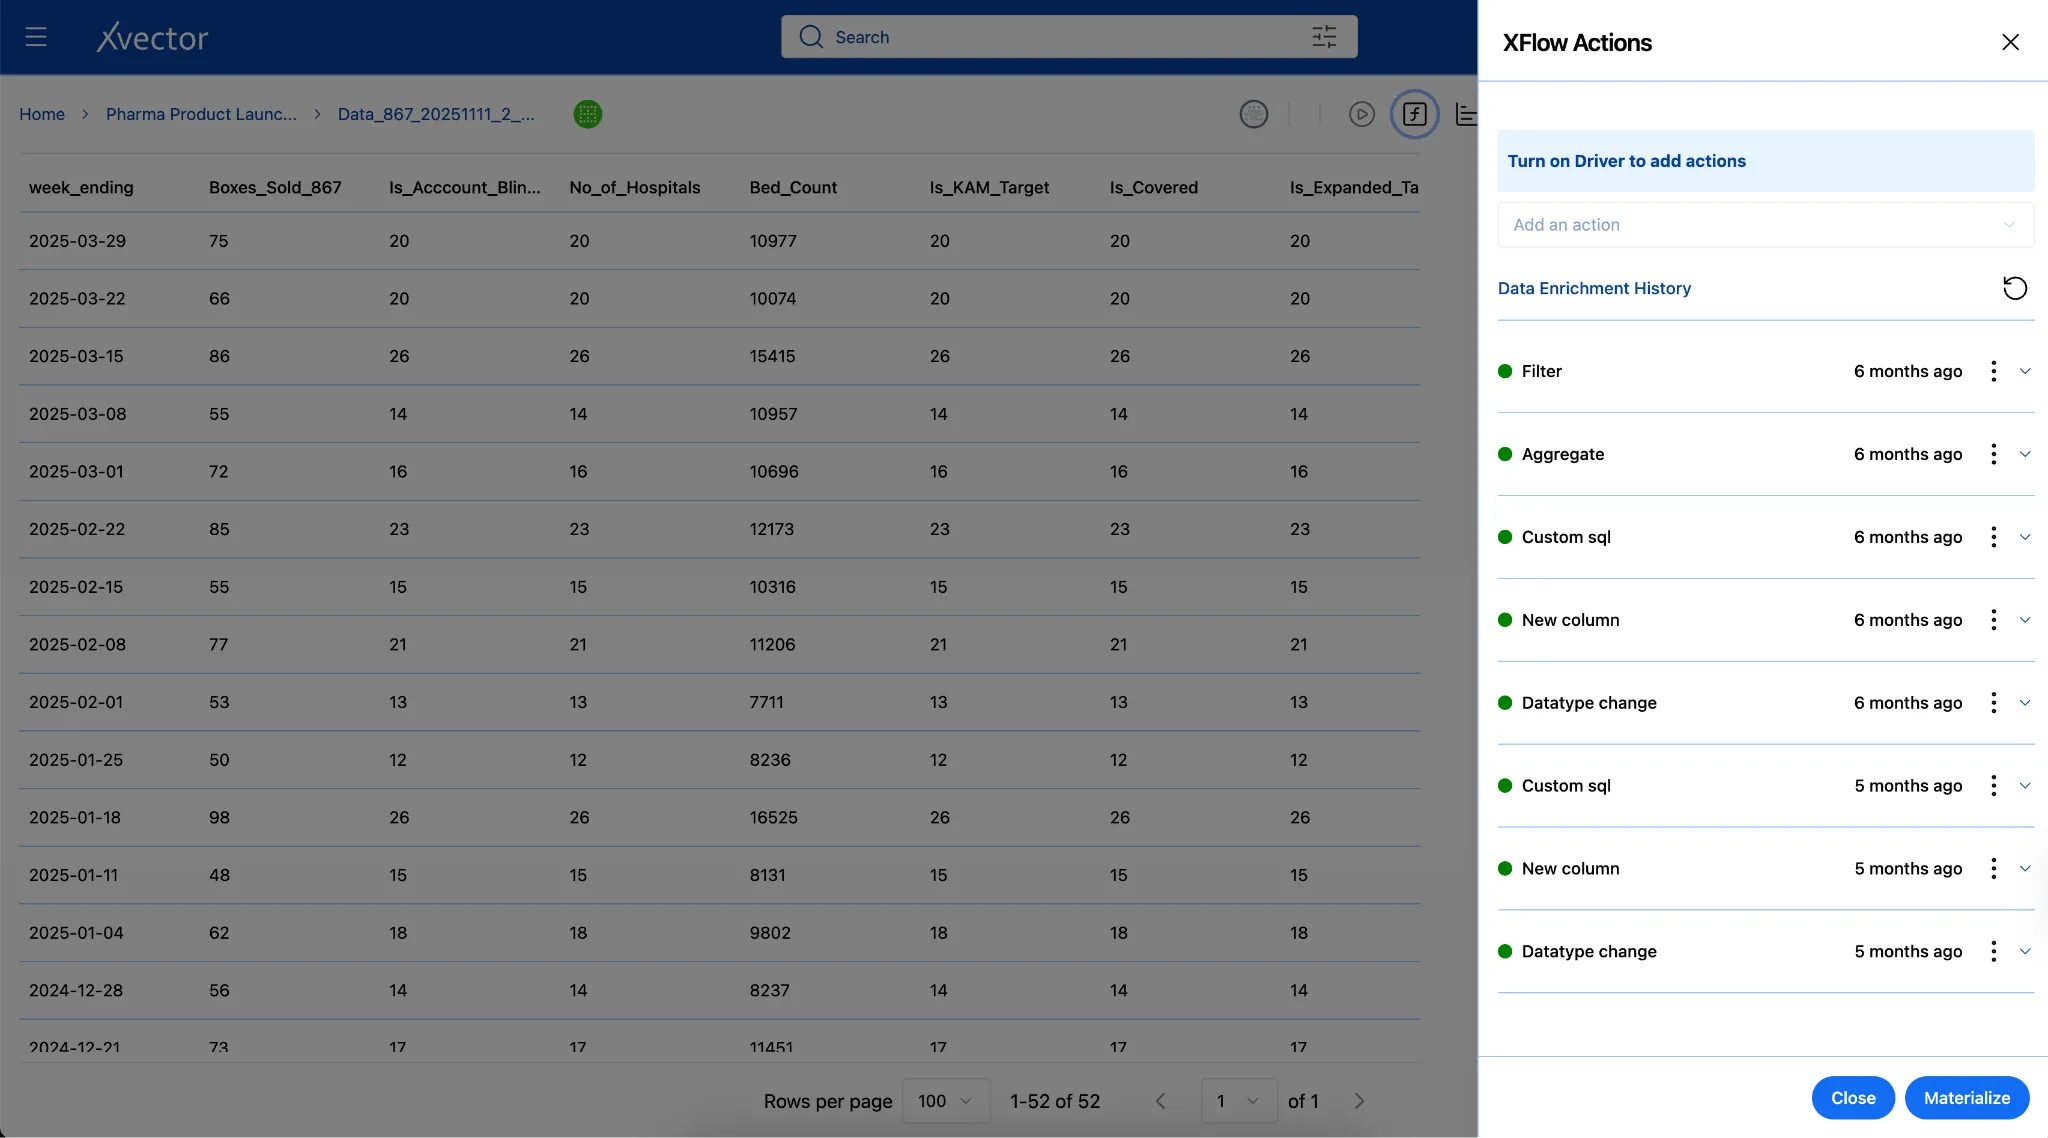
Data Enrichment
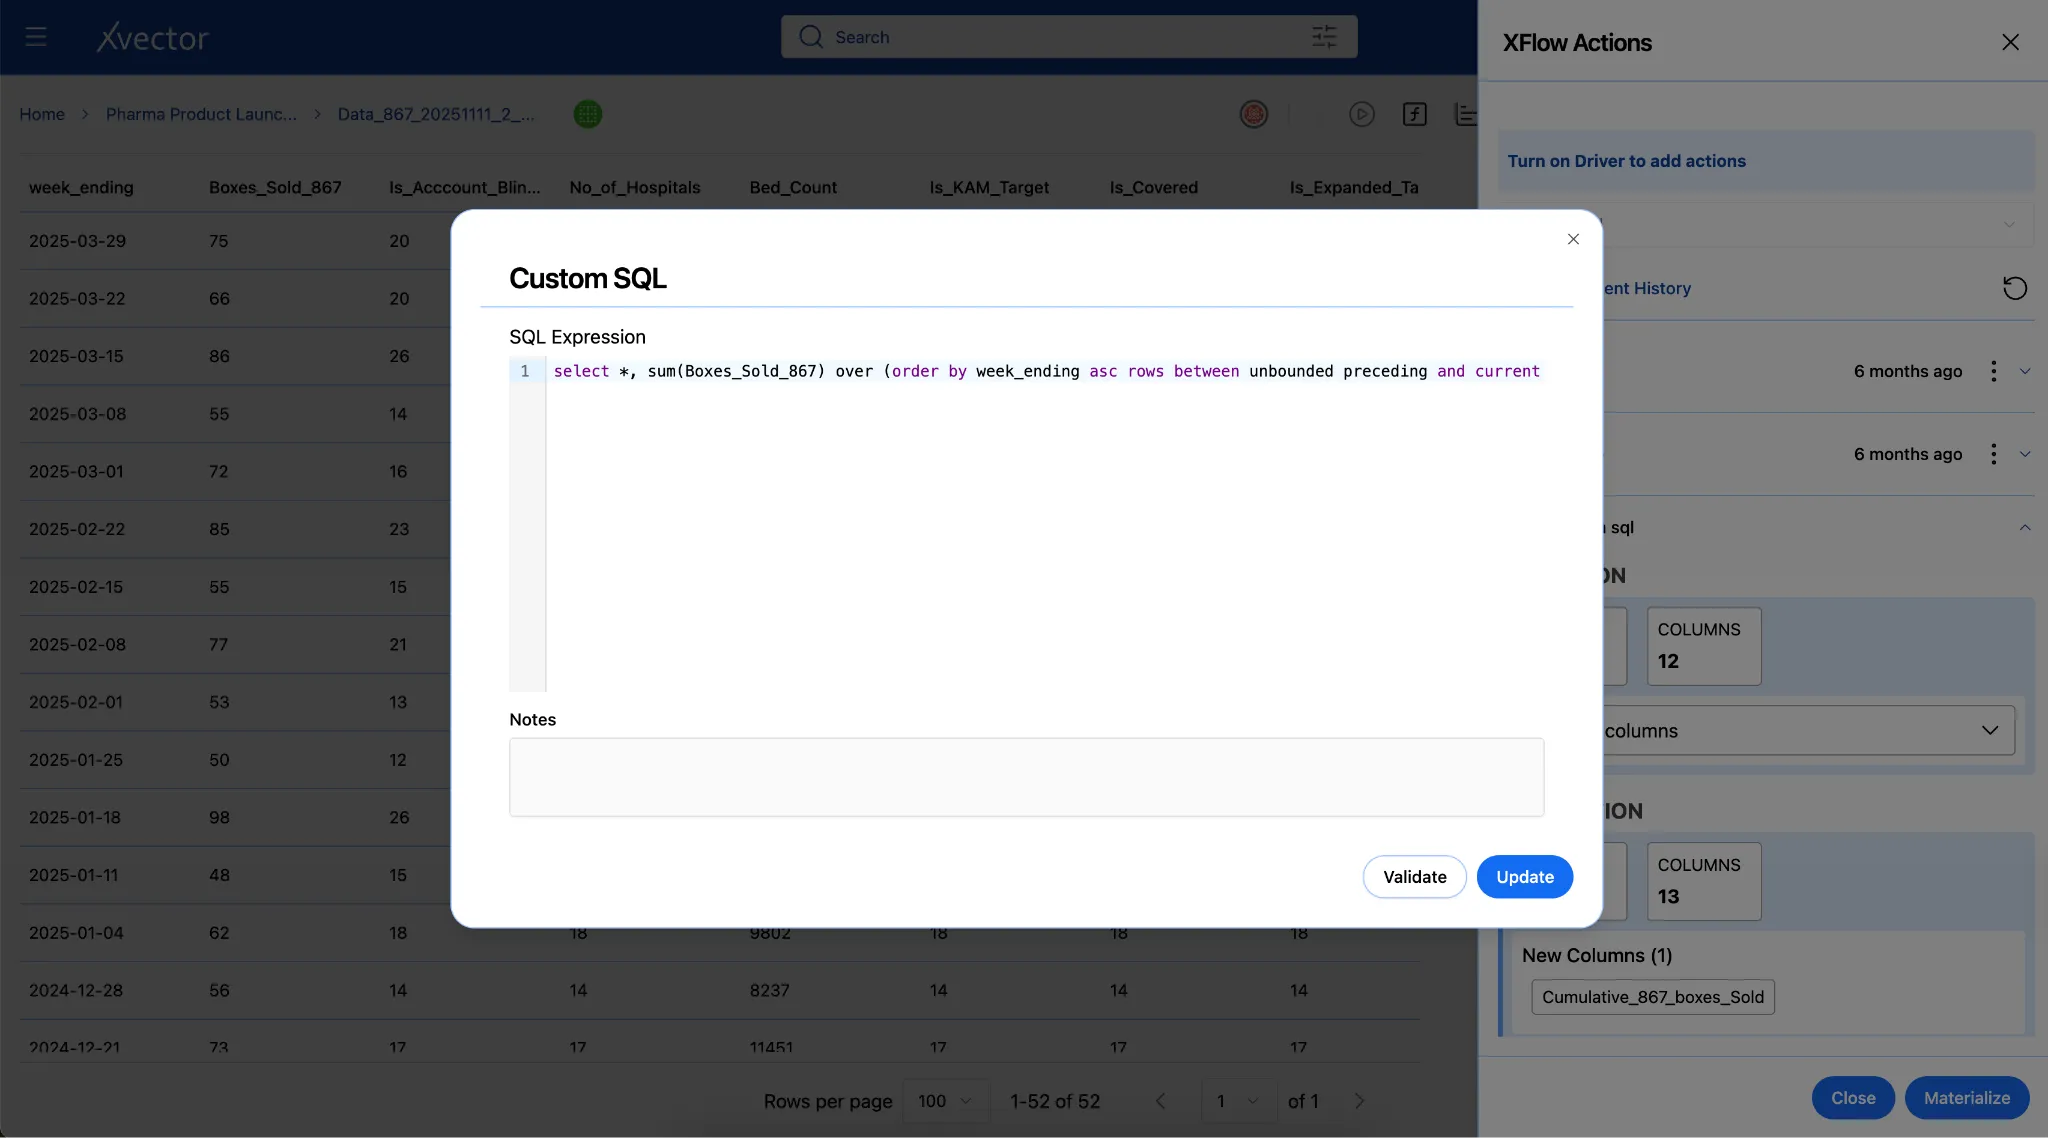
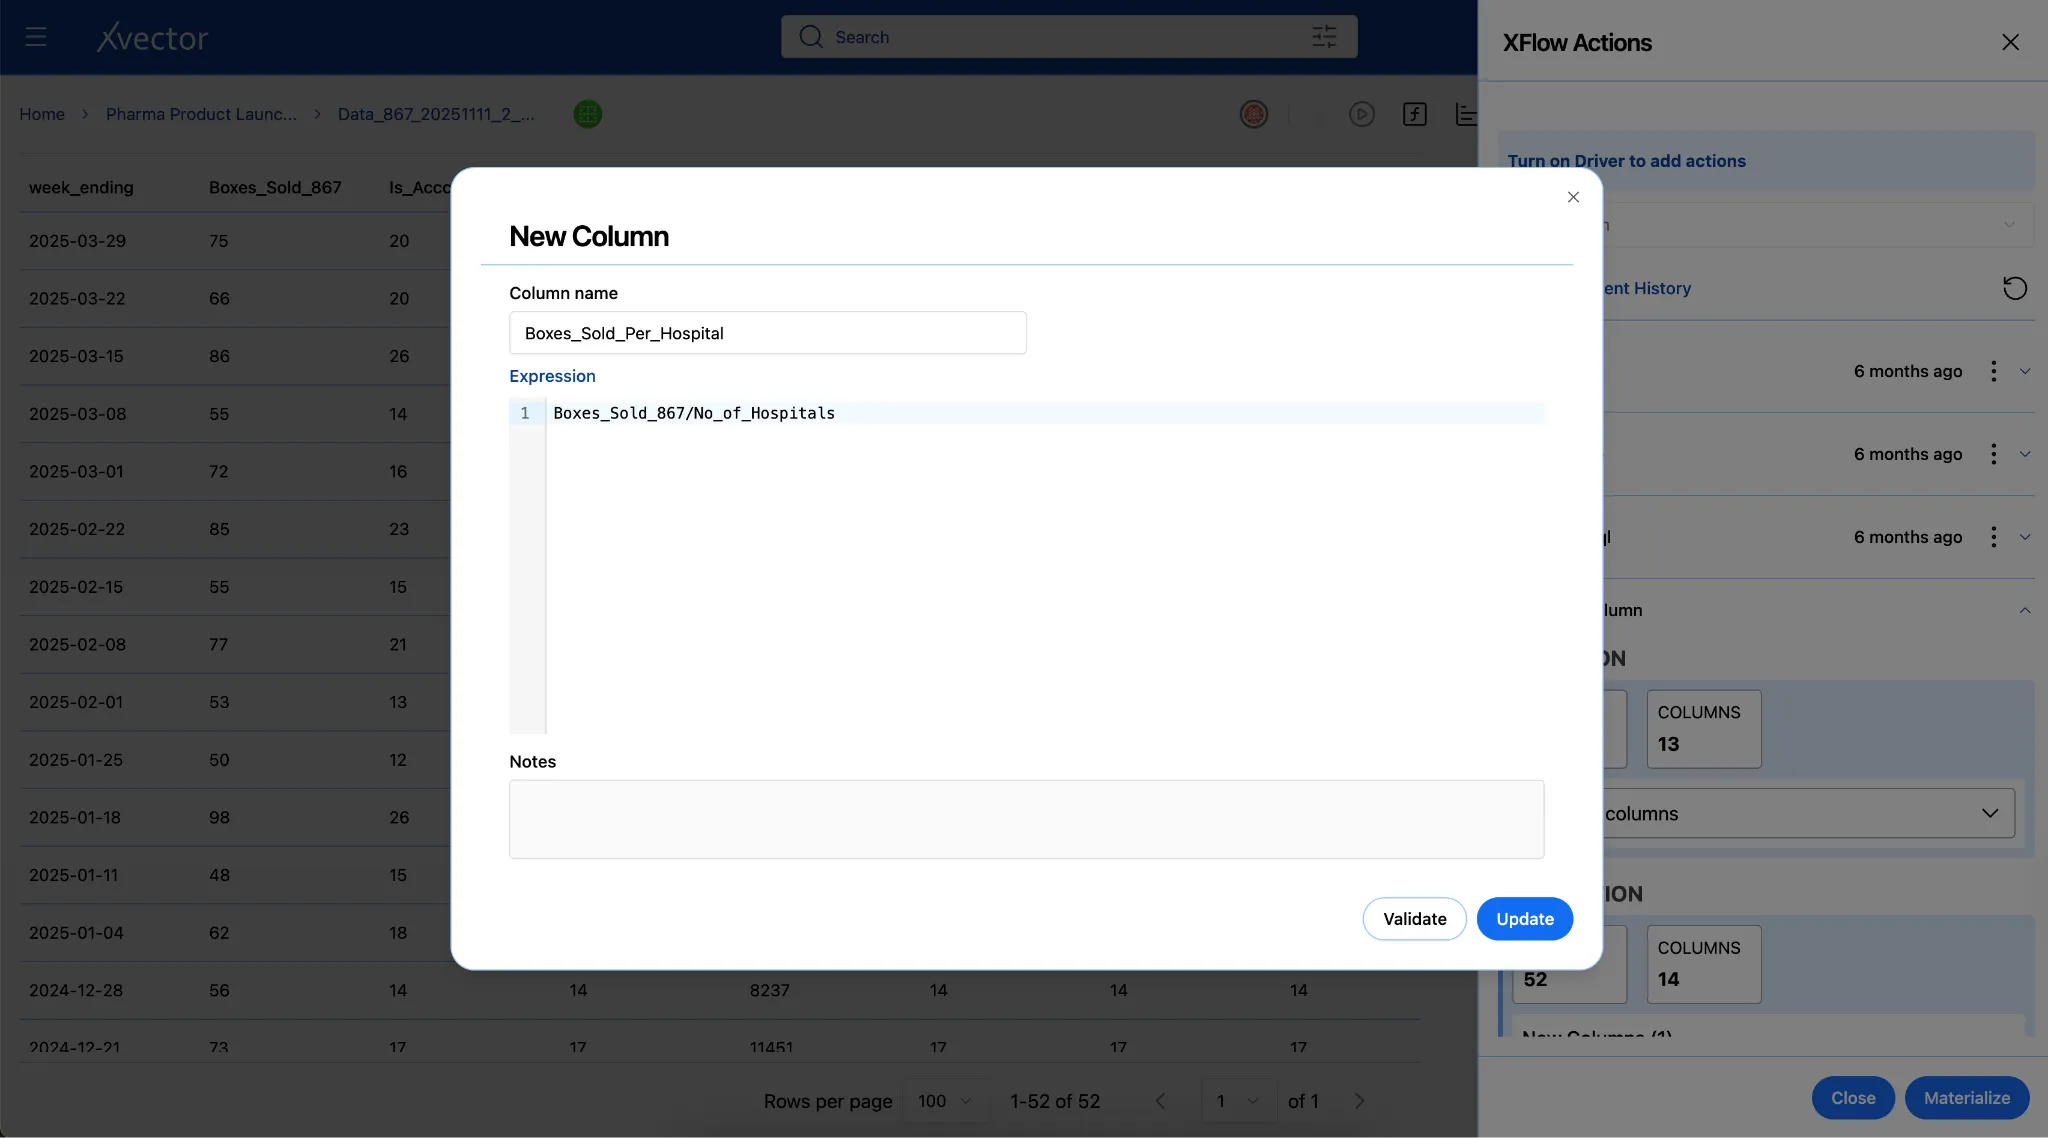
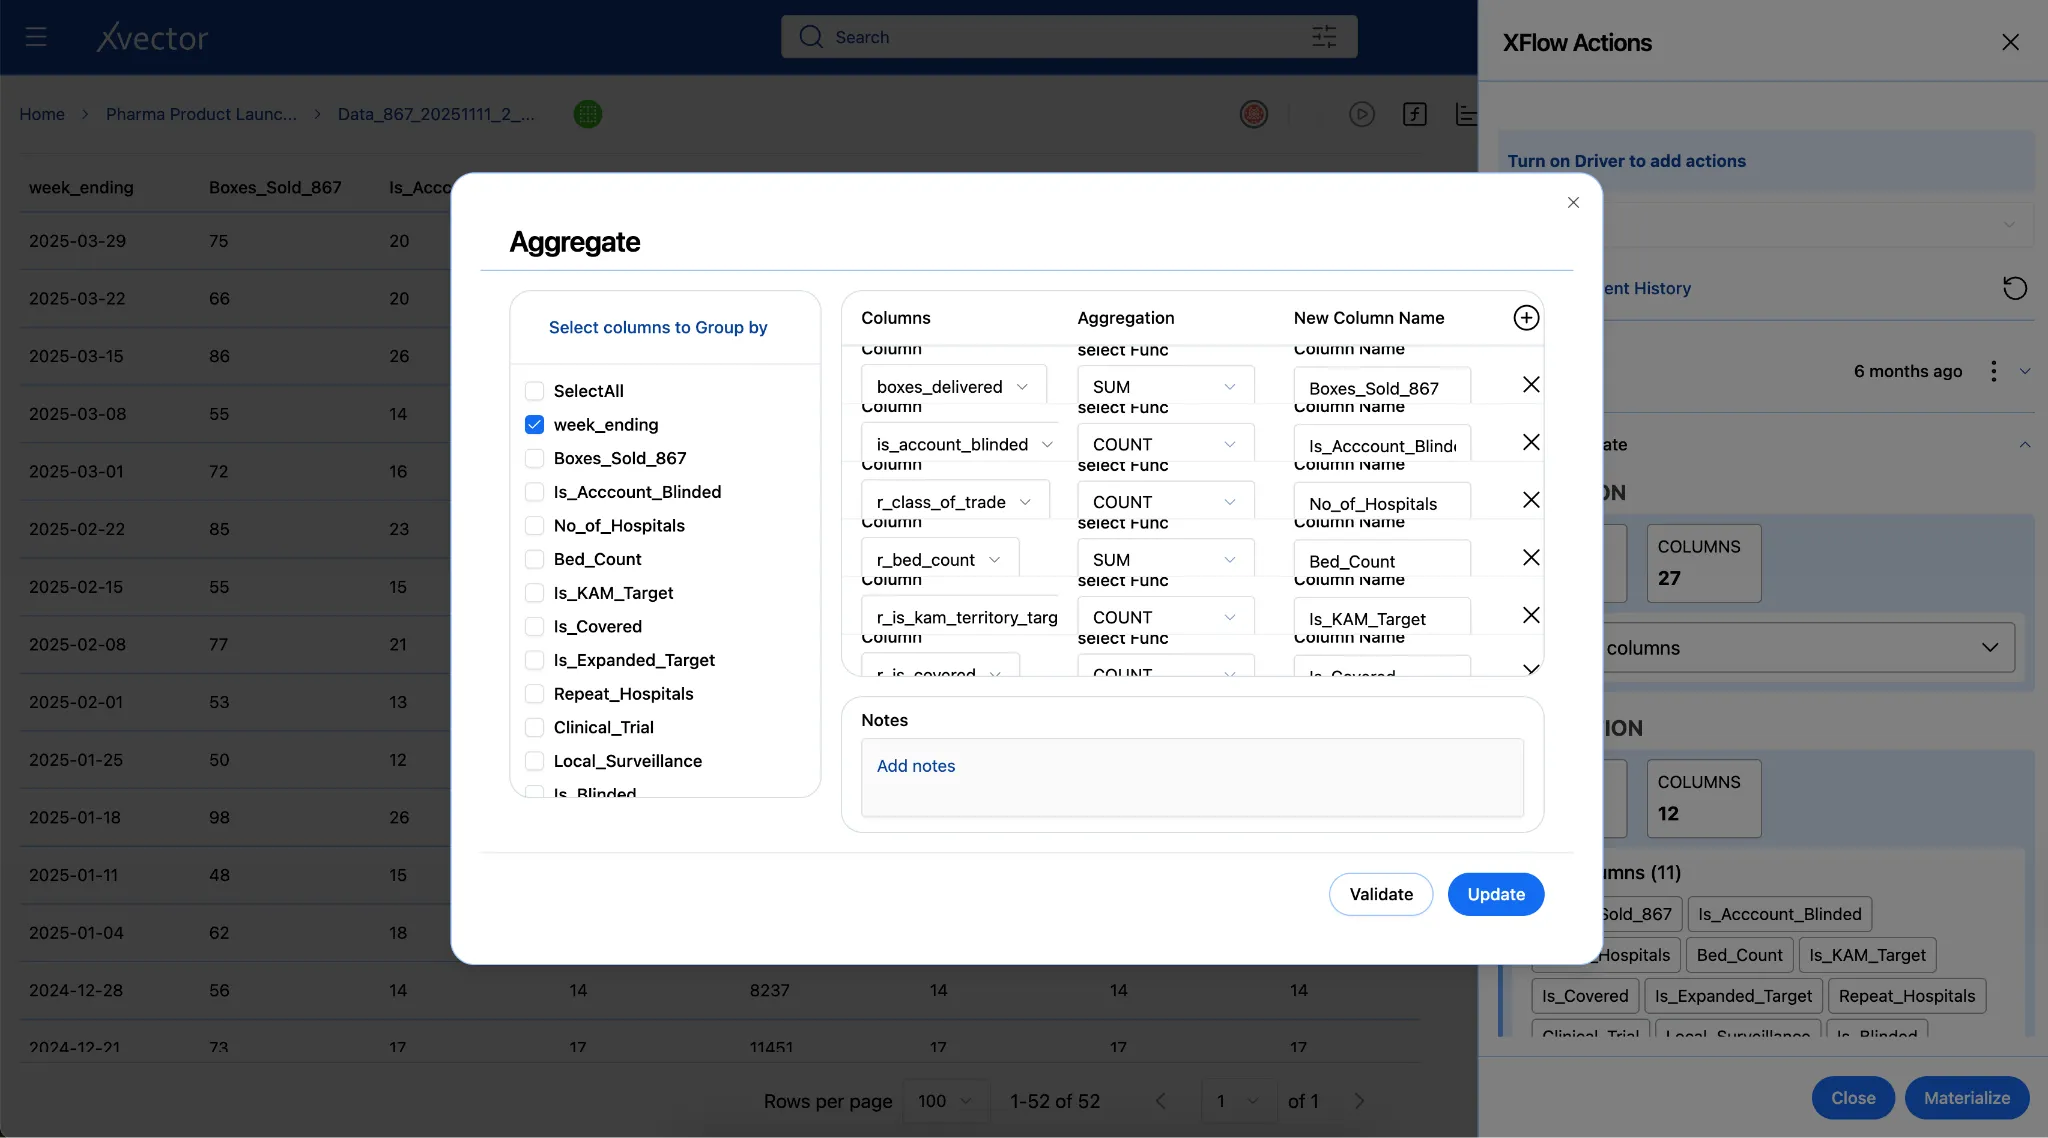
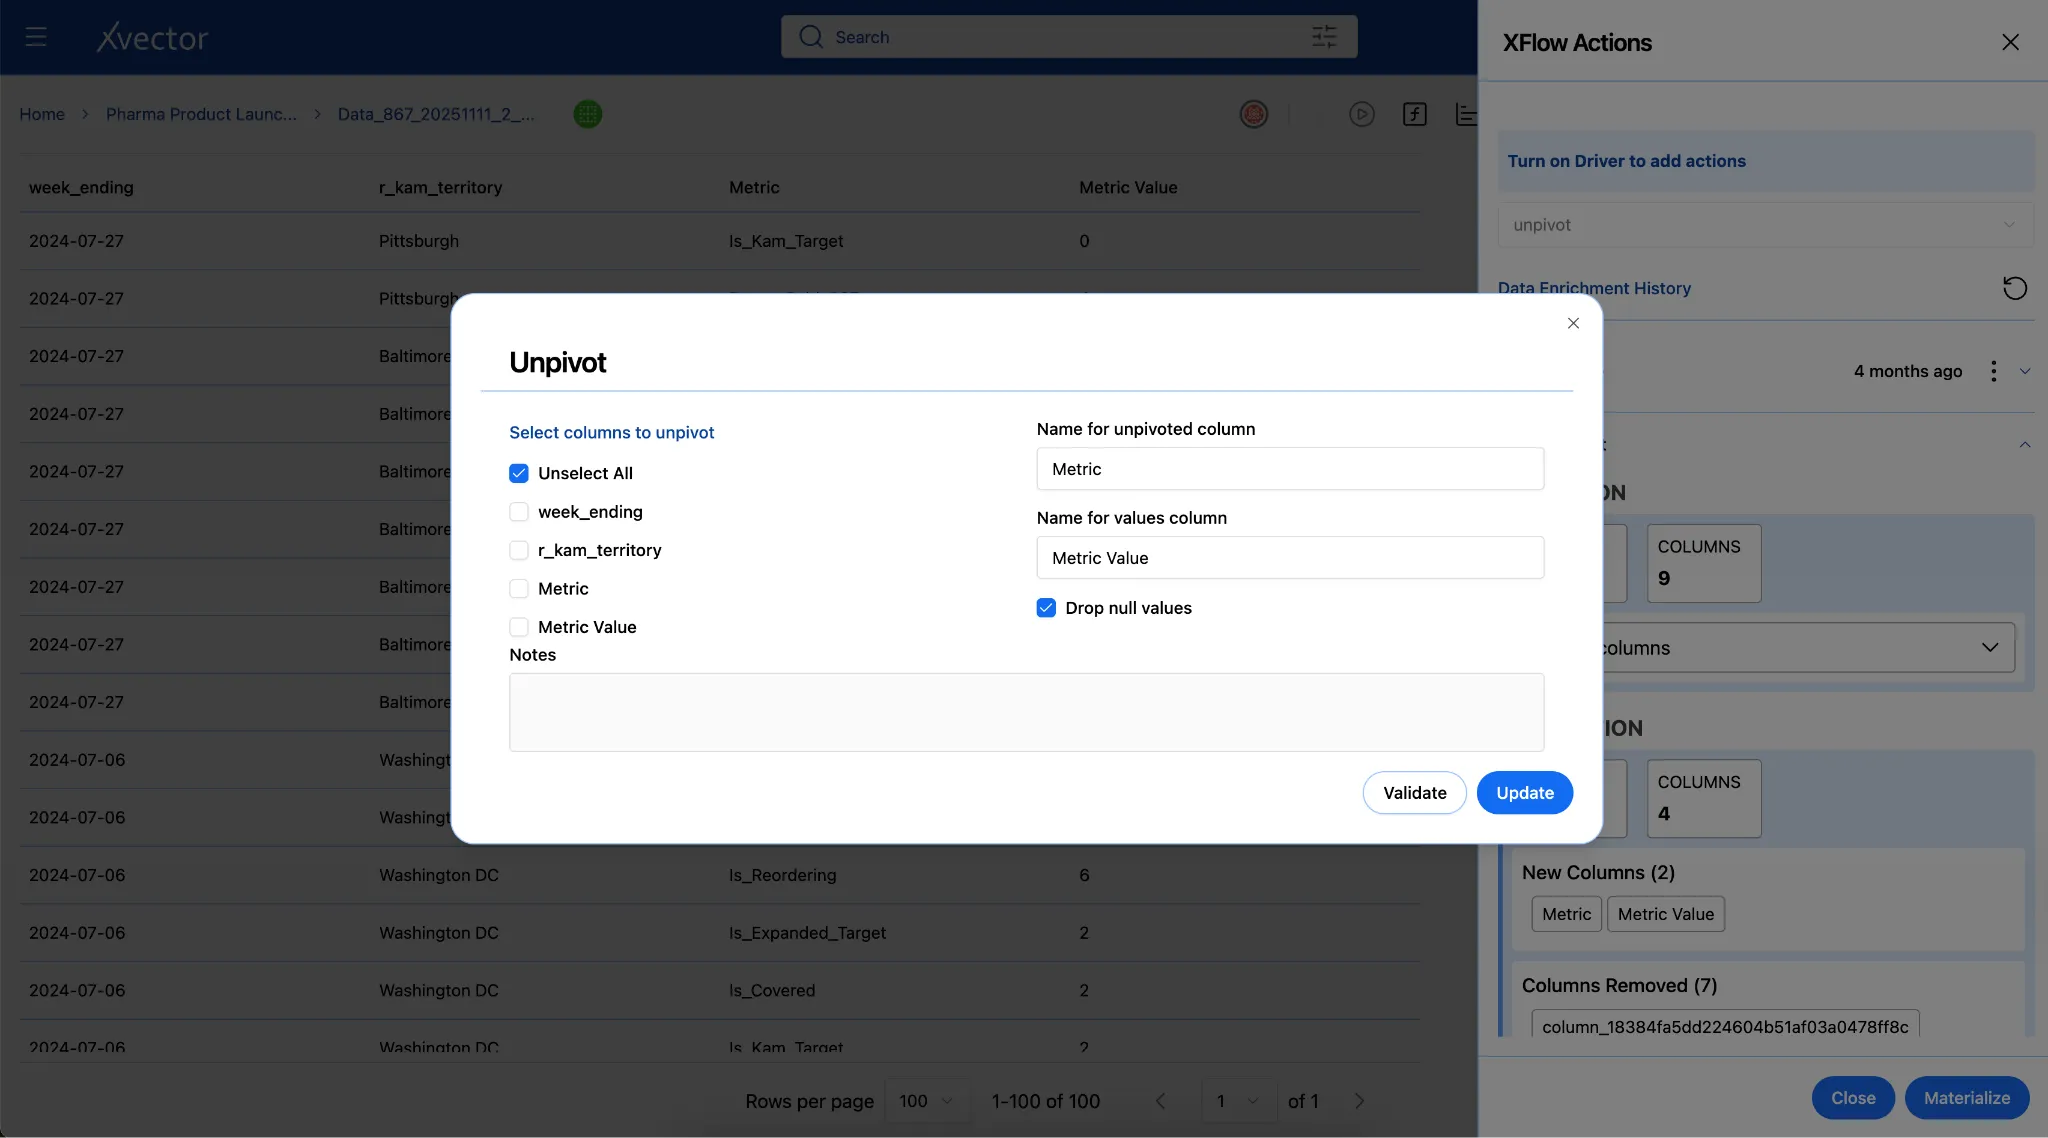
Section titled “Data Enrichment”Raw data captures what happened but rarely includes the context needed to understand why it matters. Enrichment augments source data with additional attributes, external context, and derived insights, transforming operational logs into analytical assets. Users can apply appropriate enrichment functions to make data analytics-ready.
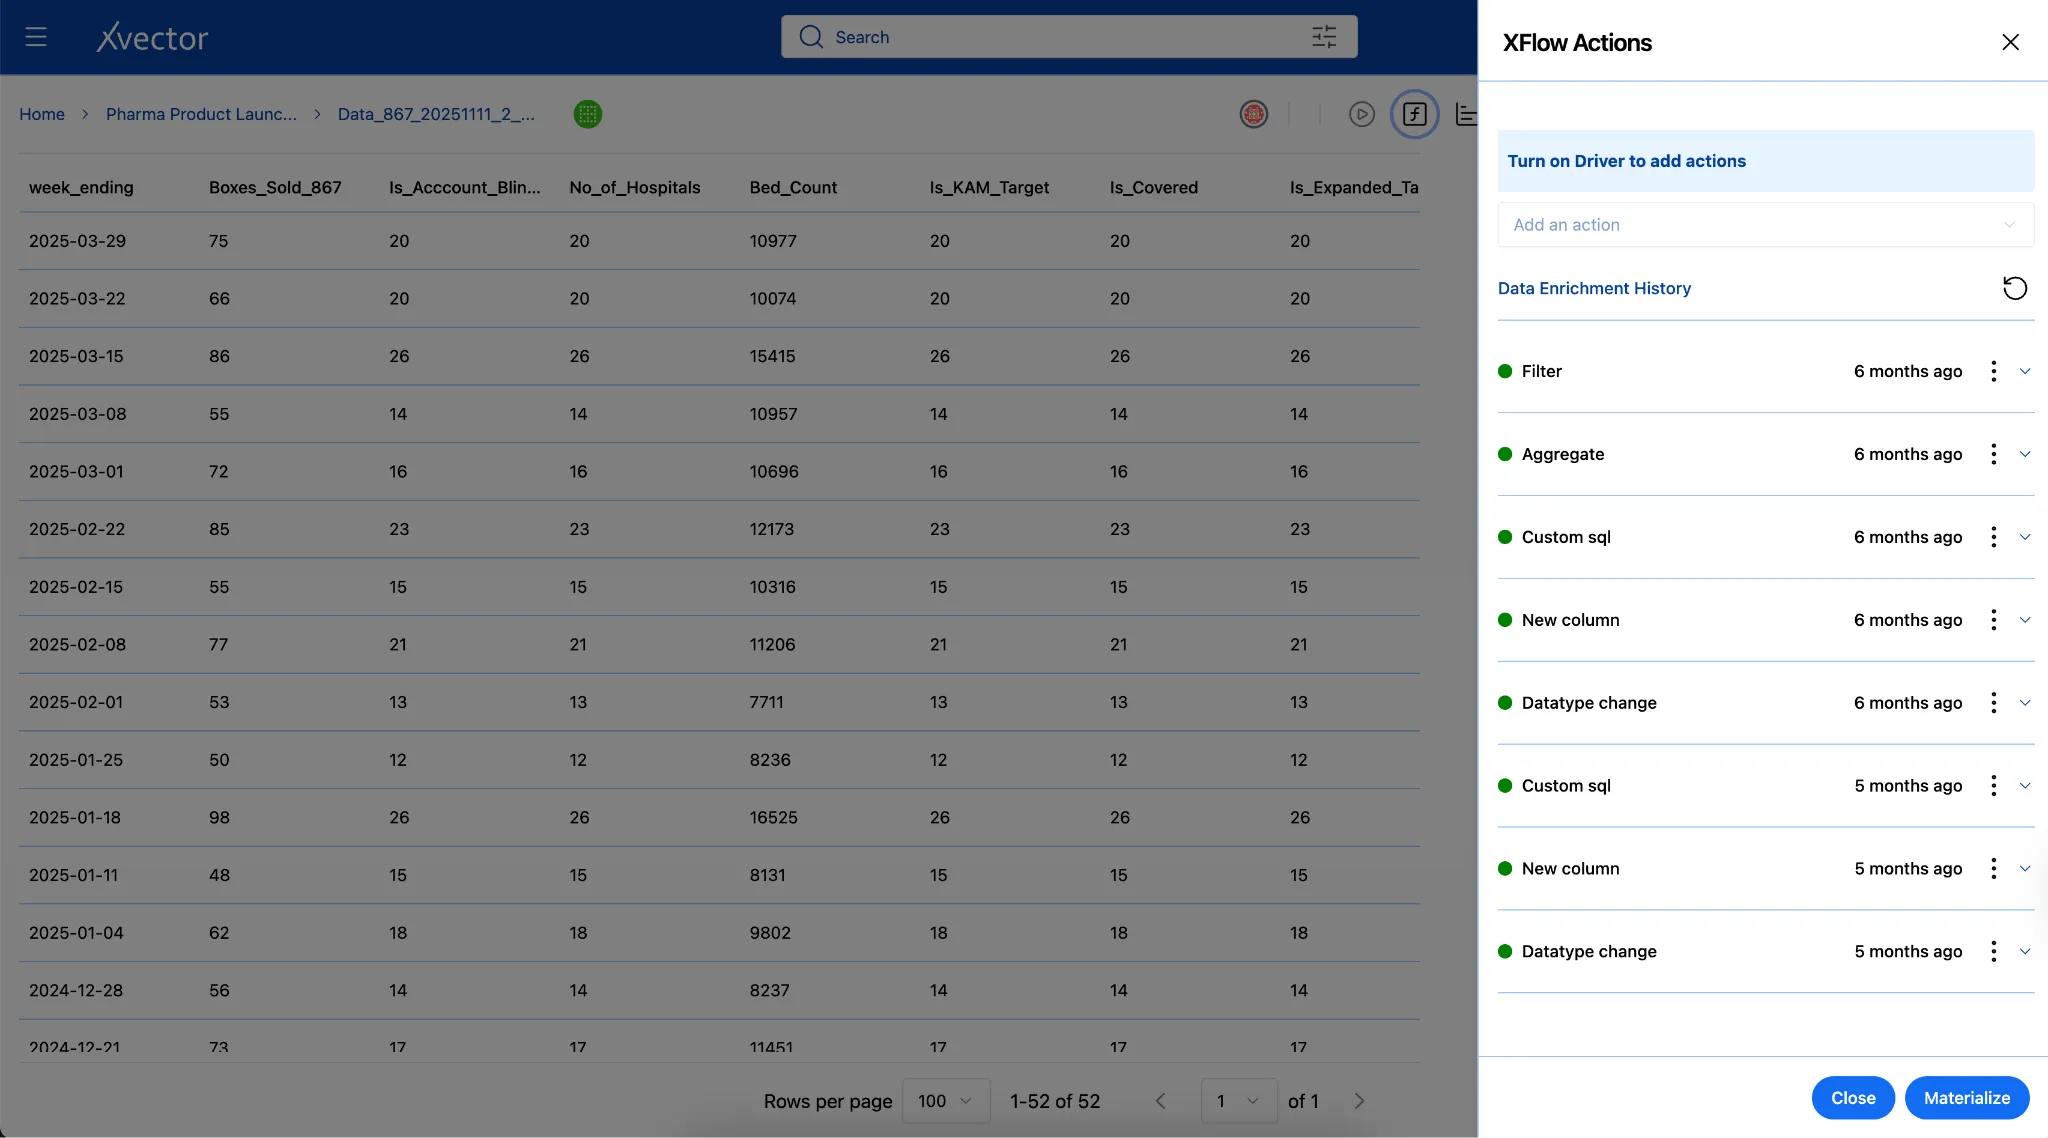
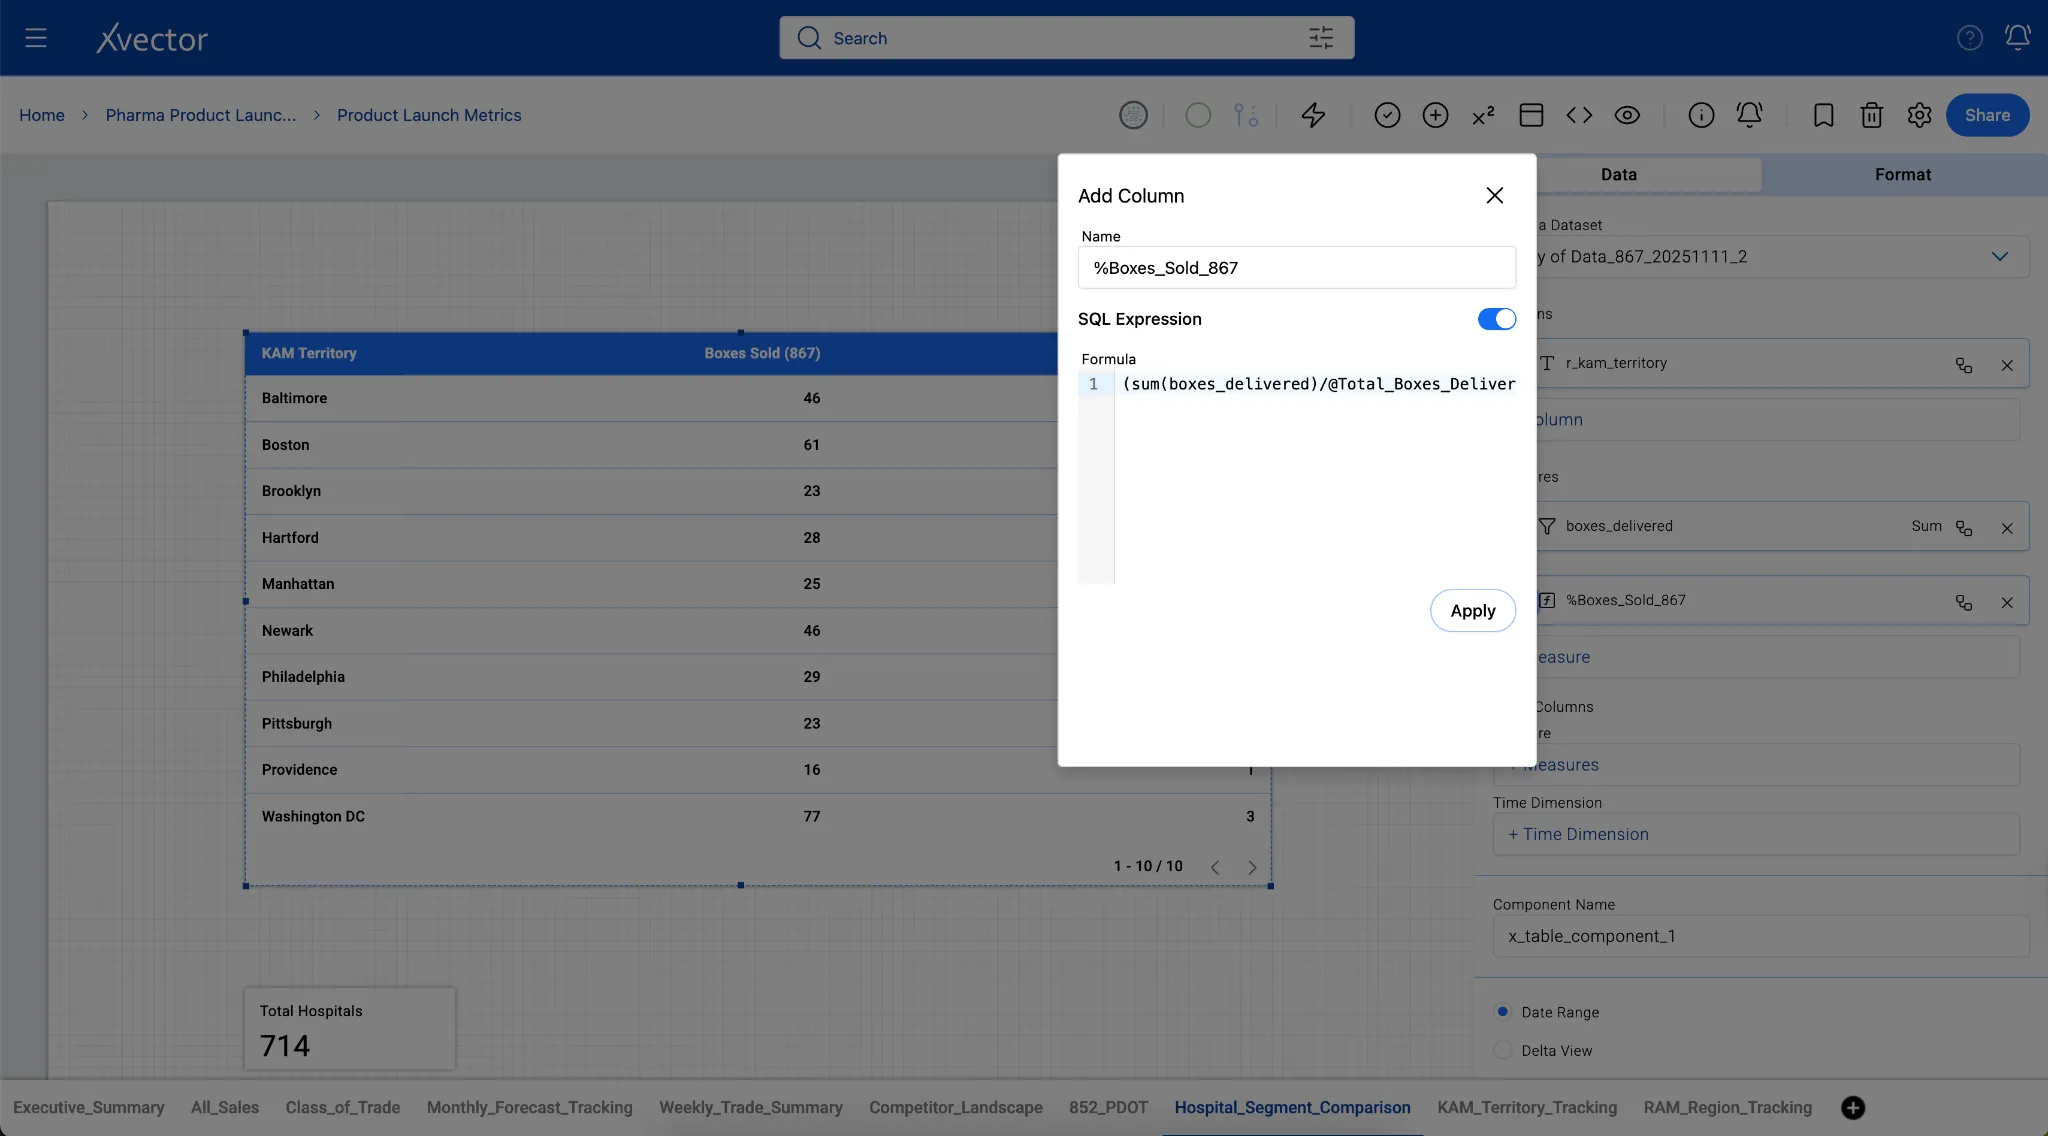
Below are examples from the Pharma Product Launch Metrics App:
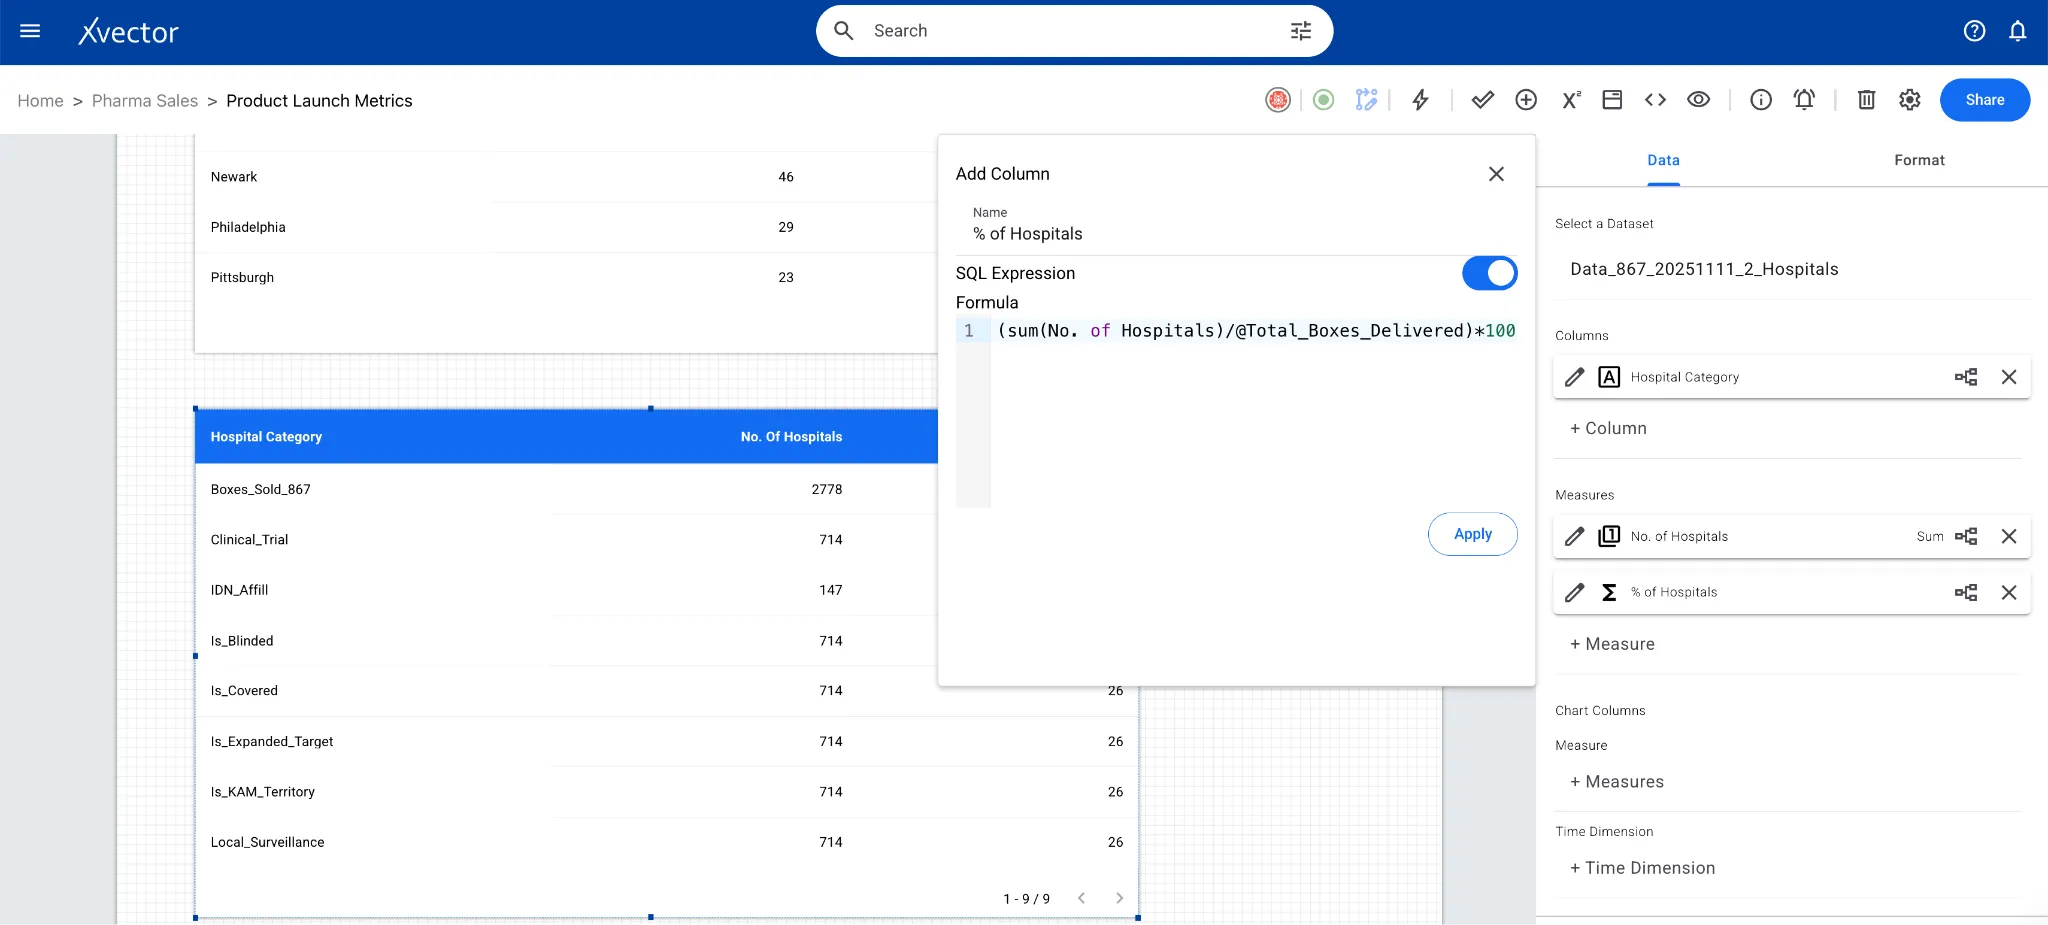
Custom SQL: Add derived columns via custom SQL queries.
New Column: Author custom functions to create new derived columns.
Aggregates: Group by week ending, aggregate by boxes delivered, is KAM target, etc.
Pivot / Unpivot: Reshape data between wide and long formats for different analytical needs.
Edit Datasets
Section titled “Edit Datasets”The xVector Platform supports inline editing of dataset content directly within the workspace, without requiring users to re-ingest or re-transform data. This is particularly useful for correcting individual records, updating image annotation labels, or refining entity extractions from text data before downstream consumption.
- The user can edit the dataset inline — that is, they can edit a cell value.
- The user can annotate images. They can add/edit/delete labels.
- For Entity extraction of text data, the user can edit/delete entities.
Materialization
Section titled “Materialization”Materialization stores transformed data in the object store to persist it, improving query performance and avoiding repetitive calculations. Instead of recalculating transformations for every query, materialization stores the result for reuse, reducing query latency and computational costs.
The xVector Platform writes transformed data back to the object store using one of three modes: Overwrite (replace the dataset, with optional storage layout changes), Write as New (add new data without modifying the existing dataset), or Modify/Append (update existing records or insert new ones using Copy-on-Write semantics).
Synchronization
Section titled “Synchronization”Synchronization for datasets in the Reference Data Layer follows the same policy-based approach as the Digital Twin Layer, using On-Demand, On-Event, On-Schedule, and Rules-based update policies. See the Synchronization section under Layer 1: Digital Twin Layer for the full specification of record keys, synchronization modes, and dependency chains.
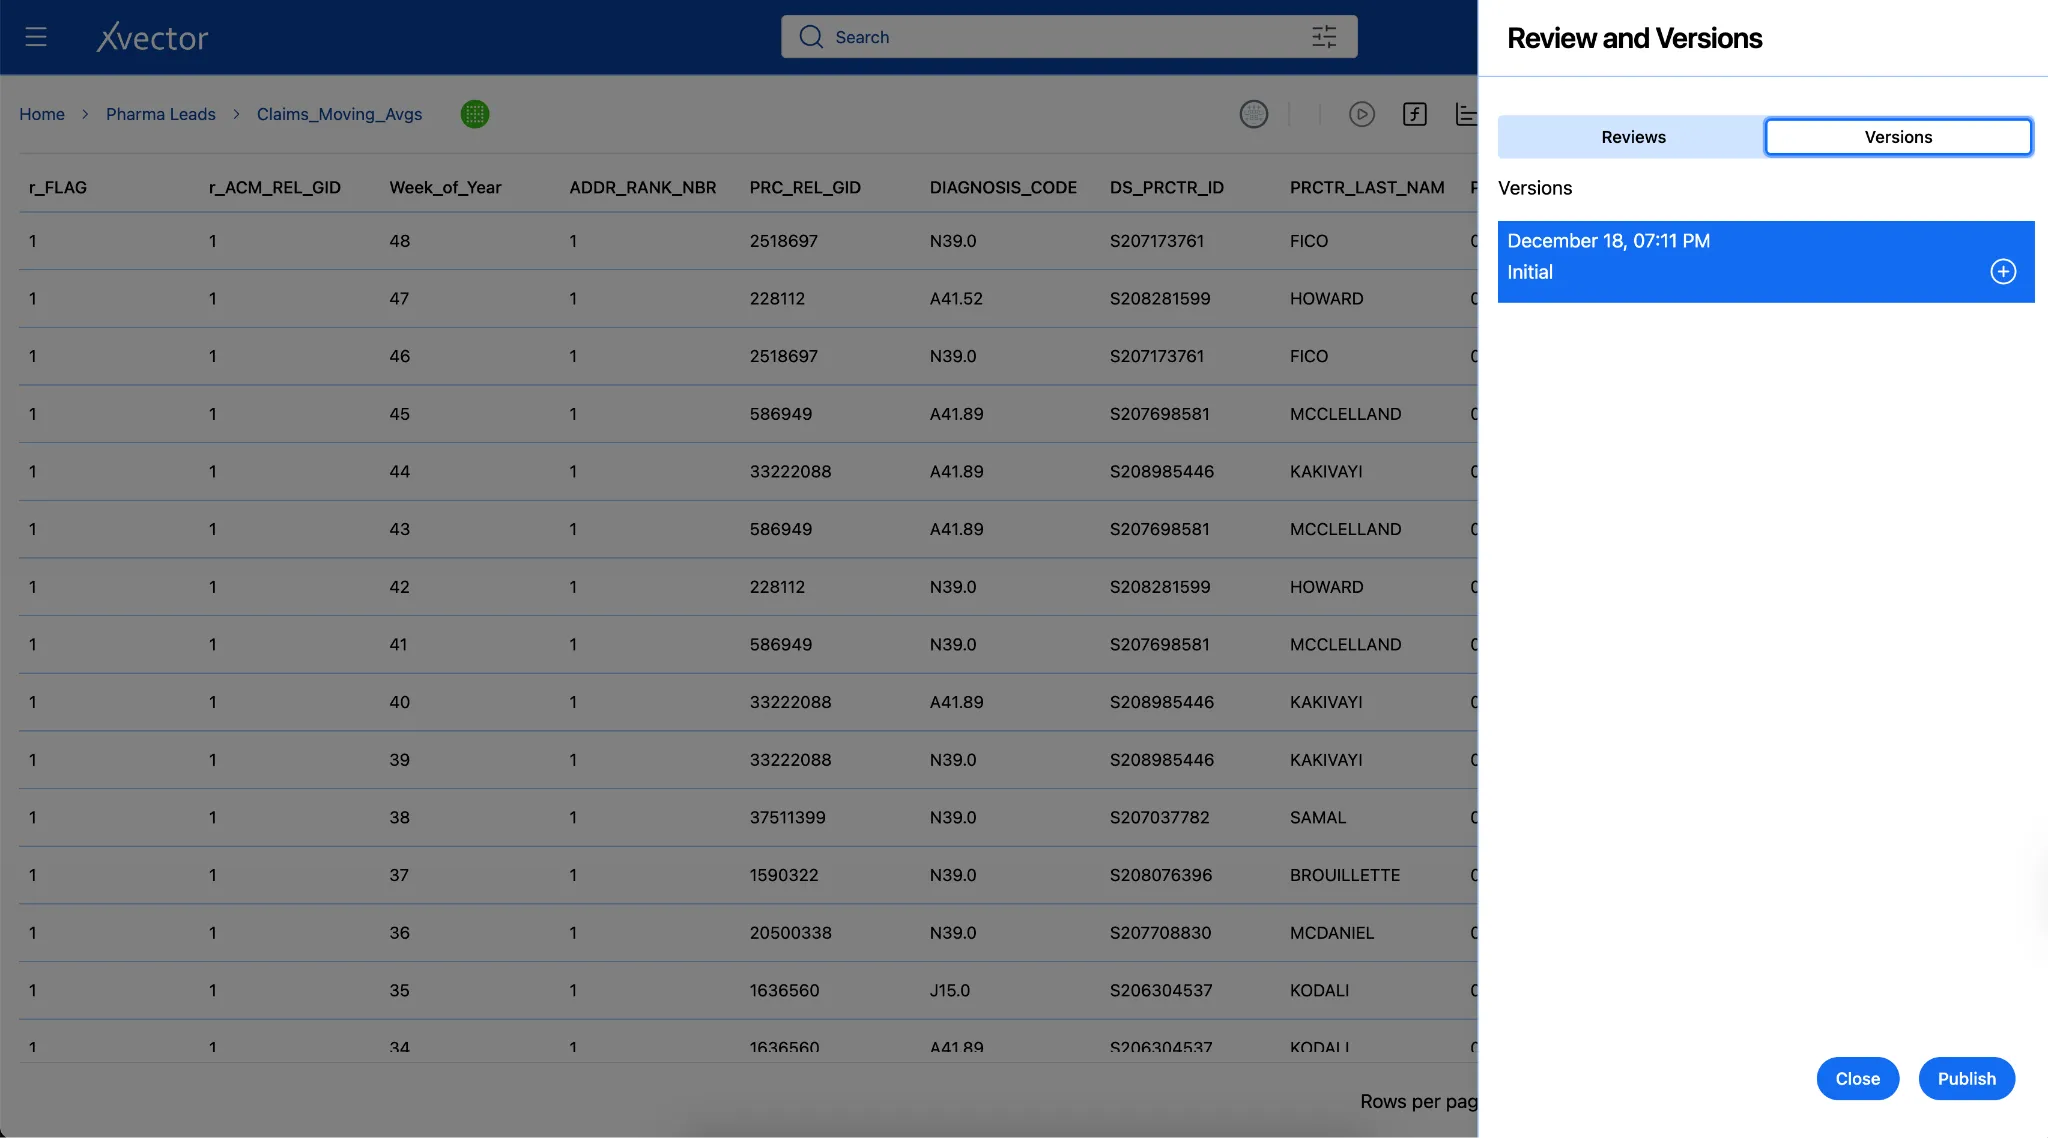
Versioning
Section titled “Versioning”Data applications require rigorous lifecycle management. In xVector, resources operate in draft mode by default during development. Once ready for production, resources are published, and assigned versions are guaranteed, ensuring stable interfaces. The workflow progresses through:
Draft (active development) → Review (validation) → Approved (ready) → Published (production-ready with version assigned)
Layer 3: Use Case Layer
Section titled “Layer 3: Use Case Layer”Extracting actionable insights and delivering value through analytics applications.
The Business Use Case Layer is where data is structured and pre-computed to serve specific analytical and operational outcomes. It consumes curated datasets from the Reference Data Layer and combines them into purpose-built, denormalized models, whether flattened for ad hoc exploration, partitioned for high-performance read access, or aggregated to support defined KPIs. These models power downstream analytics applications, dashboards, and AI-driven workflows.
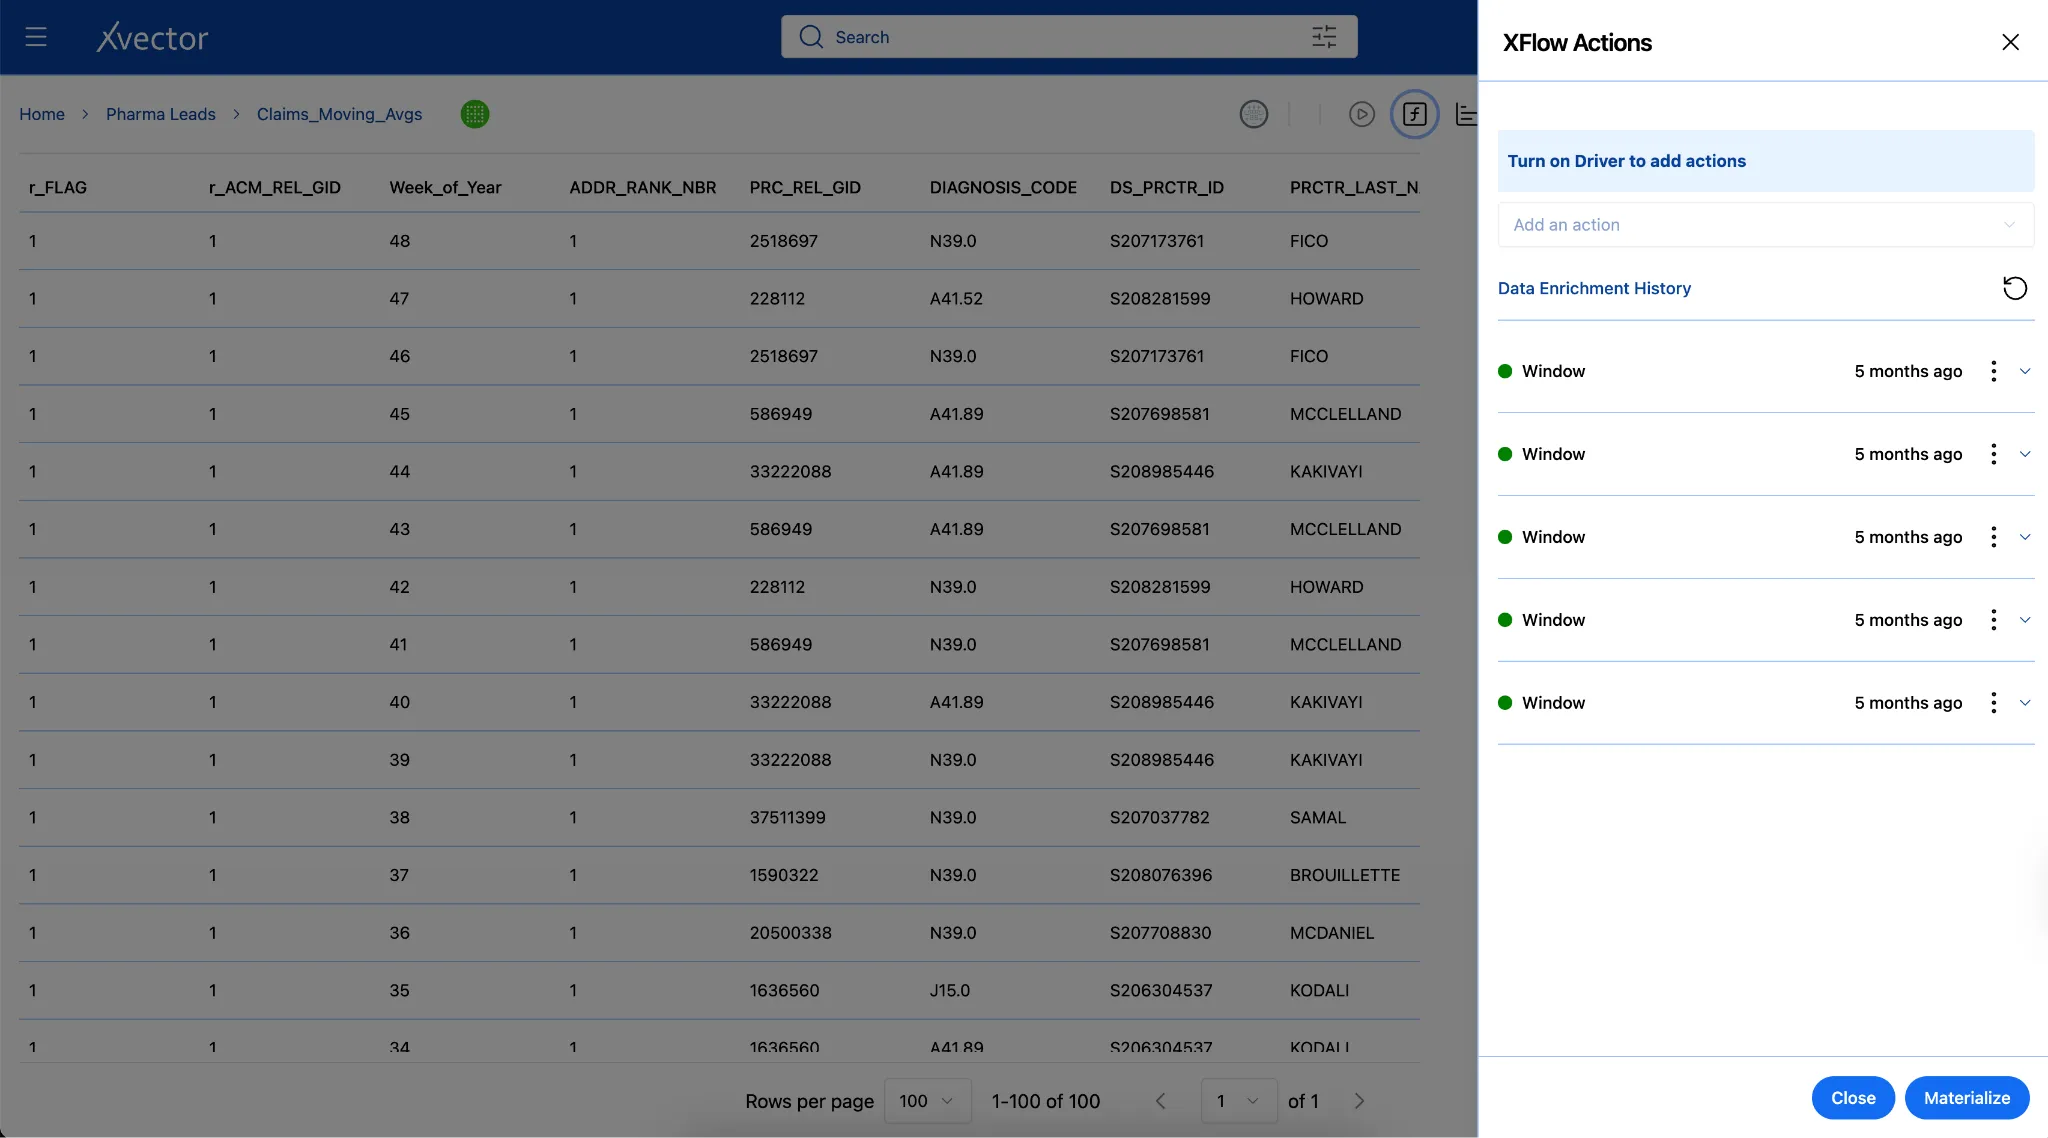
Pre-Computed Datasets
Section titled “Pre-Computed Datasets”In the Pharma Leads App, the Business Use Case Layer pre-computes short-term moving averages (1-week, 2-week, and 3-week) and a long-term 26-week moving average of claim volumes, along with the 26-week standard deviation. When a short-term average deviates by more than one standard deviation from the long-term average, the platform triggers an alert to Sales representatives — a standard statistical method for surfacing unusual patterns that may require attention.
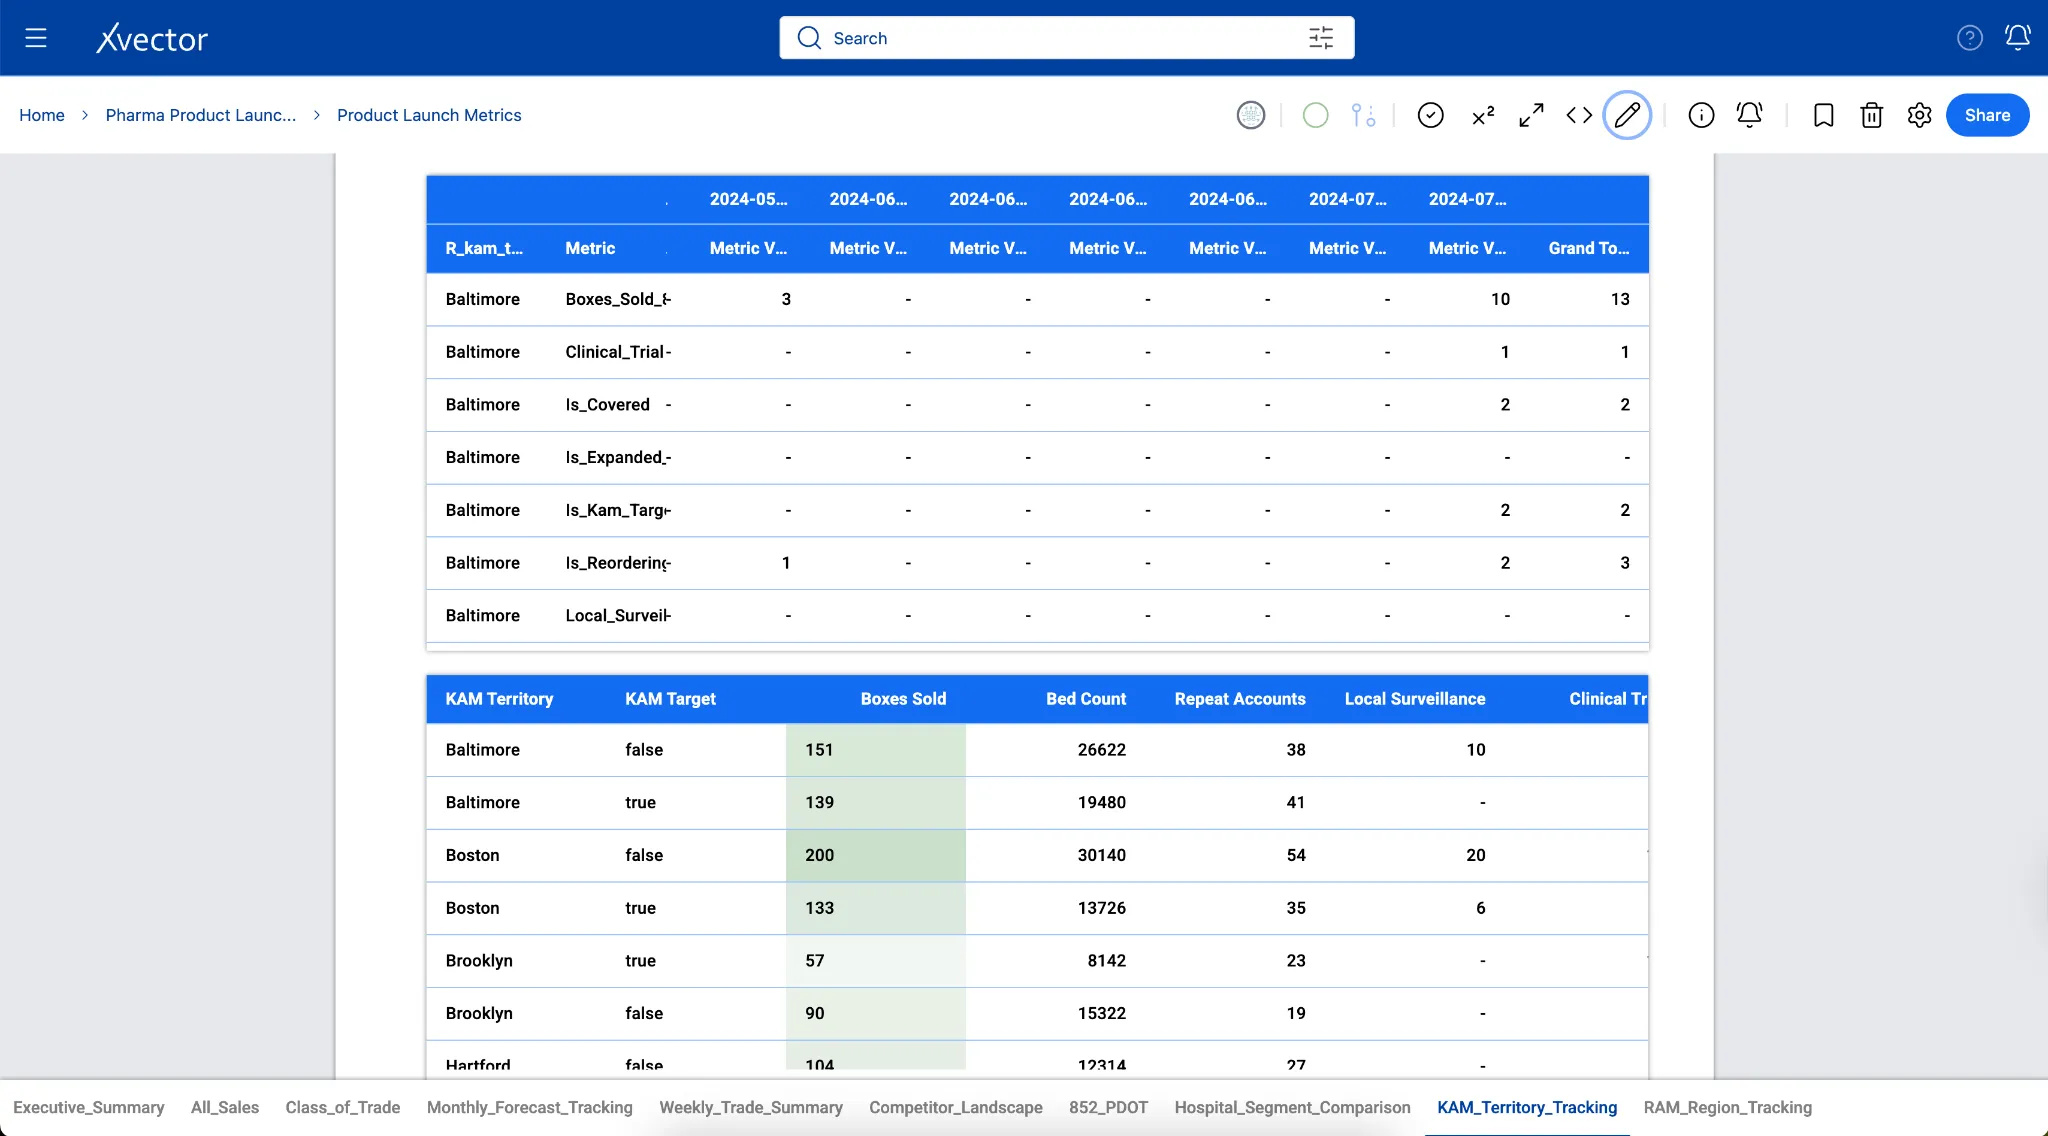
In the case of the Pharma Product Launch Metrics App, boxes delivered data from 867 tables in the reference layer, aggregated by Week-ending, Class of Trade, and Region, to understand the distribution of various categories that Regional Account Managers can slice and dice to manage their accounts.

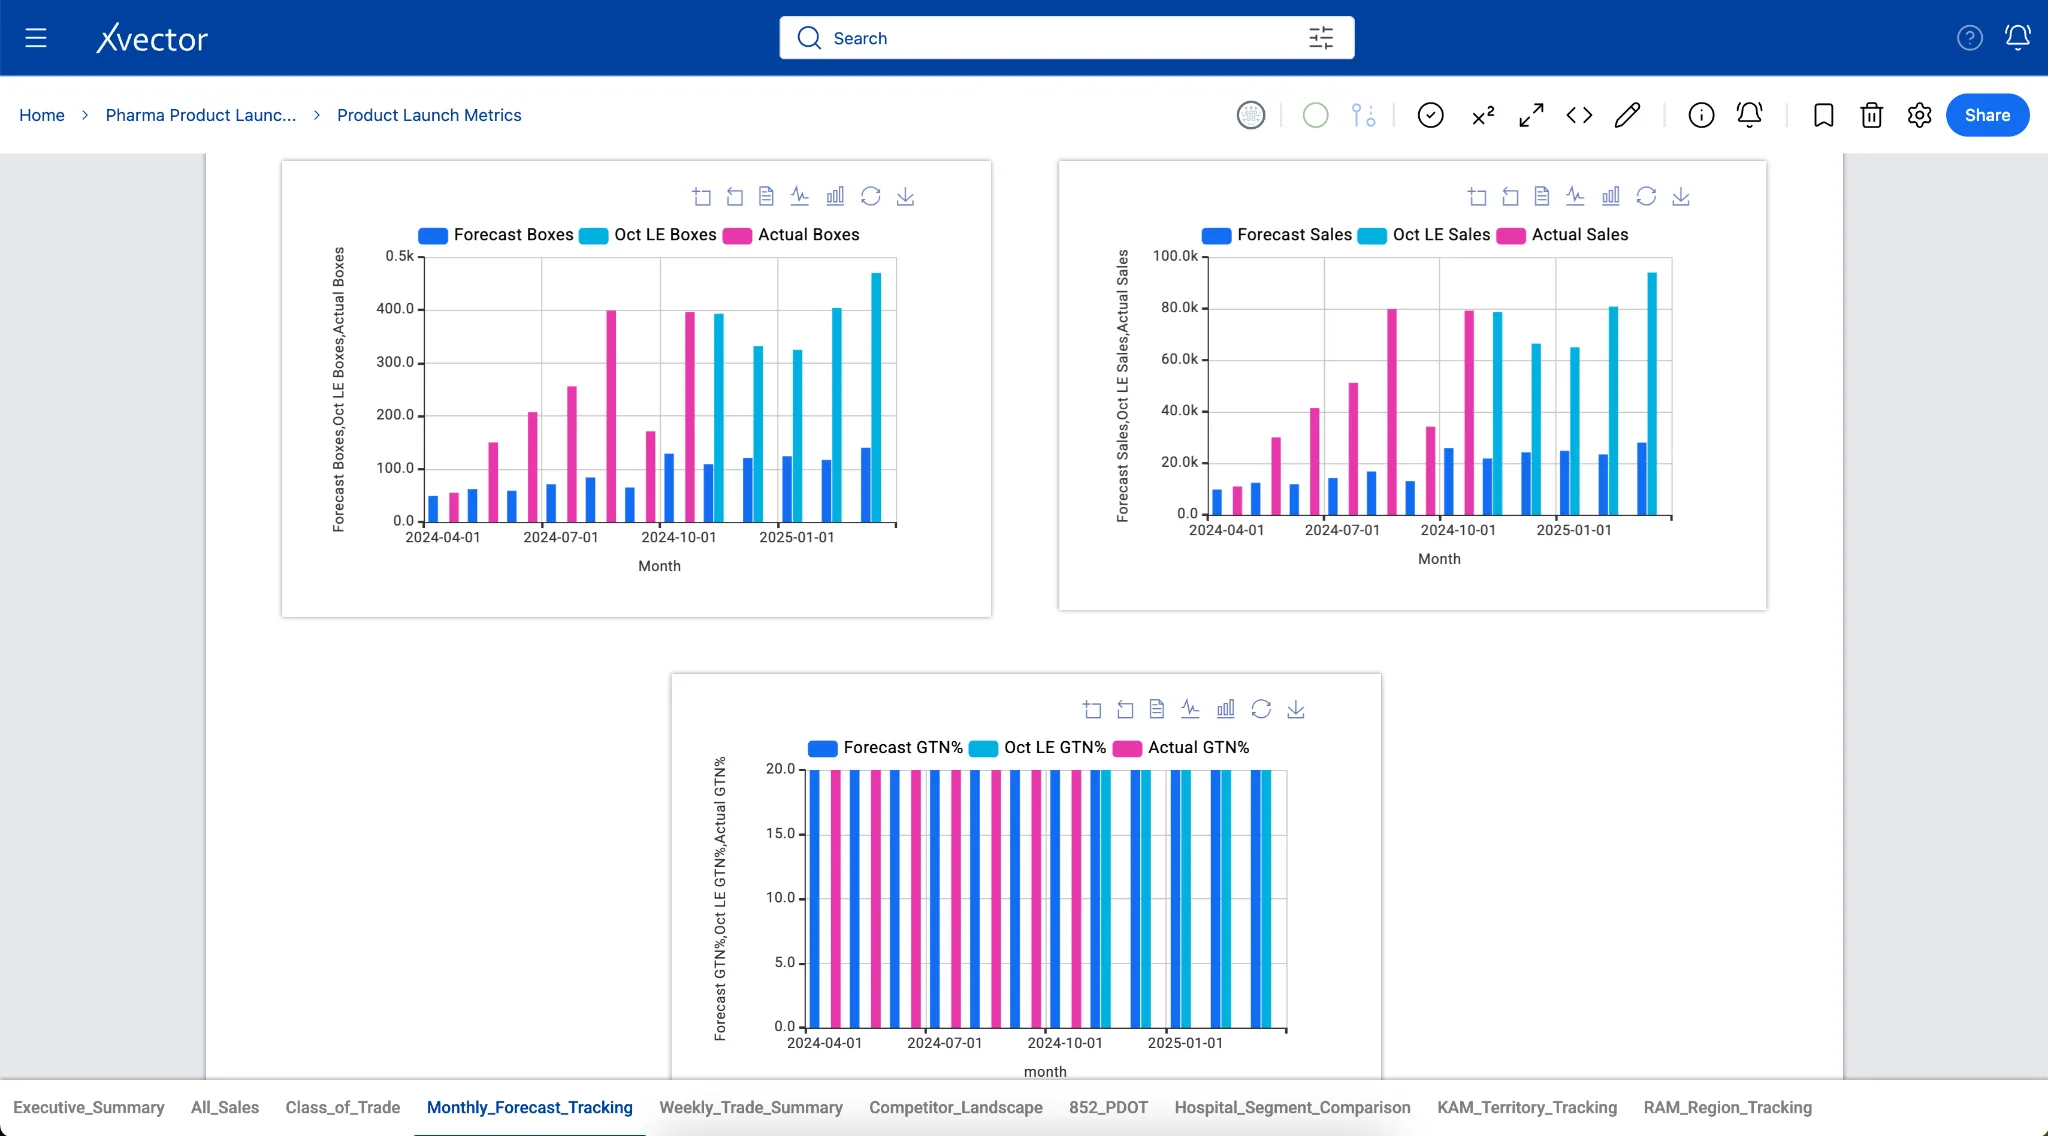
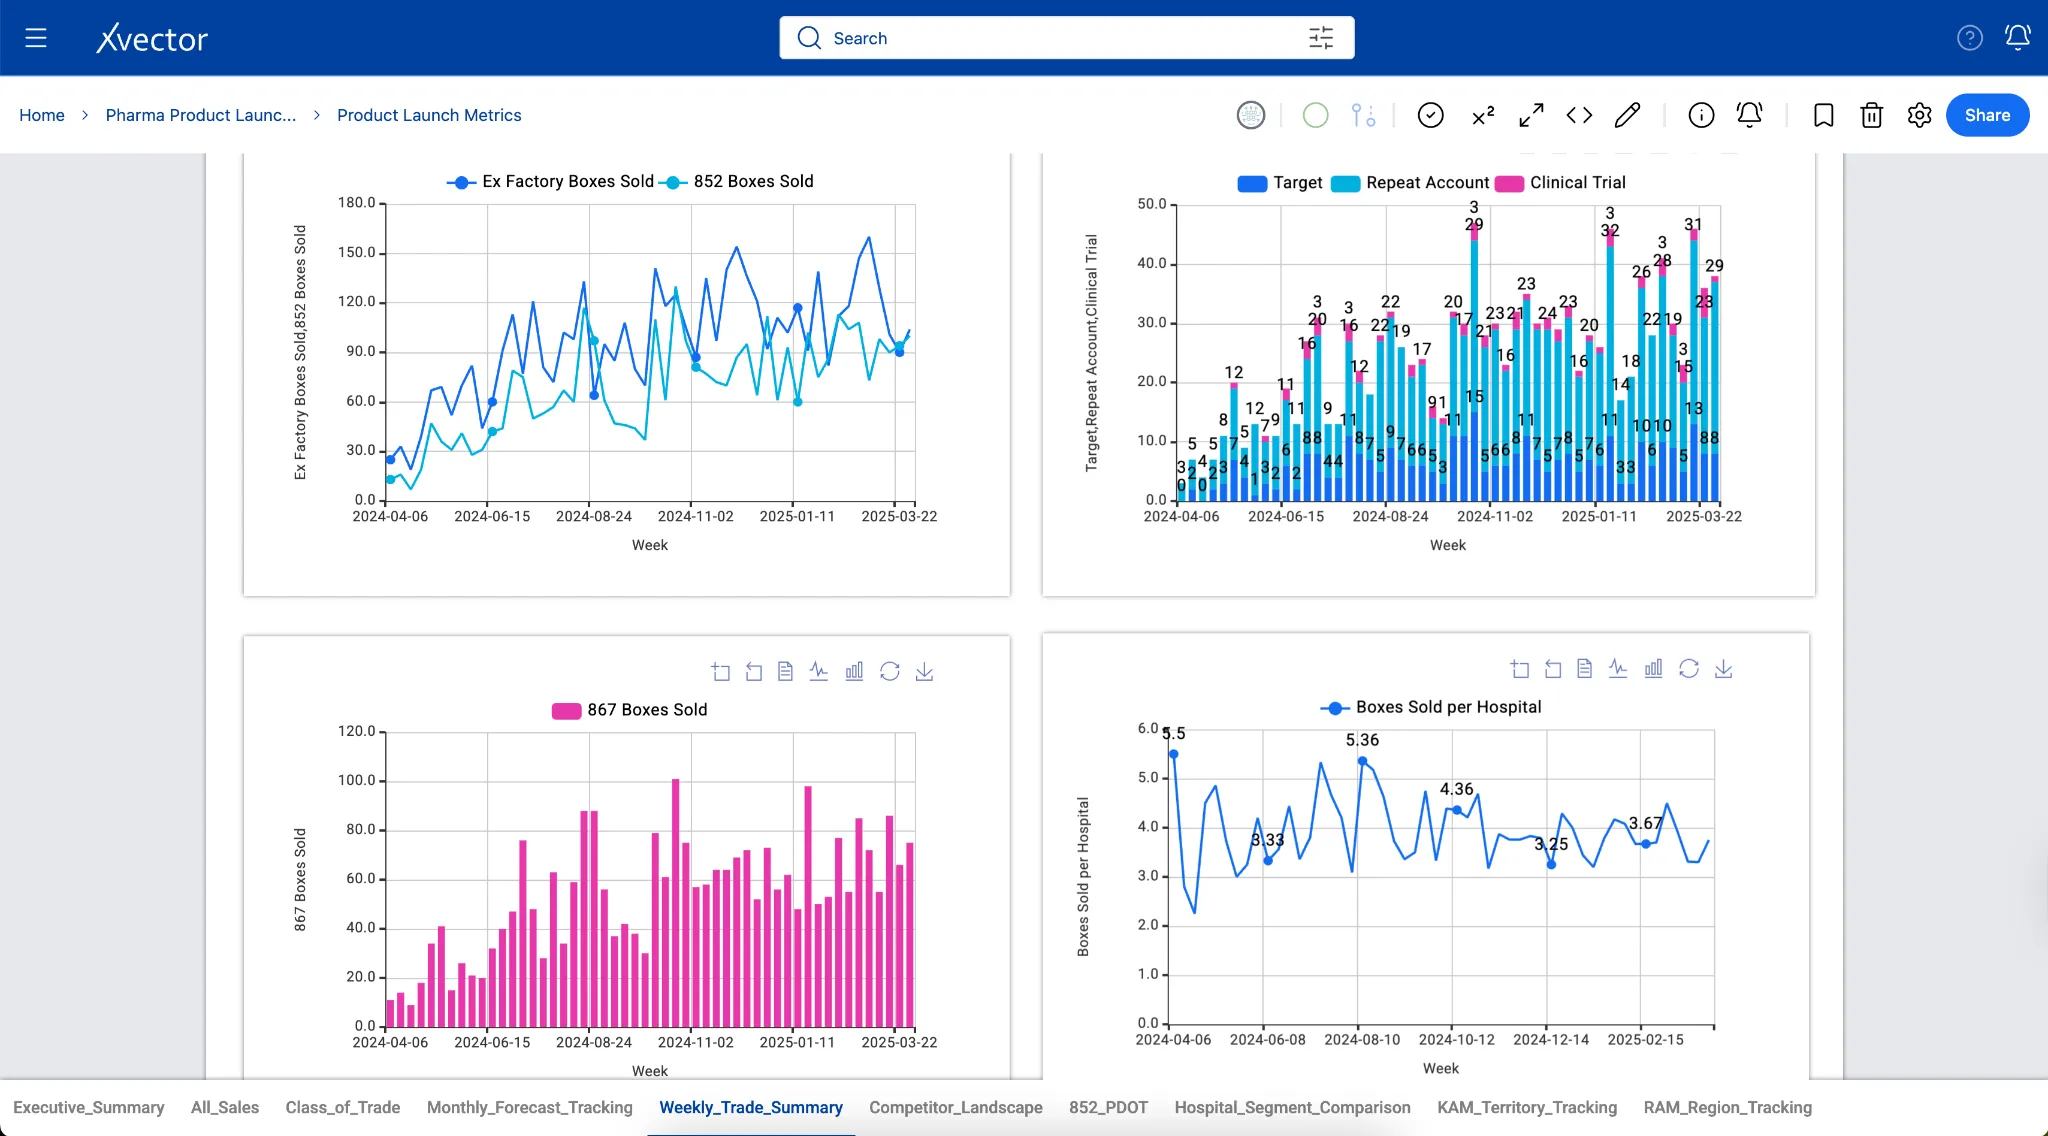
Visualizations and Reporting
Section titled “Visualizations and Reporting”The xVector Platform provides a rich set of visualization options for analyzing data and operationalizing insights. Reports support interactive charts, tables, filters, and drill-down capabilities. Detailed documentation on available visualization types is available in the platform’s online documentation.
Reports connect to live data through drivers. Security around report access is controlled by the report owner, who can grant viewer, commenter, or editor permissions to individual users or user groups.
A few examples of the visualization components are shown below:
The xVector Platform supports collaboration by allowing multiple users to work within the same workspace. Active collaborators are indicated by user icons at the top of the workspace, making it easy to see who is currently working and coordinate efforts to avoid conflicts.
Collaboration can be real-time or asynchronous. Multiple users can work in a workspace simultaneously, or one person can build and publish work that another team member later reviews and updates. Asynchronous workflows depend on the workspace owner granting the appropriate permissions, ensuring that only authorized users can make edits.
Access levels determine what each user can do within a workspace. Depending on their assigned role, users can edit resources, view them in read-only mode, or contribute comments. Multiple users with appropriate roles can also create and manage report components within the same workspace, enabling parallel development across teams.
Workspace commenting consolidates all feedback and discussions into a single pane, providing a clear and organized view of comments for each Data App. This keeps conversations contextual, reduces the need for external communication channels, and makes teamwork more efficient.
The three layers described above establish what data is collected, how it is organized, and how it is delivered. But across all three, every decision about how data is stored, moved, and queried has a direct cost in time and computation. Performance is not a concern isolated to any single layer. Partitioning, compaction, compression, and query optimization apply whether data is being ingested into the Digital Twin Layer, enriched and standardized in the Reference Data Layer, or pre-computed and served from the Business Use Case Layer. The following section covers the platform-level mechanisms that span all three layers to ensure data infrastructure remains fast and cost-efficient at scale.
Performance
Section titled “Performance”Query Patterns and Storage Optimization
Section titled “Query Patterns and Storage Optimization”How data is stored directly impacts query performance. Analytical queries that aggregate over large datasets benefit from columnar storage formats such as Parquet, whereas transactional workloads may require row-based formats such as Avro or JSON.
Modern data platforms extend columnar databases to support vectorized data such as embeddings for similarity search, recommendation systems, and AI-powered analytics. By integrating vector indexing (FAISS, HNSW, or ANN) within columnar storage, platforms can handle high-dimensional data alongside structured attributes, enabling hybrid queries that combine SQL filters with semantic search.
The xVector Platform defaults to Parquet for analytical workloads, leveraging columnar storage for fast aggregation queries, compression efficiency for reduced storage costs, and predicate pushdown for intelligent data skipping.
Compaction
Section titled “Compaction”Frequent incremental writes create file fragmentation in data lakes. Under the hood, xVector uses Iceberg’s copy-on-write (COW) strategy, which creates new files for each update rather than modifying existing files. Over time, this generates many file versions. Iceberg’s compaction process addresses this by consolidating small files into larger, optimally-sized files (typically 128MB–512MB), running asynchronously while maintaining full ACID guarantees.
Compression and Encoding
Section titled “Compression and Encoding”Compression reduces the physical size of data stored on disk or in object storage, directly lowering storage costs and improving query performance.
xVector uses Snappy compression, which effectively balances compression ratio and CPU overhead. Snappy achieves moderate compression ratios (typically 2–3:1) while maintaining high decompression speeds, making it ideal for analytical platforms where data is written once but read many times. Iceberg’s columnar storage (Parquet) further benefits from encoding techniques such as dictionary and run-length encodings that exploit data patterns within individual columns.
Partitioning
Section titled “Partitioning”Efficient storage layout and partitioning are critical for optimizing data access, ensuring fast query performance, and minimizing infrastructure costs. It determines how data is physically organized on disk or in object storage. When data is partitioned effectively, typically by time, geography, or key business dimensions, query engines can skip irrelevant data (partition pruning), dramatically reducing the amount of data scanned. This translates into faster queries and lower compute costs, which are particularly important as data volumes grow.
xVector provides an easy mechanism to partition data when creating datasources or datasets. The user can set the Partition Path in the “Table Options” tab as shown below. In the current example of the Pharma Leads App, partitioning the data by month is the most efficient approach.
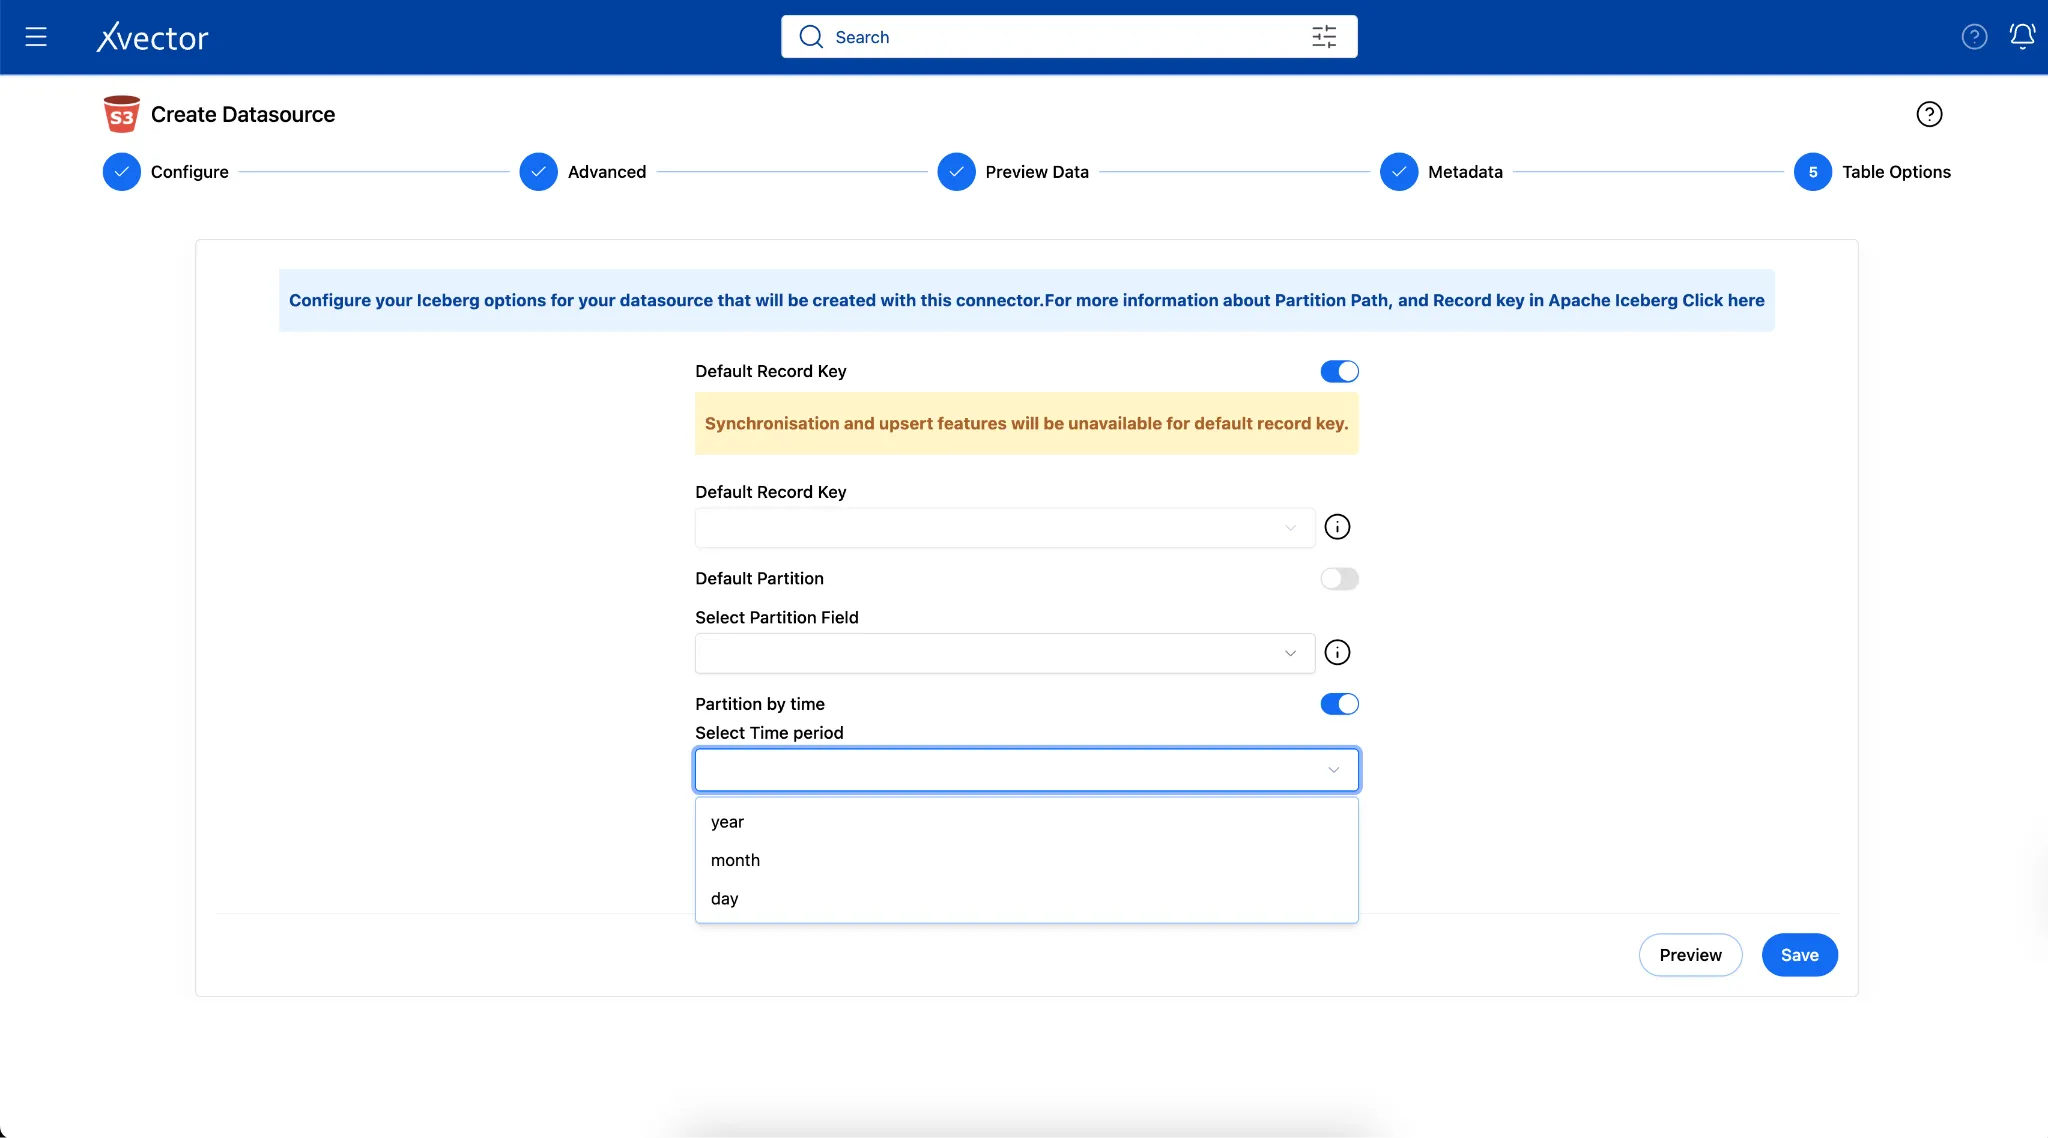
Under the hood, xVector uses Apache Iceberg, which handles storage layout and partitioning through a sophisticated metadata-driven approach that separates logical partitioning from physical file organization. More on Apache Iceberg’s partition can be found here.
Partitioning addresses the physical organization of data. But there’s another dimension: the logical structure. Data engineering isn’t just about storage; it’s about keeping the pipeline reliable and maintainable as data moves and changes. Let’s look at reliability first.
Reliability and Maintenance
Section titled “Reliability and Maintenance”Backfills
Section titled “Backfills”Backfills populate historical data into pipelines and datasets, ensuring that newly built pipelines, corrected records, or recovered data are represented as if they had arrived on schedule. They differ from ongoing synchronization, which processes incremental updates as they arrive, in that they target specific gaps or time ranges in existing data. This feature will be coming soon in xVector.
Backfills require more care than regular loads. Historical datasets can be large enough to require staged, incremental execution to avoid overwhelming the pipeline. Pipelines must track which records have already been processed to prevent duplicates during reruns. And jobs need checkpointing so that a partial failure can be resumed from where it stopped rather than restarted from the beginning.
Common reasons for running a backfill:
- Transformation logic was corrected. A revenue calculation had an error for six months. Once fixed, the last six months are backfilled so all historical records reflect the corrected logic.
- A new column or metric was added. A “customer segment” field is added to a fact table. Since it did not exist before, it is backfilled across all historical rows by reprocessing source data with the new logic applied.
- A data source was late or missing. A vendor feed failed for two weeks. When it is restored, those two weeks are backfilled so the gap in the table is filled as if the data had arrived on time.
- A schema or business rule changed. A payer resubmits corrected claims data for a prior period. The affected date range is backfilled to replace the originally loaded records with the corrected ones.
- A new pipeline is being built from scratch. A new data source is being onboarded and requires two years of history before go-live to give downstream reports a complete baseline.
Backfills are often where SCD Type 2 design and time travel become critical, because the pipeline must know what the data looked like at each point in time and reprocess without overwriting valid current records.
Job Failure
Section titled “Job Failure”Pipeline jobs fail for reasons ranging from transient infrastructure issues and network timeouts to upstream schema changes and malformed source data. A robust data platform must handle these failures gracefully without requiring manual intervention for every incident.
xVector will shortly be providing a built-in retry mechanism that automatically re-attempts failed jobs based on configurable retry policies. For now, when a job fails, xVector provides a manual retry mechanism that allows the user to re-run the job.
Schema Evolution
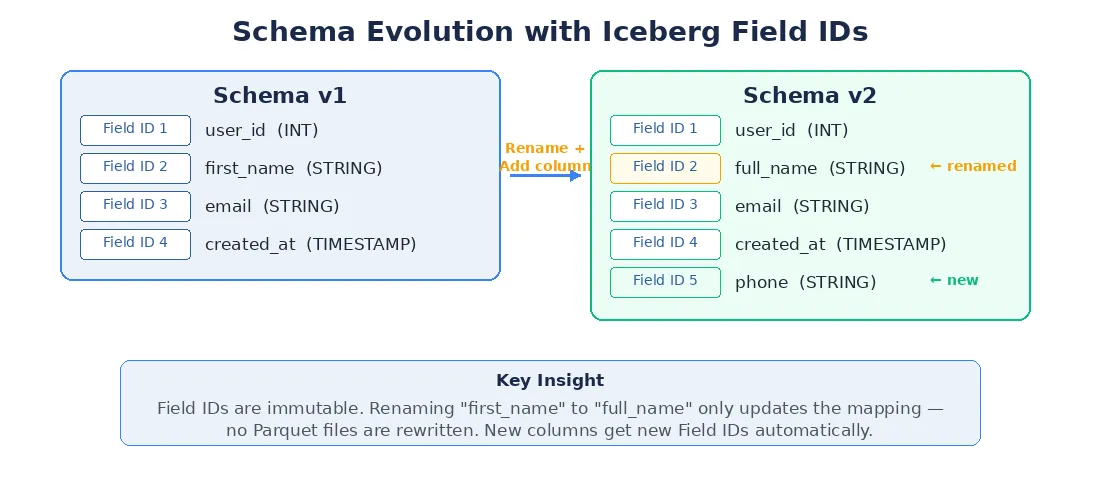
Section titled “Schema Evolution”Schema evolution is the practice of adapting data pipelines to handle structural changes in source systems without breaking existing functionality. Effective schema evolution requires forward compatibility (handling new fields), backward compatibility (supporting older schema versions), schema versioning (tracking changes over time), and impact analysis (mapping how changes propagate downstream).
Under the hood, xVector follows Iceberg’s evolution model, using field IDs — immutable identifiers assigned to each column. When a column is renamed, only the name-to-ID mapping is updated; no Parquet files are rewritten.
Figure 5: Schema Evolution with Iceberg Field IDs
Schema Conflict Resolution
Section titled “Schema Conflict Resolution”When a breaking schema change is detected, the ingestion job in xVector is suspended and enters a SCHEMA_CONFLICT state. The platform alerts the data owner via email, and the job waits for a human decision: FORCE_EVOLVE (accept and continue) or REJECT (cancel). This ensures that breaking changes are never applied without explicit approval, while non-breaking changes flow through automatically.
xVector provides users with alerts whenever the schema undergoes structural changes. Users must then decide whether to transform the incoming data, modify the target schema, or update their DataApp logic. This explicit error handling ensures teams understand and approve schema changes rather than having them propagate silently through the system.
Log Rotation
Section titled “Log Rotation”Log rotation is the practice of managing log files so they don’t grow indefinitely and consume all available disk space.
When a system runs continuously, it writes operational events to log files: errors, job completions, access records, schema changes, and so on. Without any management, these files grow forever. Log rotation addresses this by periodically “rolling over” the active log file, archiving the current one, starting a fresh one, and then either compressing or deleting old archived logs after a defined retention period. At xVector, logs will be collected and pushed to S3, where log rotation is applied.
Governance
Section titled “Governance”Ensuring trust, compliance, and control across all data layers.
Data governance spans all three layers of the architecture. It ensures that data is trustworthy, well-documented, secure, and compliant with organizational policies and regulatory requirements.
The xVector Platform’s governance capabilities include:
- Data Lineage: Track data from source to consumption, understanding how datasets are derived, transformed, and used across the platform.
- Access Control: Define fine-grained permissions at the dataset, row, and column level based on user roles and group memberships.
- Audit Trails: Maintain logs of who accessed, modified, or exported data and when, providing a complete chain of custody for regulatory and internal review.
- Data Cataloging: Organize datasets with metadata, descriptions, tags, and ownership information to make data discoverable.
- Policy Enforcement: Apply retention policies, masking rules, and compliance checks programmatically across datasets.
GDPR Compliance and Data Privacy
Section titled “GDPR Compliance and Data Privacy”User activity data contains sensitive personal information (PII) that requires strict compliance with regulations such as GDPR and CCPA. Governance is the appropriate layer for these controls because compliance is a cross-layer concern: data must be governed from the moment it is ingested in the Digital Twin Layer through its transformation in the Reference Data Layer and its consumption in the Business Use Case Layer.
GDPR mandates organizations to follow seven key principles when handling personal data. The xVector Platform is designed to support compliance with each of these principles through its governance capabilities:
- Lawfulness, Fairness, Transparency: Data must be processed legally, fairly, and transparently. xVector’s audit trails and data catalog provide the documentation needed to demonstrate lawful processing bases.
- Purpose Limitation: Data should be collected only for specific, legitimate purposes. Use case specifications (App.md) formalize the stated purpose of each data application, creating a machine-readable record of intent.
- Data Minimization: Collect only the minimum data necessary for processing. Column-level access controls and field-level masking allow administrators to restrict data to only what each use case requires.
- Accuracy: Ensure personal data is accurate and up to date. The platform’s synchronization policies and data quality validations enforce freshness and completeness.
- Storage Limitation: Retain data only as long as necessary. Governance retention policies define the maximum retention period for datasets containing personal data, after which Iceberg’s row-level delete capabilities are used for secure removal.
- Integrity and Confidentiality: Use encryption, anonymization, and access controls to protect data. xVector supports HASH, TOKENIZE, PSEUDONYMIZE, NULLIFY, TRUNCATE, and REDACT masking strategies, and enforces row- and column-level access controls.
- Accountability: Document compliance efforts and demonstrate adherence. The platform’s audit trails and governance dashboard provide a centralized record of access events, schema changes, and masking decisions.
Key compliance capabilities the xVector Platform supports include anonymization and tokenization (masking PII fields before storing logs), Right to Be Forgotten pipelines using Iceberg’s row-level delete, snapshot branching and tagging for GDPR audit requirements, and deployment within the customer’s cloud or on-premises environment to ensure data stays within the customer’s compliance boundary.
Authorization, PII Classification, and Data Security
Section titled “Authorization, PII Classification, and Data Security”Data security requires that only authorized users can view sensitive information. xVector provides authorization to enforce data security and access restrictions, ensuring only authorized users can view sensitive data. Beyond static masking rules, the platform includes an automated PII/PHI classification pipeline that runs before every ingestion job.
The platform provides fine-grained row- and column-level authorization, enabling administrators to mask data in specific rows and columns based on user permissions and group memberships. For example, in a user analytics dataset, fields such as user_id and email addresses can be masked so that only authorized personnel can view them. This is configured through rules defined directly on the dataset within the platform.
Masking Strategies and Layered Access *
Section titled “Masking Strategies and Layered Access *”The platform supports six masking strategies: HASH (SHA256, irreversible), TOKENIZE (UUID vault, reversible), PSEUDONYMIZE (format-preserving encryption), NULLIFY (replace with NULL), TRUNCATE (partial de-identification), and REDACT (***REDACTED*** at display layer). Different user roles see different views: raw tables for engineers, masked tables for analysts, redacted views for BI consumers, and a token vault for authorized data owners.
Observability
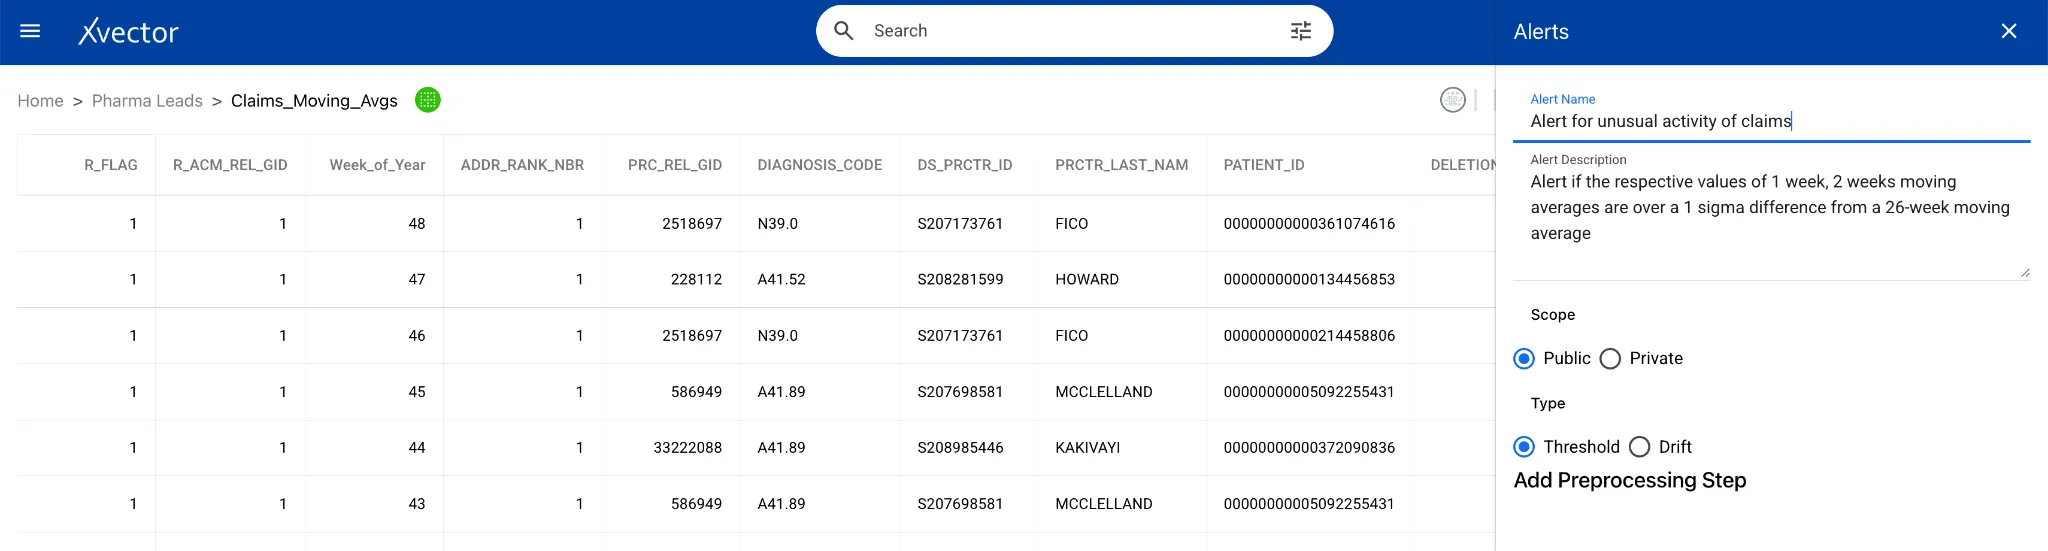
Section titled “Observability”As the complexity increases due to the scale and variety of operations, manually reviewing the application for exceptions is unwieldy and potentially error-prone. Observability makes it manageable; the system detects anomalies based on rules and machine learning. Users can define alerts based on data updates, threshold rules, or anomalies.
Users can monitor datasets, models, and reports by authoring alert rules. Alert rules are of the following types:
- Threshold-based: The user/user group is notified based on a threshold that is set in the system. For example, if the revenue exceeds a value, it notifies the user/user group.
- Update-based: When the underlying resource, such as a dataset, is updated, the user/user group subscribing to the alert rule is notified.
- Anomaly-based: Machine learning algorithms detect anomalies and notify the subscribers.
In the Pharma Leads App, as shown below, alerts are configured for the sales team based on a threshold: any region with unusual claim activity triggers an alert.
Governance establishes the standards for data quality, access, and compliance. Observability continuously measures pipeline and system health against those standards, surfacing deviations before they affect downstream consumers.
Details on Observability can be found here.
Conclusion
Section titled “Conclusion”Data engineering is a complex discipline that requires balancing multiple concerns: performance, reliability, compliance, and usability. The xVector Platform is designed to simplify this challenge by providing an integrated environment where data engineers can ingest, transform, govern, and deliver data through a consistent set of tools and patterns.
By following the three-layered architecture described in this handbook — building a faithful Digital Twin of source systems, organizing data into governed Reference domains, and delivering optimized datasets for Business Use Cases — teams can create a data infrastructure that is scalable, reliable, and ready to power the next generation of analytics and AI applications.
Examples of processing multi-modal data, Ontology/KG powering Context Engineering, and an Agent Handbook discussing operationalizing Intelligence will be coming soon.
Appendix
Section titled “Appendix”Open Table Formats
Section titled “Open Table Formats”Open table formats are open, vendor-neutral specifications that define how large structured datasets are stored, organized, and managed in data lakes and lakehouses. Unlike traditional database storage, data resides in object storage (such as Amazon S3, Azure Blob Storage, or HDFS), while the table format provides a metadata layer that enables database-like functionality.
These formats decouple storage from compute, allowing multiple processing engines to read and write the same data consistently without being tightly coupled to a specific vendor or platform.
xVector uses Apache Iceberg as its primary table format. Iceberg is designed to handle massive datasets efficiently through a metadata-driven architecture. It supports features such as schema evolution, time travel, ACID transactions, and hidden partitioning, while avoiding performance issues associated with traditional file-based tables. Iceberg integrates seamlessly with engines such as Apache Spark, Apache Flink, Trino, Snowflake, and others.
Other open table formats, such as Apache Hudi and Delta Lake, address similar challenges with different design trade-offs. For example, Hudi is optimized for incremental upserts and streaming ingestion, while Delta Lake emphasizes tight integration with Spark and strong transactional guarantees.
Why Open Table Formats Matter
Section titled “Why Open Table Formats Matter”Without an open table format, data lakes are simply collections of raw files with limited coordination. Open table formats introduce a metadata layer that brings database-like reliability and performance to object storage, enabling:
- ACID transactions for consistent reads and writes
- Centralized schema management and evolution
- Time travel and versioning for auditability and rollback
- Efficient metadata handling for large-scale datasets
- Interoperability across engines, avoiding vendor lock-in
As a result, open table formats are a foundational component of modern lakehouse architectures, allowing organizations to combine the scalability of data lakes with the reliability and performance of data warehouses.
References
Section titled “References”- Apache Iceberg Documentation
- Accelerating Lakehouse Table Performance — The Complete Guide
- The Overview of Parquet File Format
- Data Engineering Toolkit
- Data Modeling for Data Engineering — Introduction
- Embedded Databases — Part 1
- How to Optimize Performance for Your Open Data Lakehouse
- Apache Hudi Stack
- Feature Engineering for Machine Learning, Alice Zheng and Amanda Casari. O’Reilly, 2018.
- Apache Iceberg — ProjectPro
- The Small File Tax: How Compaction Works
© Copyright | xVector Labs Inc 2025. All rights reserved.