Dataset
Data is the foundation of every insightful analysis, yet its raw form often lacks the structure and clarity needed for effective decision-making. Within xVector, raw data enters the system from various data sources like transactional databases, APIs, logs, or third-party integrations. Before it can be leveraged for exploratory analysis, machine learning, or operational reporting, it must be refined and structured into a more usable format.
Refining the Raw: Datasets
Section titled “Refining the Raw: Datasets”As data flows into the system, it becomes a Dataset — a structured, enriched version ready for analysis and modeling. This transformation begins with profiling, where metadata is extracted and each column is classified based on its data type, statistical type (categorical or numerical), and semantic type (e.g., email, URL, or phone number). This metadata provides context, shaping downstream processes like exploratory analysis or machine learning model training.
The enrichment process brings data to life. Users can leverage an extensive toolkit to profile data, detect anomalies, join datasets, apply entity extraction/NLP and other models, and manually edit numerical, text, or image data for precise refinements. This step bridges the gap between raw data and actionable insights.
The Power of Traceability
Section titled “The Power of Traceability”The clear distinction between a Data Source and a Dataset isn’t just about workflow organization — it’s about traceability and trust. By maintaining the data lineage, users can always trace back to the source, ensuring transparency in processing and confidence in decision-making.
Creating a Dataset
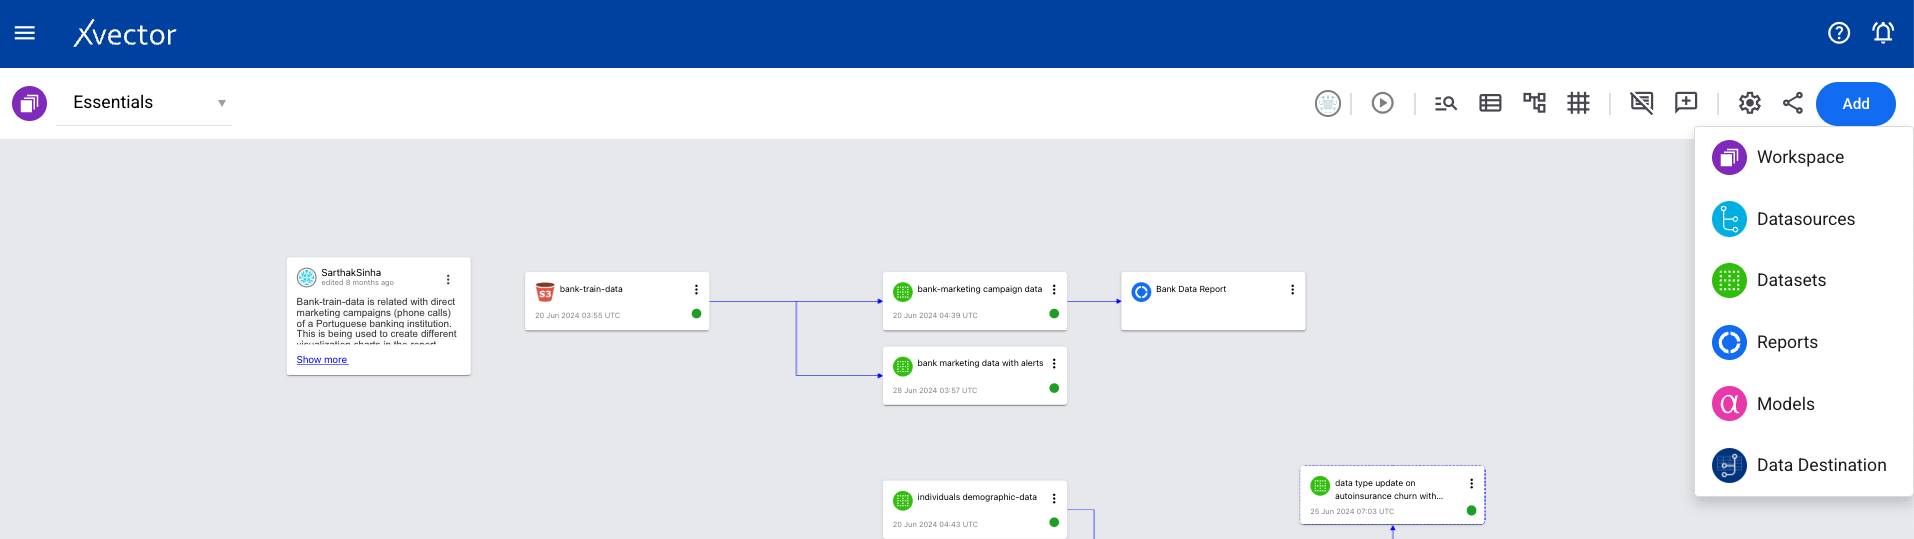
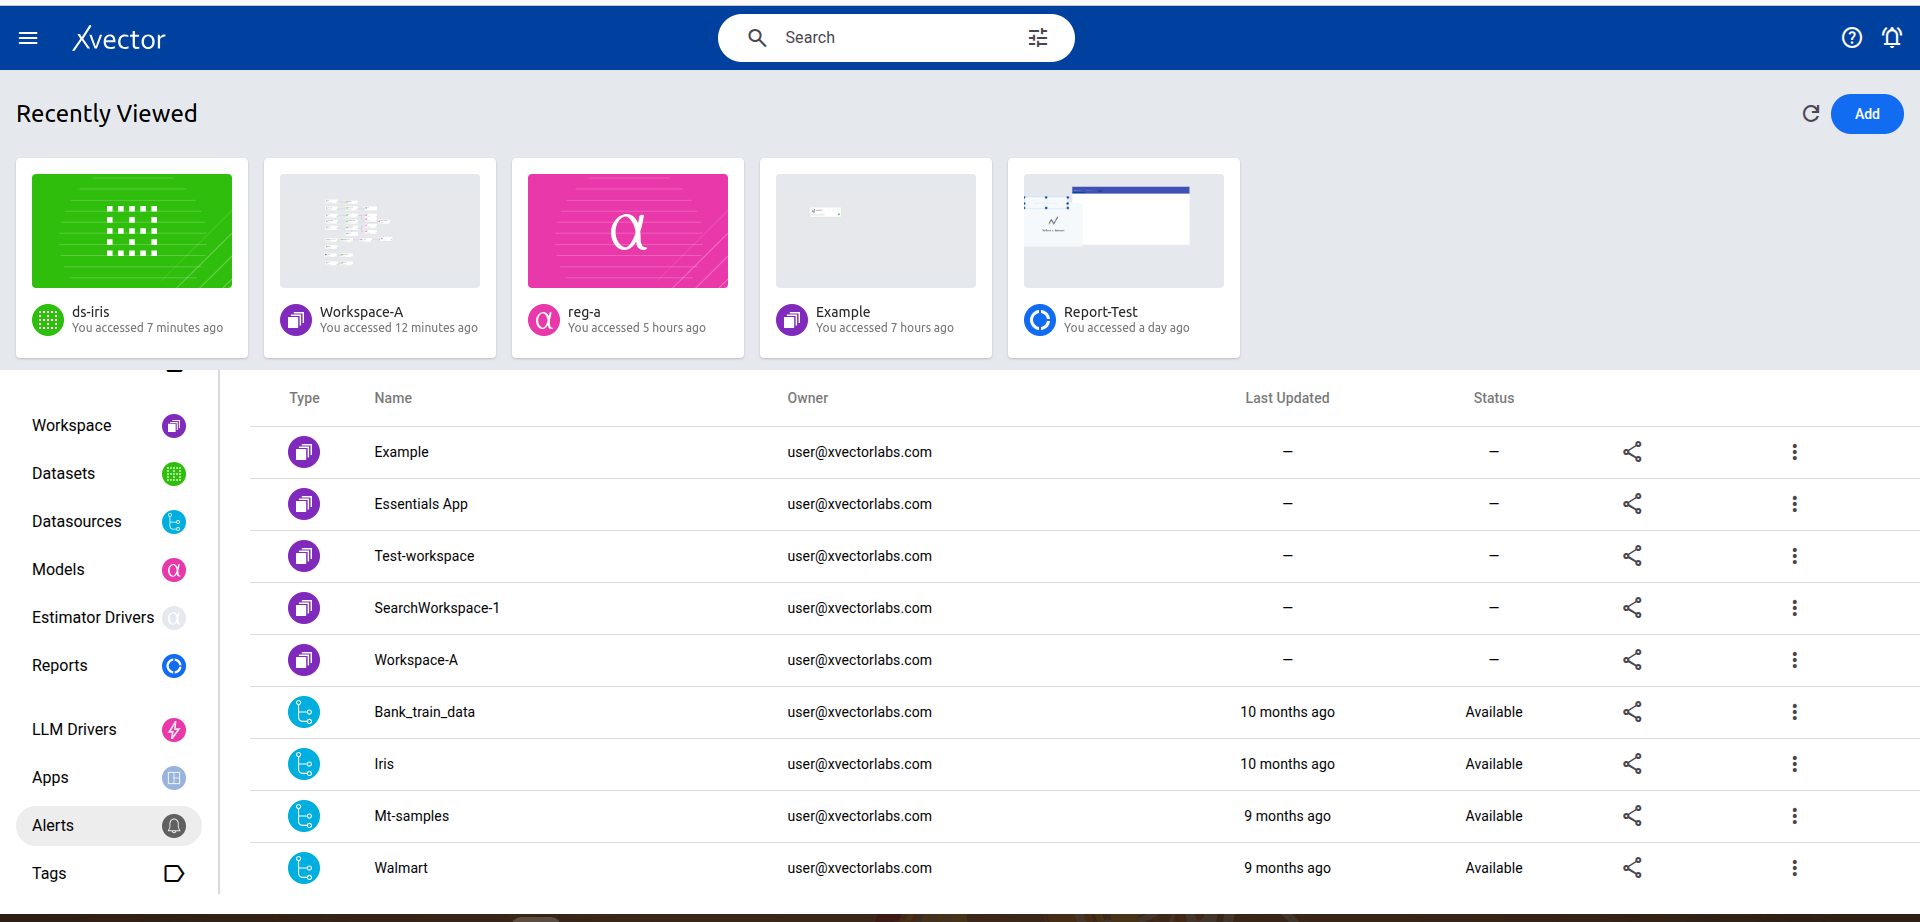
Section titled “Creating a Dataset”- From a workspace, click on Add and choose the Datasets option.
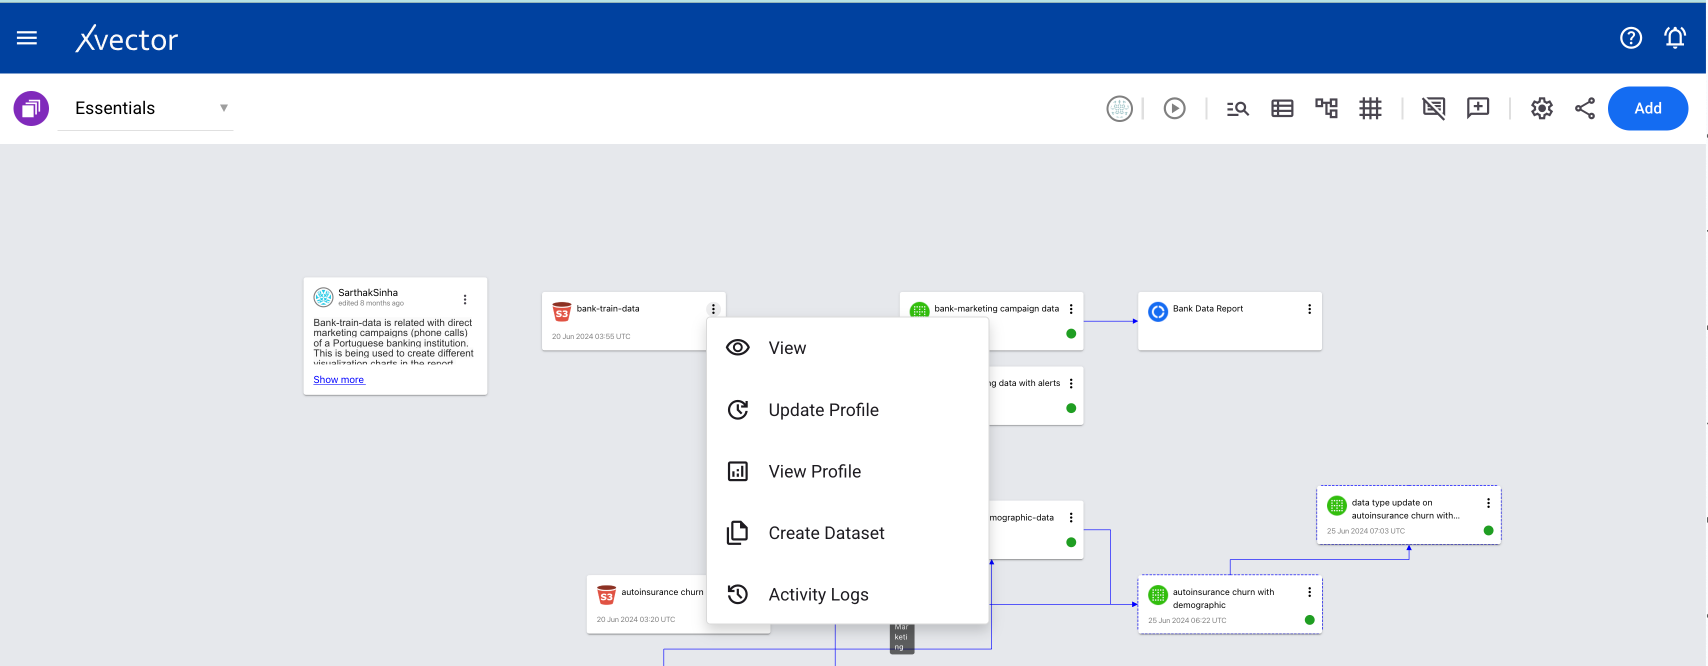
Or choose Create Dataset from the menu options of a Datasource.
- Configure — Select a datasource from the available list and choose the type of dataset:
- Fact (default) — a collection of facts such as orders, shipments, inventories
- Entity — a collection of entities such as suppliers, customers, partners, channels, and other core entities around which the data app creates analytical attributes (e.g., customer segment). Used for filtering and lightweight mastering.
- Entity Hierarchy — captures hierarchical relationships among entities, useful for filtering reports
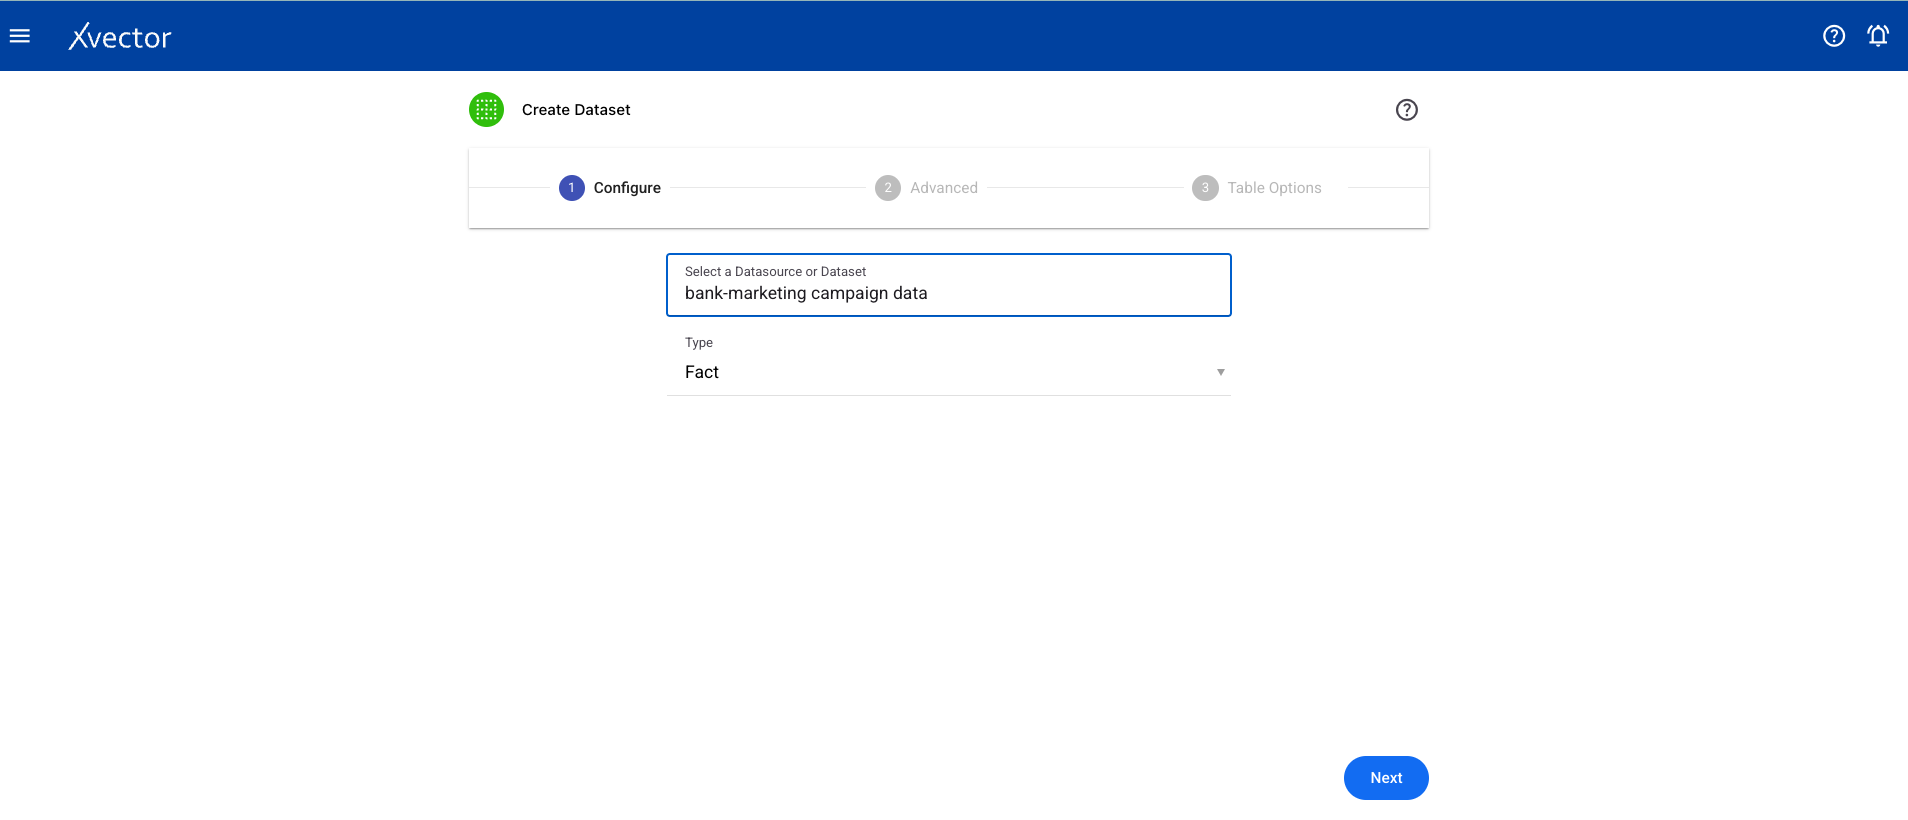
-
Advanced — Set the dataset name, machine specifications, and table options (Record Key, Partition Key).
-
Select Workspace — Choose a workspace for the dataset.
Exploring and Enriching a Dataset
Section titled “Exploring and Enriching a Dataset”Once the dataset is created, there are several ways to explore and enrich it.
Workspace View Options
Section titled “Workspace View Options”From the workspace, click the ellipses on the dataset tile (tile with the green icon) to see the available options:
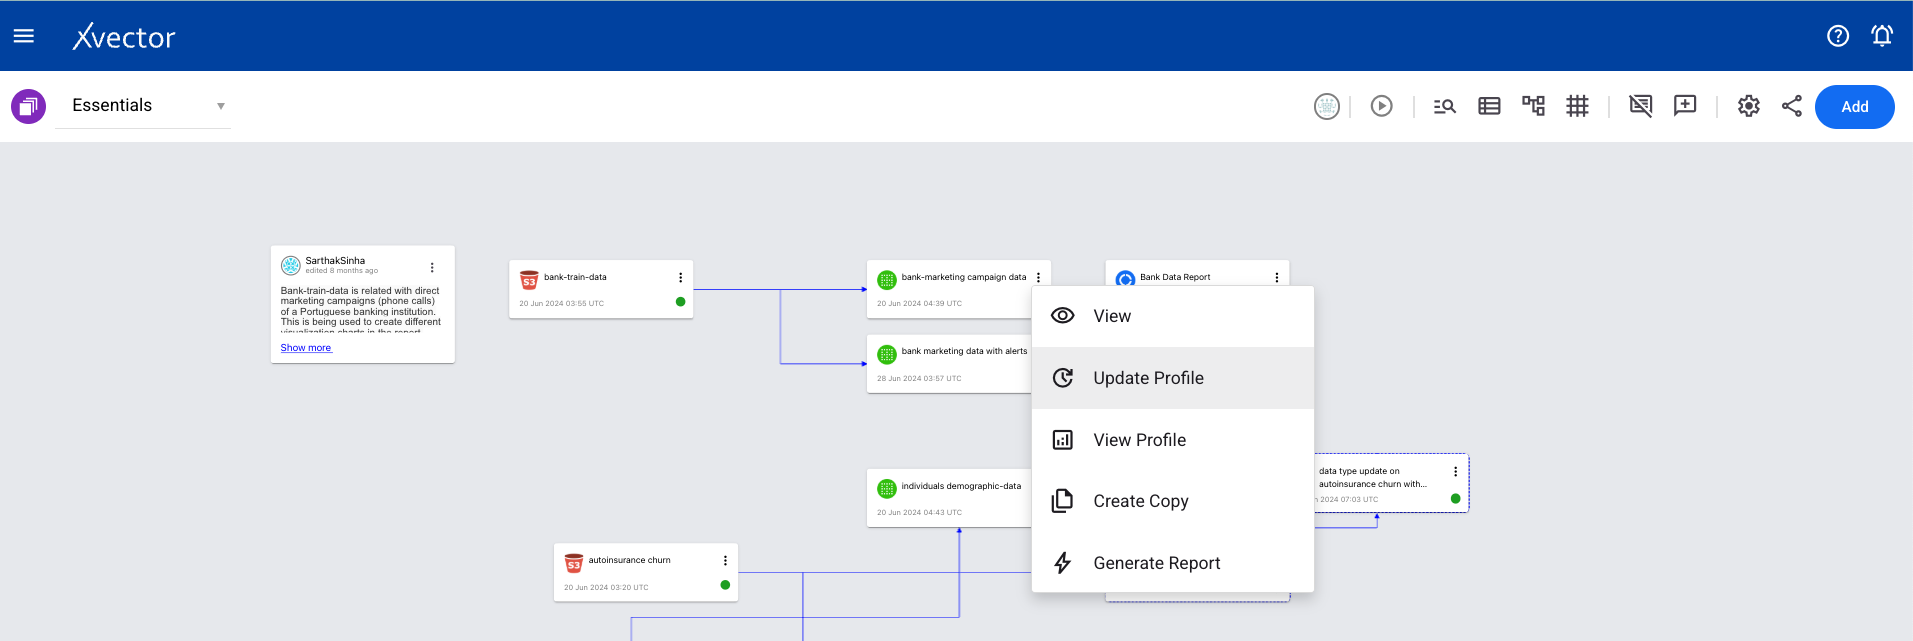
- View — Takes you to the dataset screen
- Update Profile — Run each time a dataset is created or updated to view the profile
- View Profile — View the profile (must run Update Profile first)
- Create Copy — Creates a copy of the data
- Generate Report — Generates an AI-powered report dashboard as a starting point
- Generate Exploratory Report — Generates an AI-powered report to explore the dataset
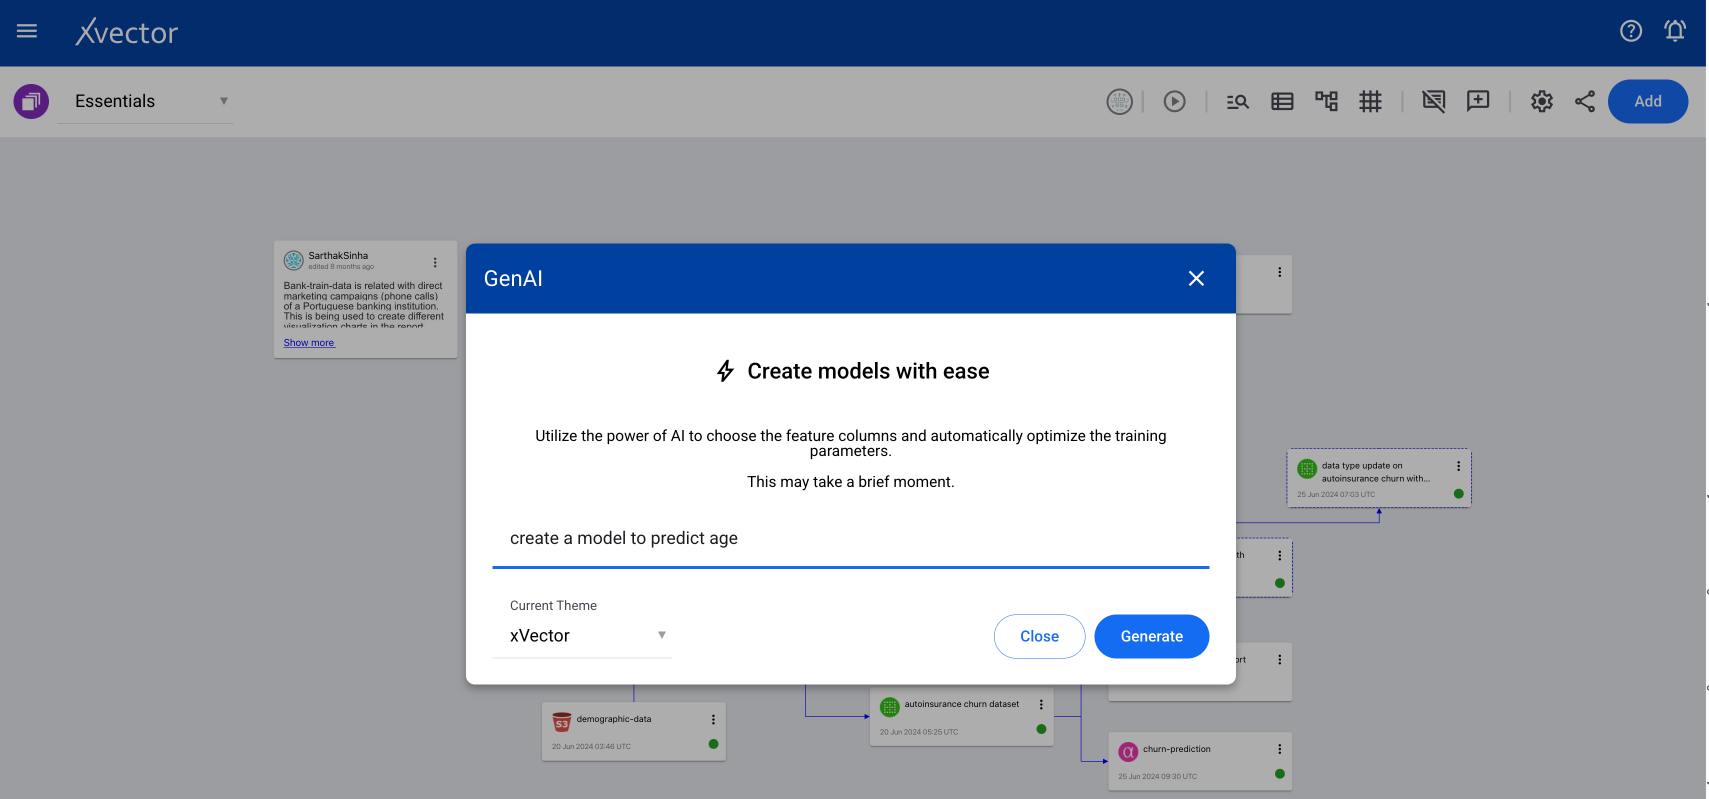
- Generate Model — Generates an AI-powered model by choosing feature columns and automatically optimizing training parameters based on your prompt
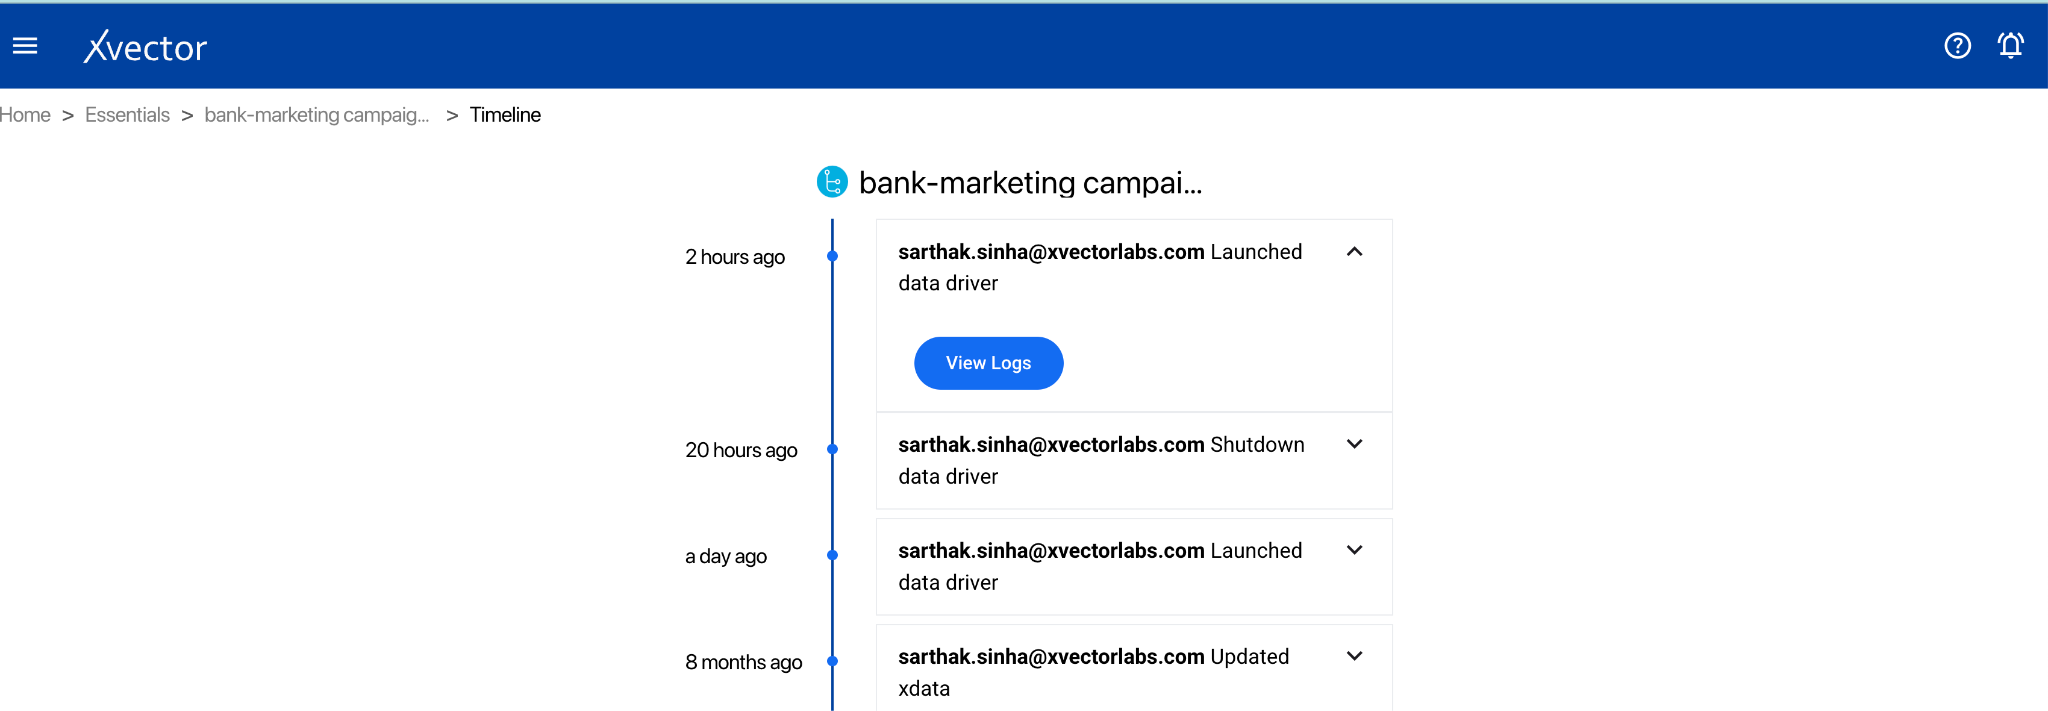
- Activity Logs — Shows the list of activities on that dataset
- Map Data — Column metadata mappings from source to target (used in data destination)
- Sync — Synchronizes the dataset with the data source
- Update — Updates the data as per source
- Materialize — Persists the dataset in the filesystem
- Publish — Publishes the data, assigning a version with a guaranteed interface
- Export — Writes the data to a target system (points to Data Destination)
- Settings — Opens the settings tab for the dataset
- Delete — Deletes the dataset
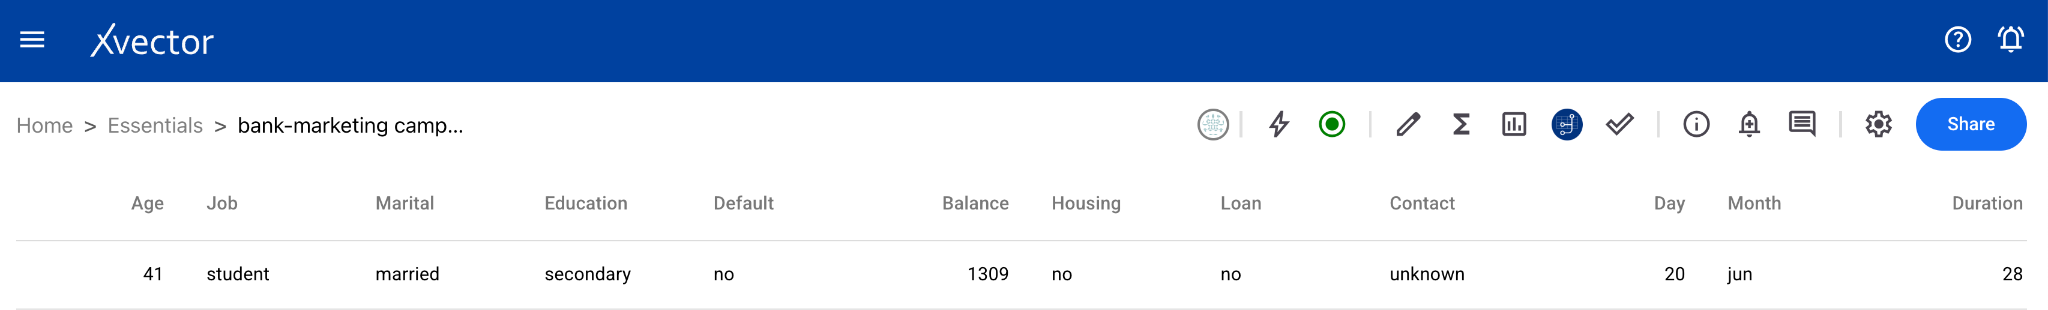
Dataset View Page
Section titled “Dataset View Page”The dataset page view provides a toolbar with features from left to right:
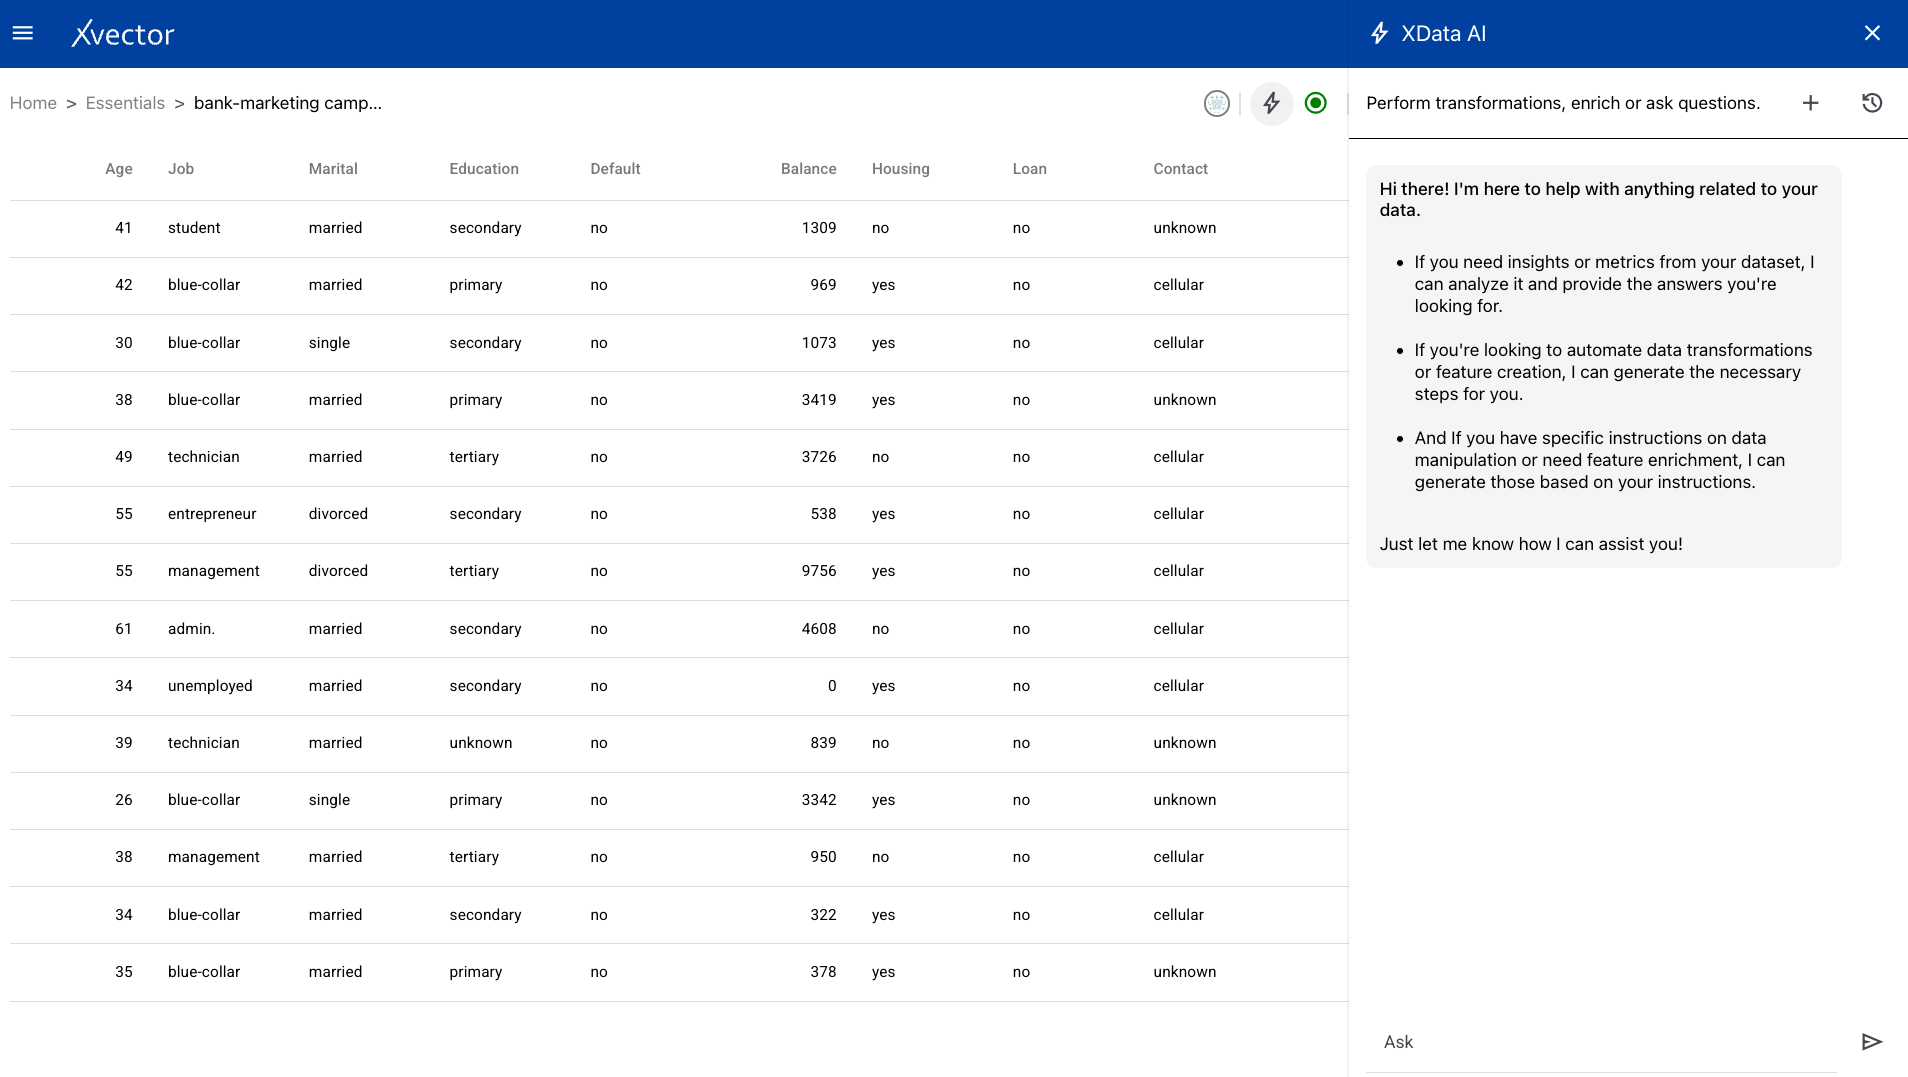
Presence — Shows which users are in the workspace. There can be more than one user at a time.

GenAI — Ask data-related questions in natural language and get an automatic response. For example: “How many unique values does the age column have?”
Driver (play button) — Starts or shuts down the DML driver for the dataset.
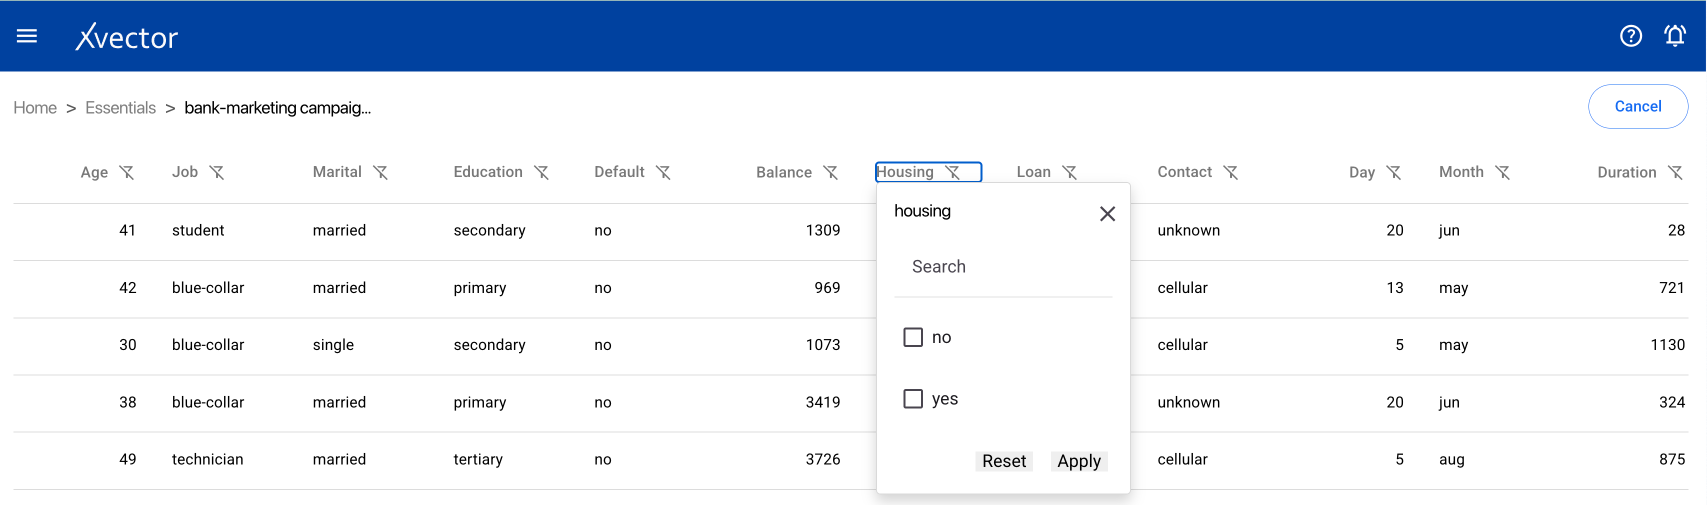
Edit Table — Search or filter each of the columns in the dataset.
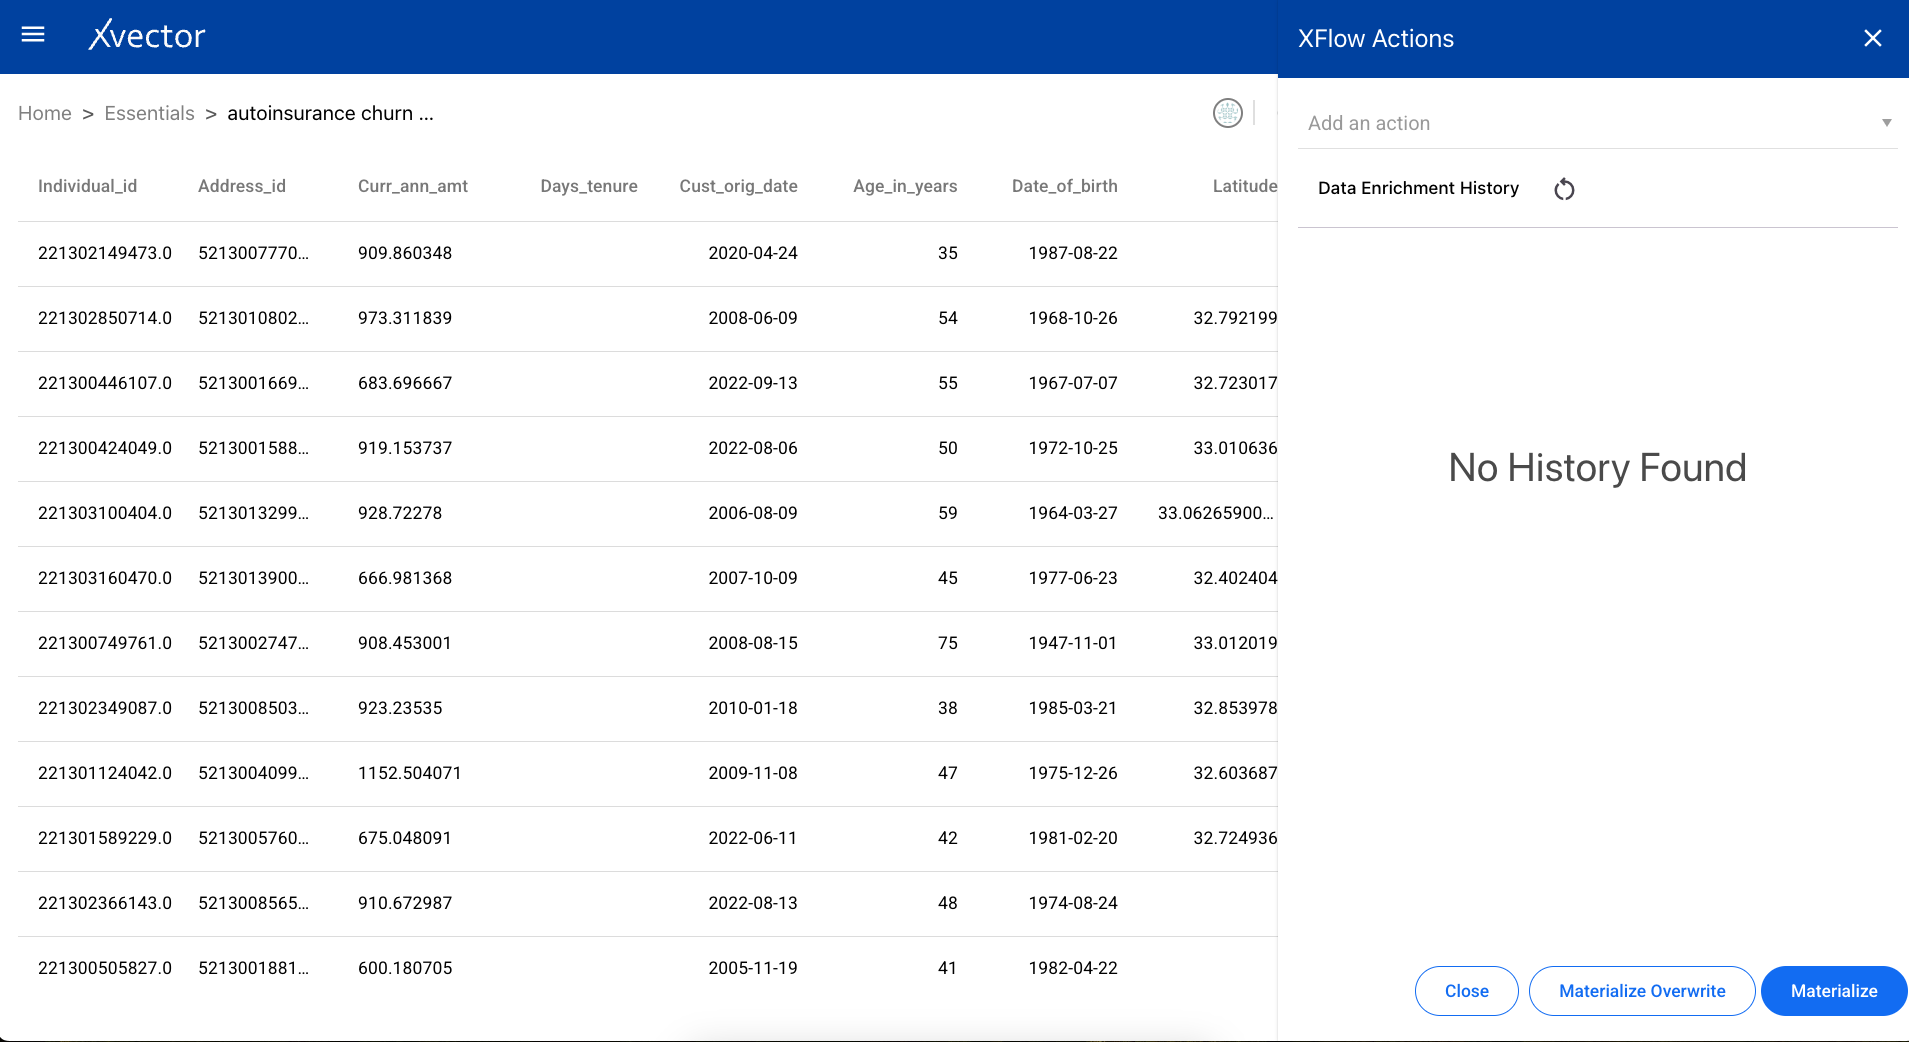
Data Enrichment (Σ) — Option to add xflow actions or view enrichment history. See the Enrichment Functions section below.
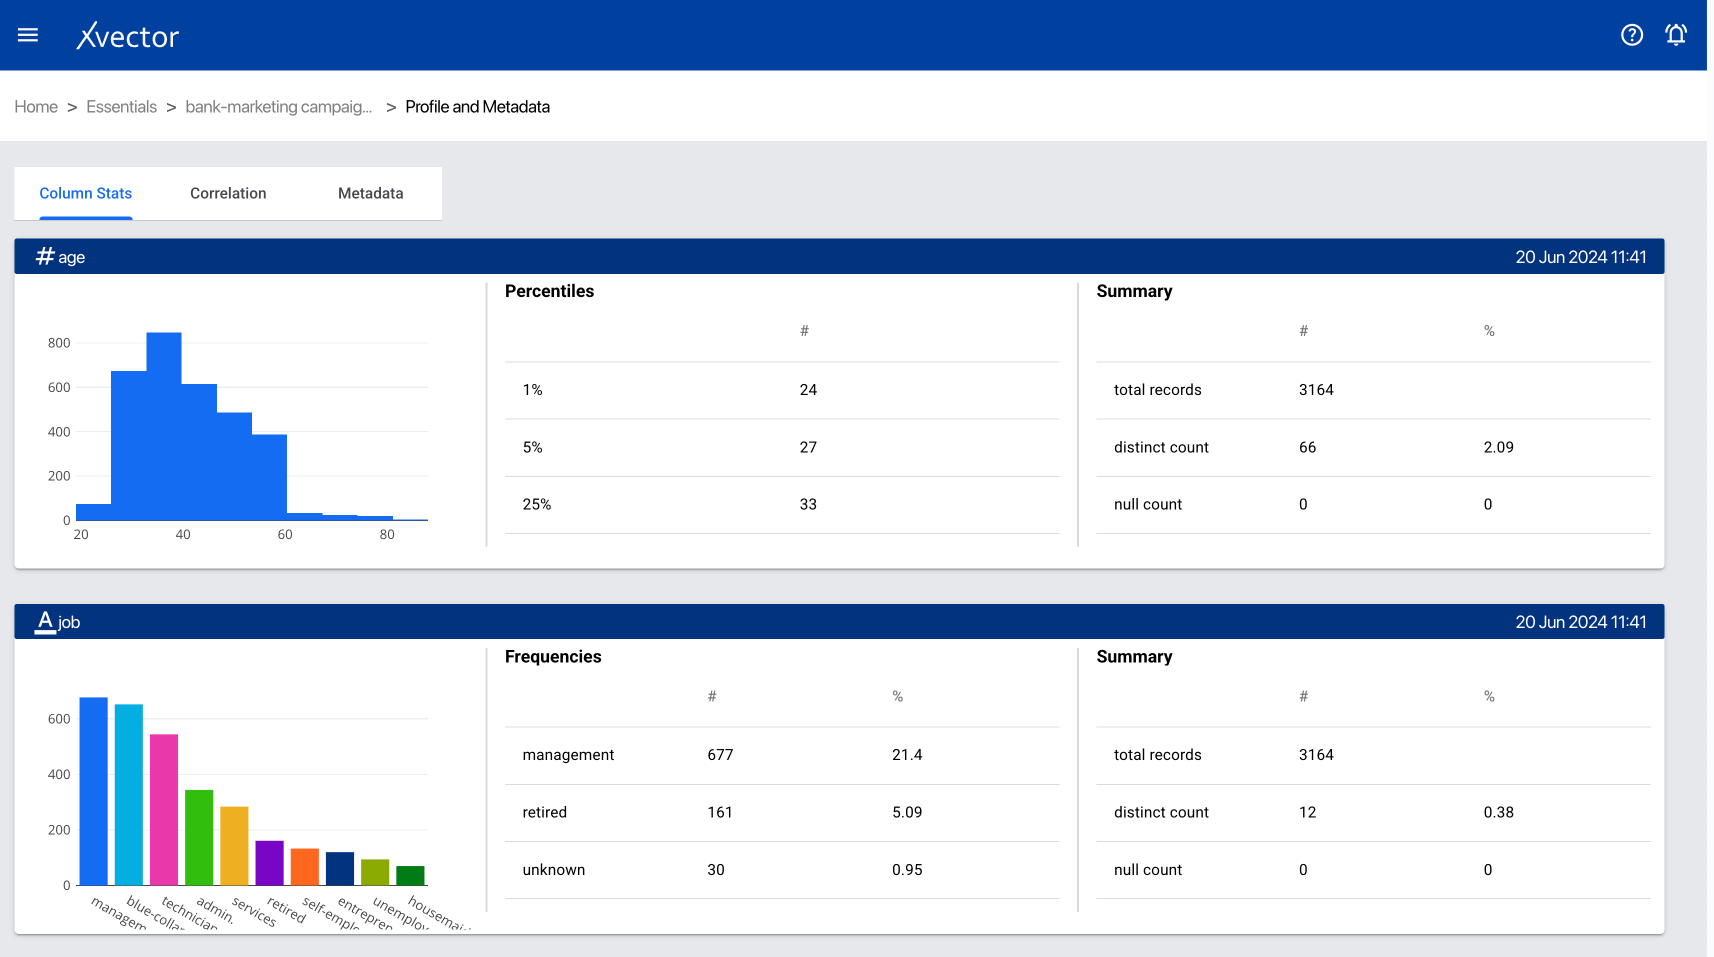
Profile and Metadata Report:
- Column Stats — shows histogram and statistical information
- Correlation — shows the correlation matrix
- Column Metadata — metadata of the dataset
Write Back — Write the data to a target system.
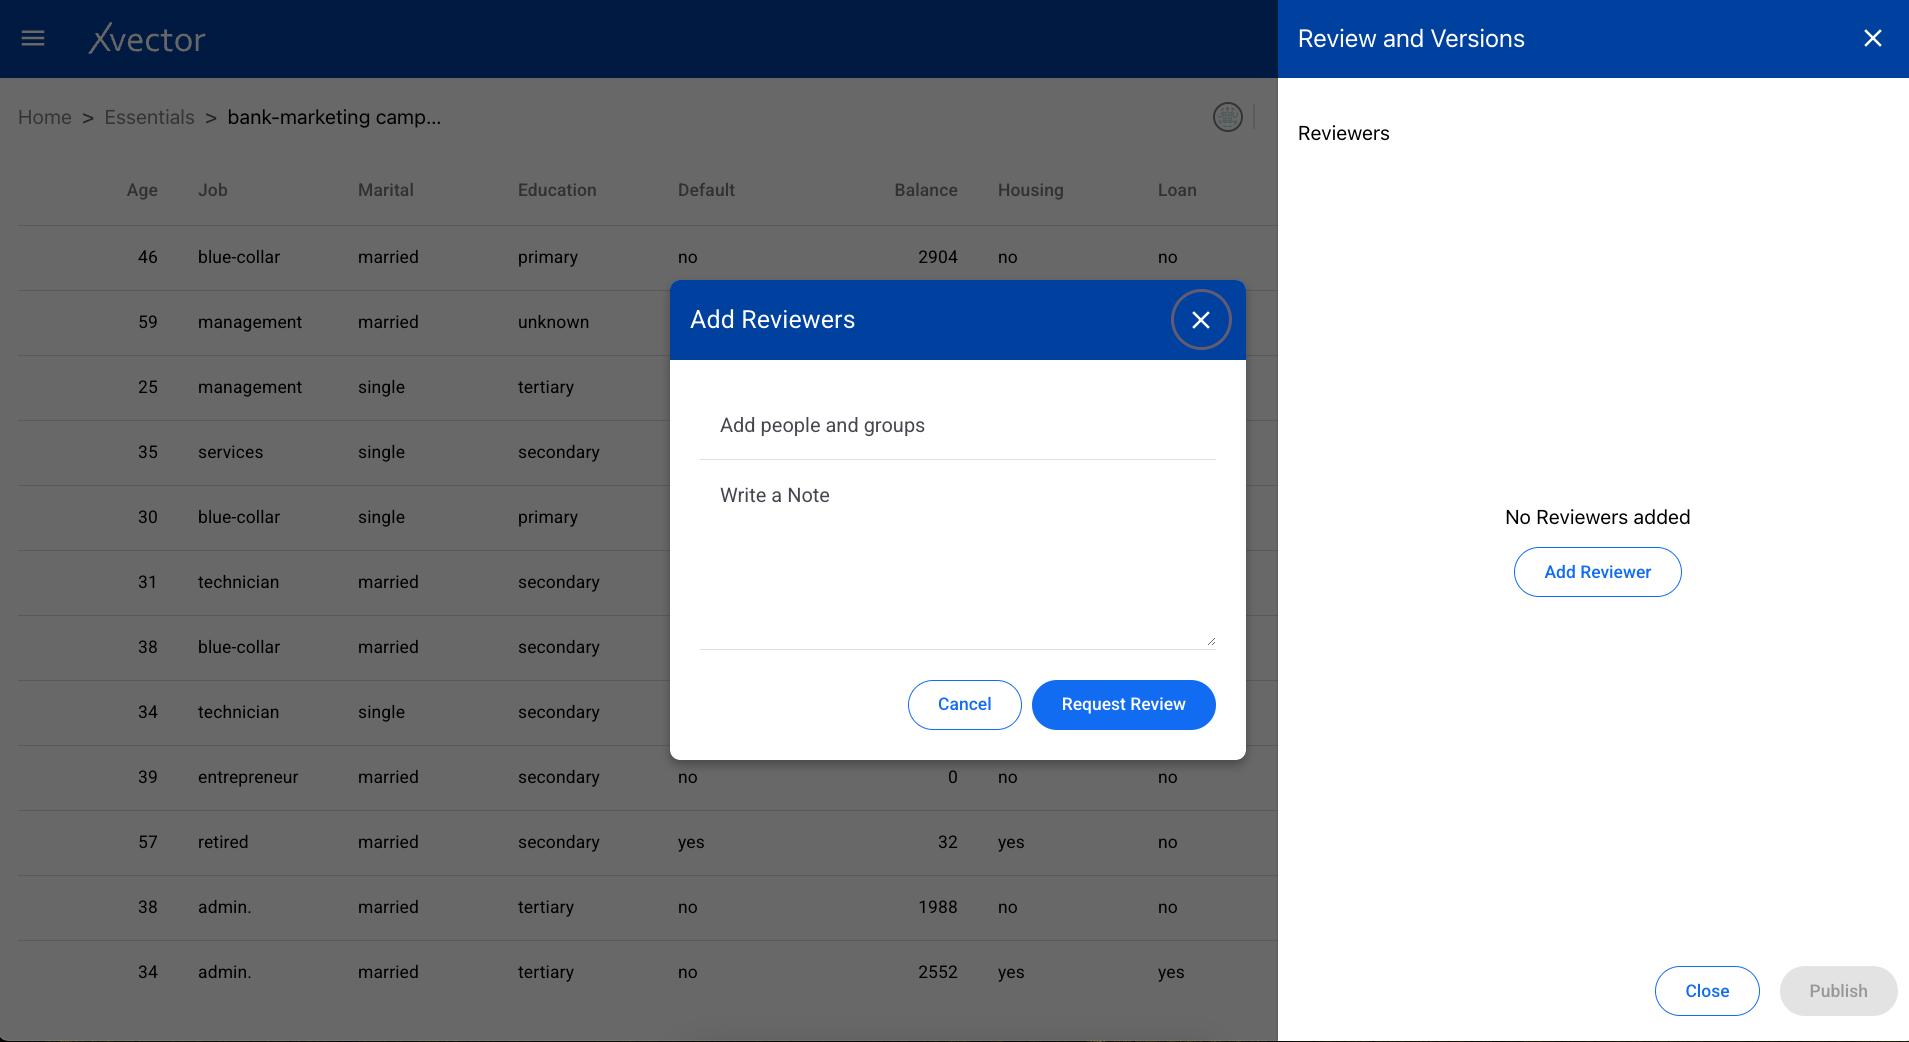
Reviews and Version Control — Add reviewers and publish different versions.
Action Logs — Shows the logs of actions taken on the dataset.
Alerts — Create, update, or subscribe to alerts. See the Alerts section below.
Comments — Add comments to collaborate with other users.
Settings:
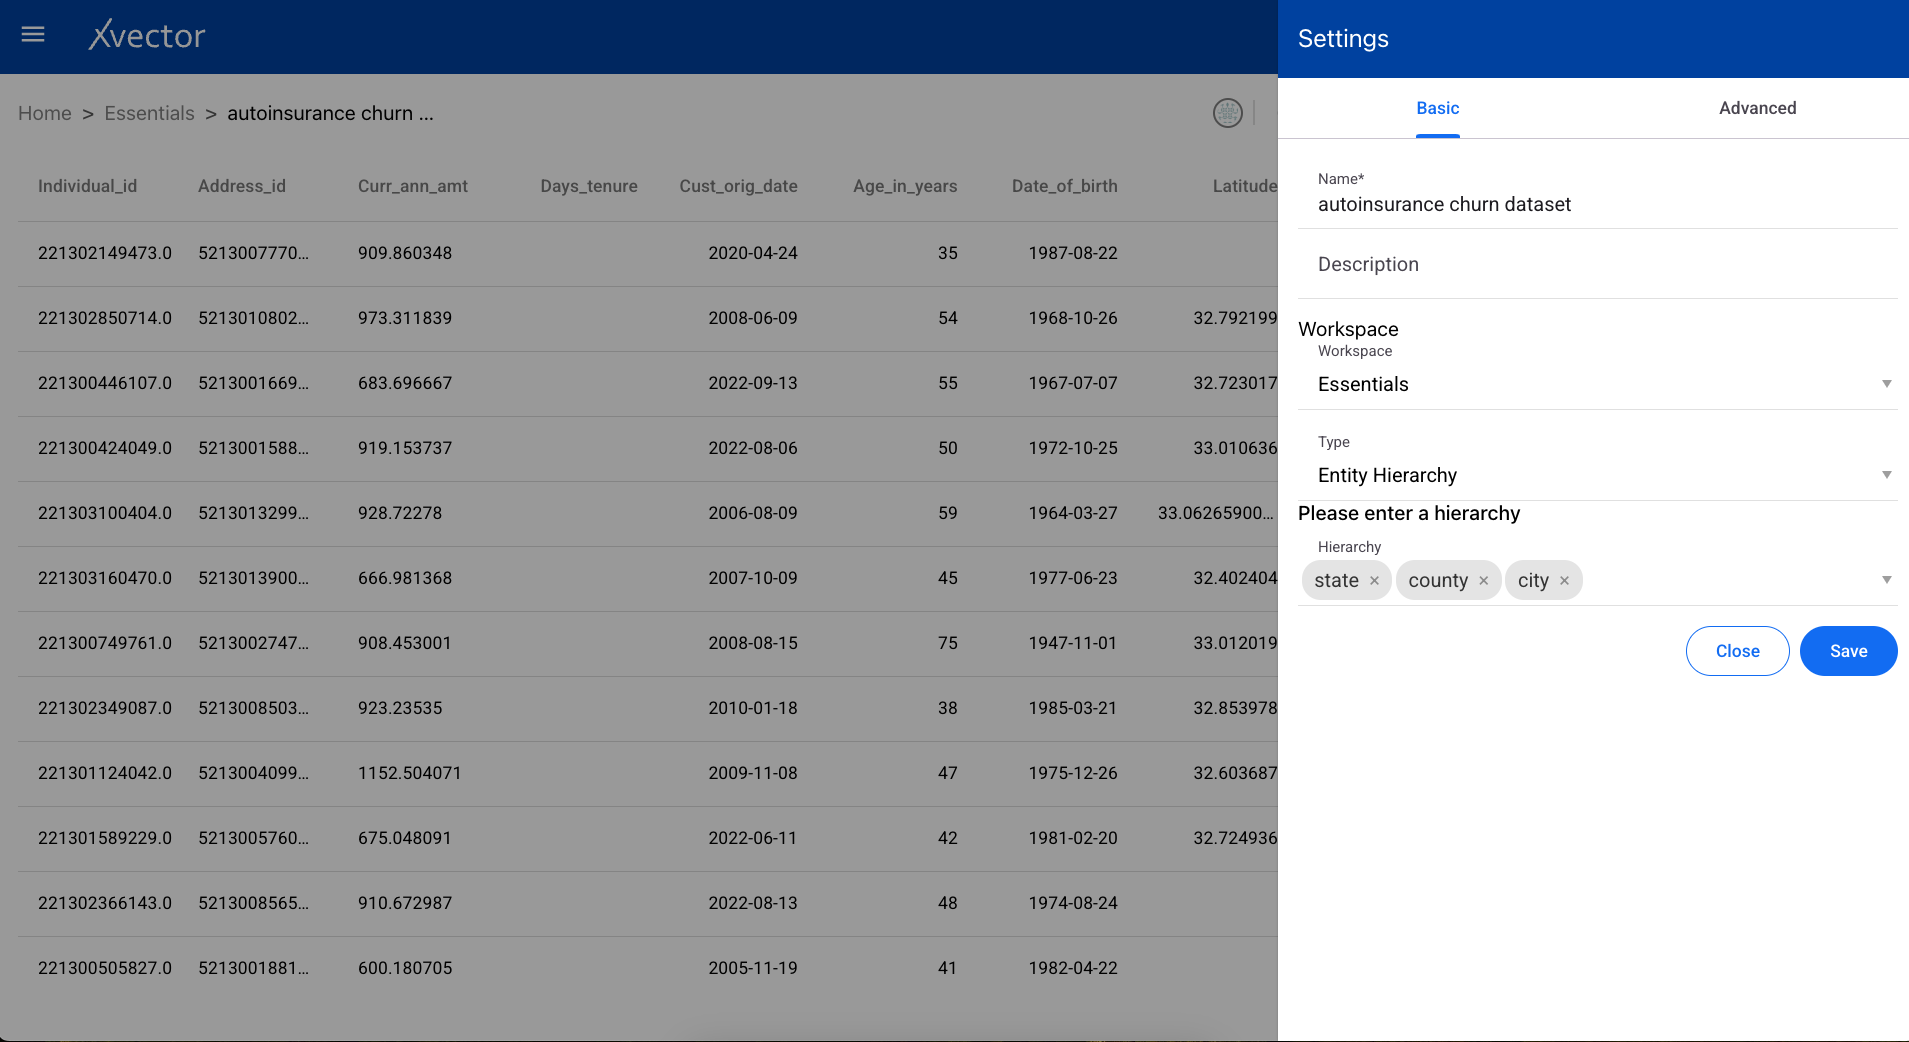
- Basic — Name, Description, Workspace, Type (entity or fact)
- Advanced — Spark parameters, Synchronization settings (policy type: on demand / on schedule / rule-based; write mode: upsert / insert / bulk insert; update profile; anomaly detection; alerts)
- Share — Share the dataset with users or user groups
- View — View the data
Enrichment Functions
Section titled “Enrichment Functions”The dataset is enriched using a series (flow) of functions such as aggregates and filters. Users can also apply trained models to compute new columns. Advanced users can author custom functions to manipulate data.
Getting to Enrichment Functions
Section titled “Getting to Enrichment Functions”- From a Workspace, click the ellipses on the dataset (tile with green icon) and click View, or double-click the dataset.
- The DML driver needs to be up and running (green dot in the icons). Start it using the play-button icon.
- Click on the sigma icon (Σ) to open data enrichment.
- Click Add an action and choose the function from the dropdown list.
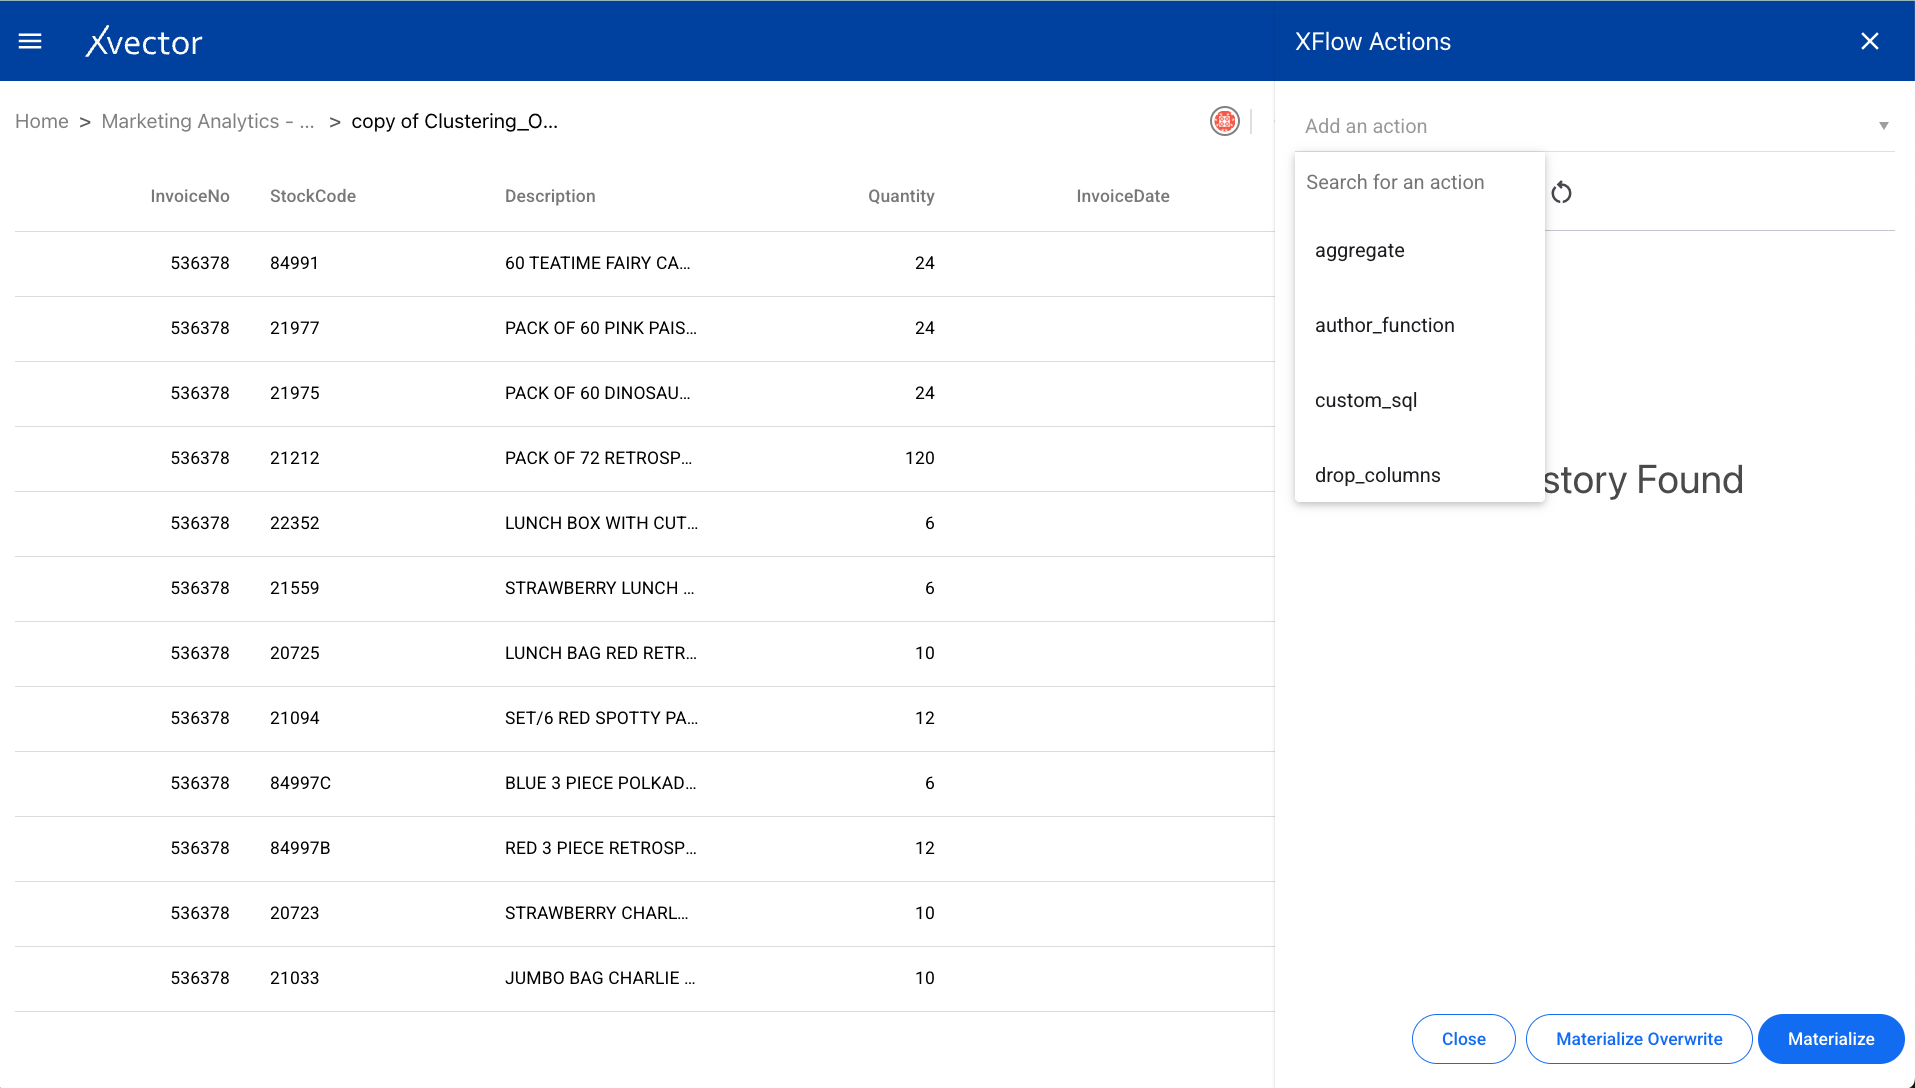
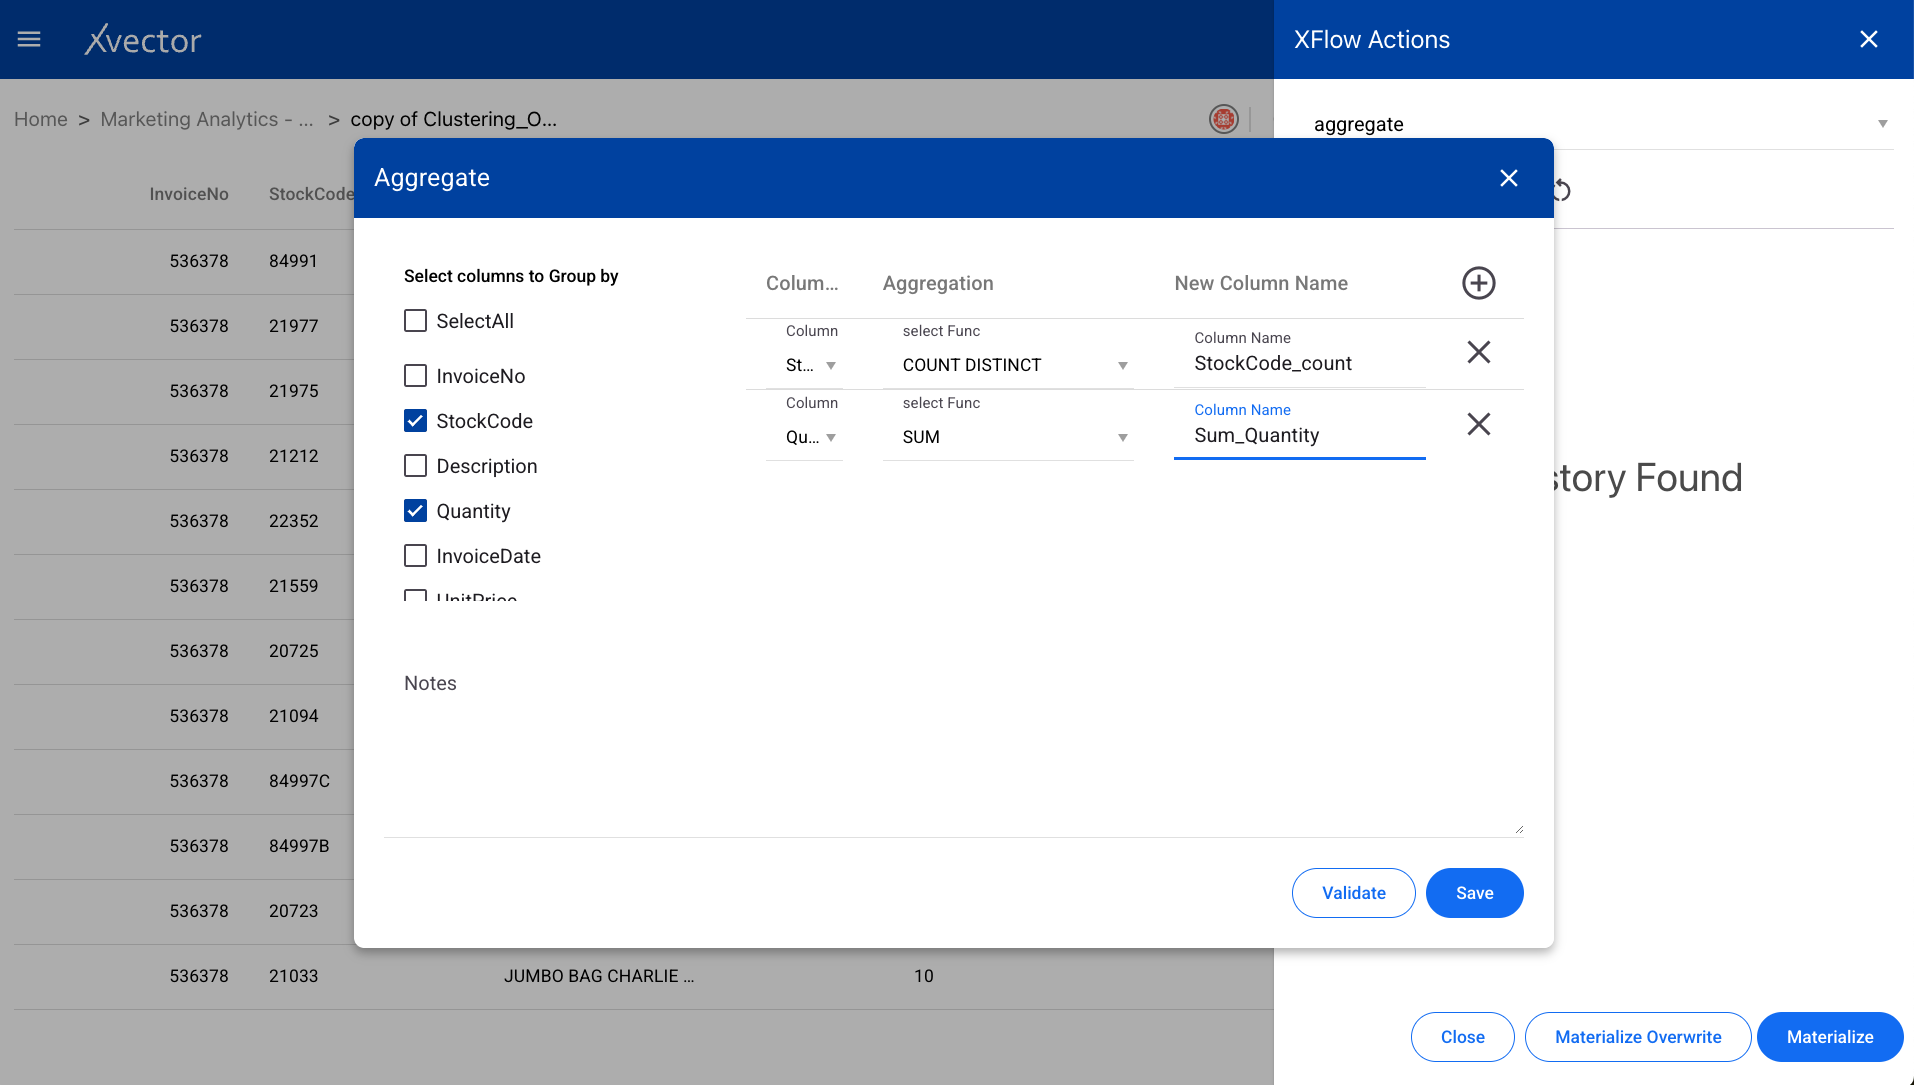
Aggregate
Section titled “Aggregate”Performs a calculation on a set of values and returns a single value such as SUM, Average, etc. Select the group-by columns and the aggregation functions to apply.
Author
Section titled “Author”The “author” function is used for writing a custom function to be applied on the dataset. This is useful for advanced users who need to implement transformations not available in the standard function list.
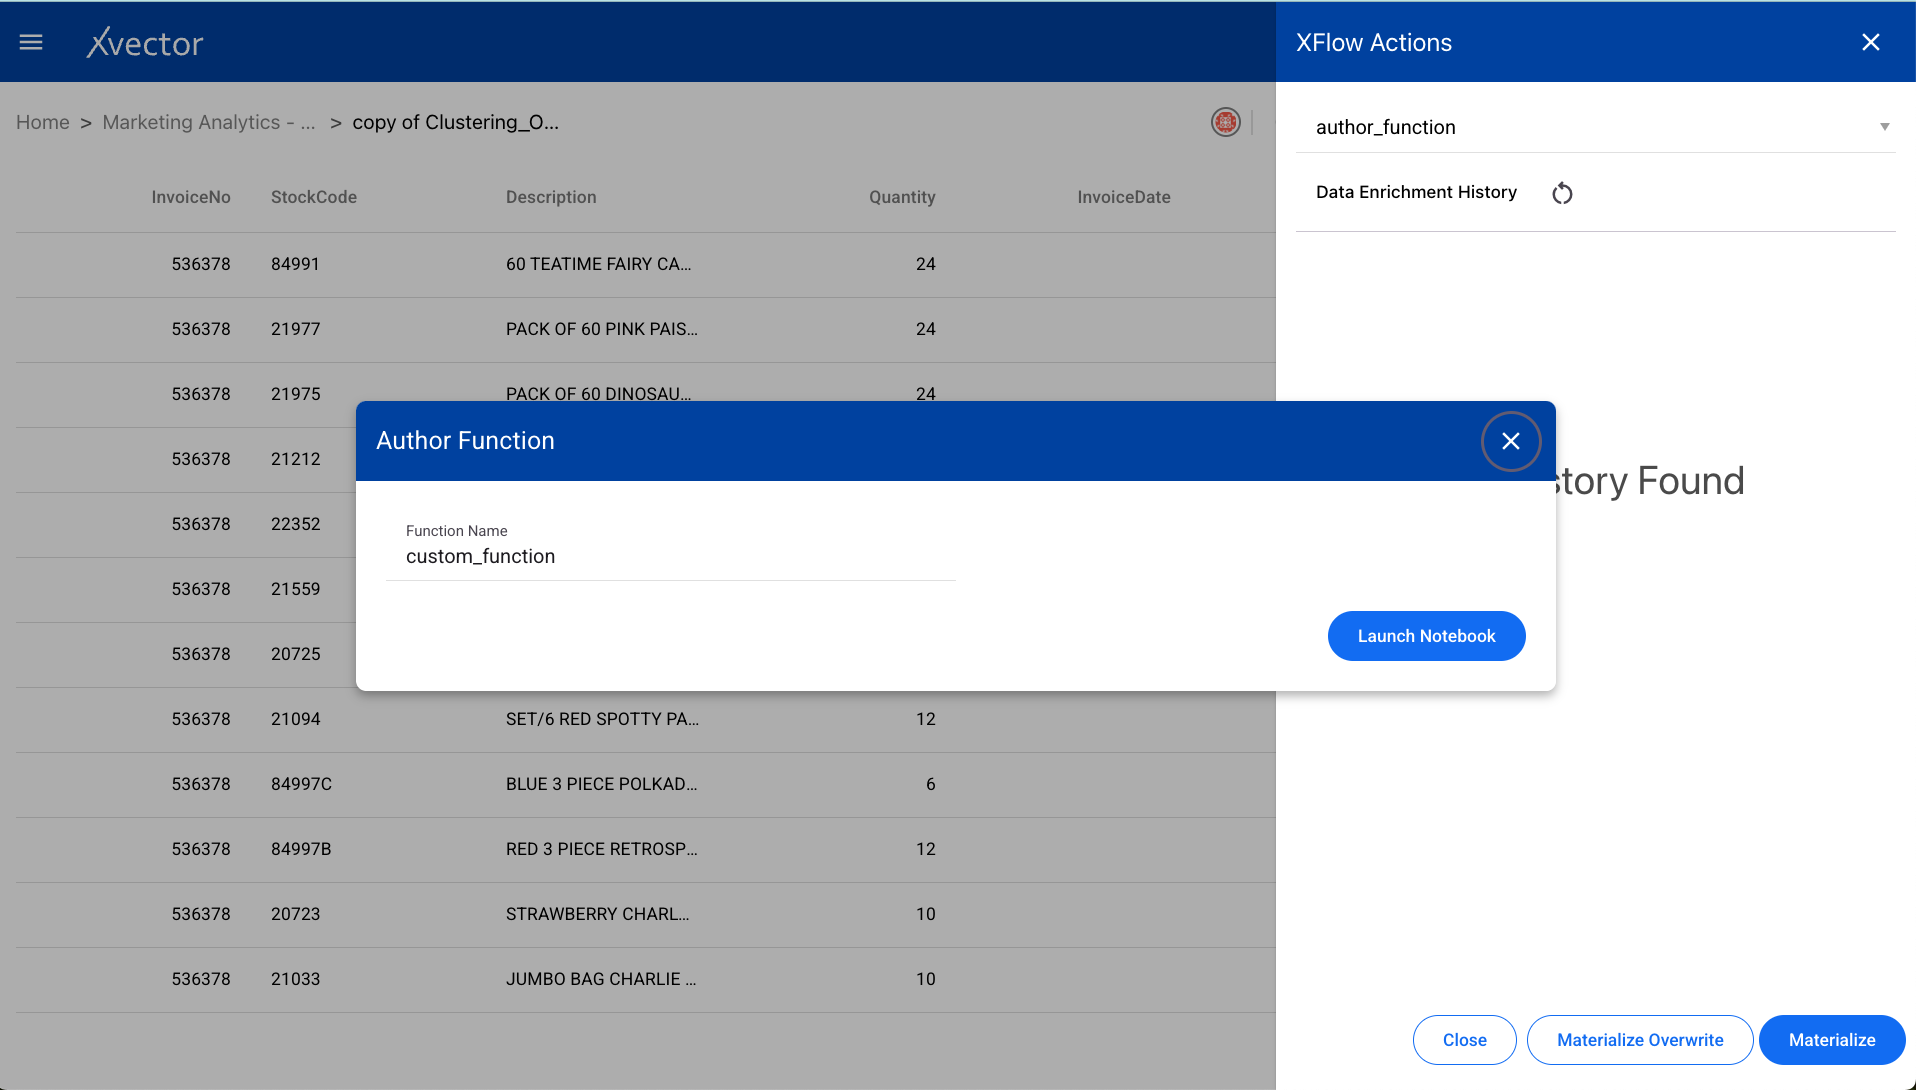
Update the custom_function in the notebook editor:
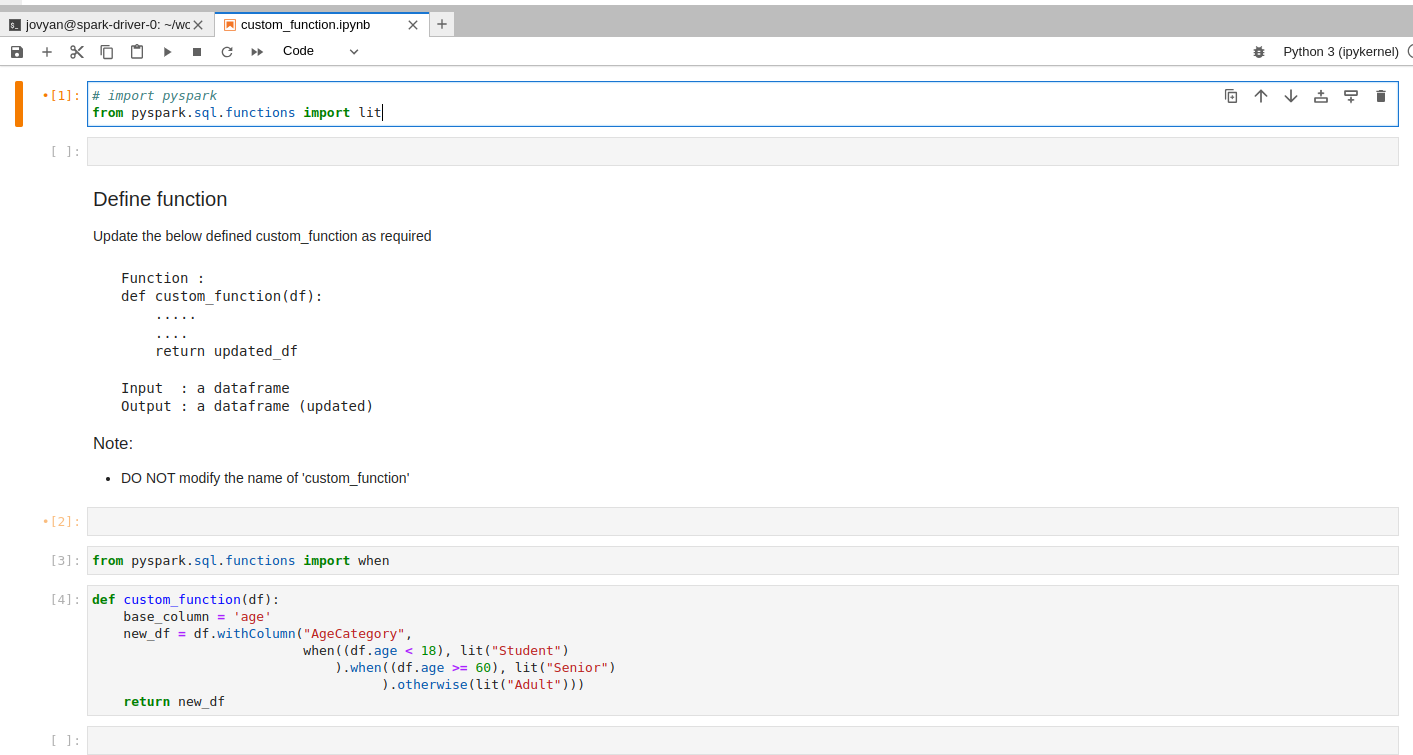
After writing the function, do Materialize / Materialize Overwrite as needed to persist the updated dataset.
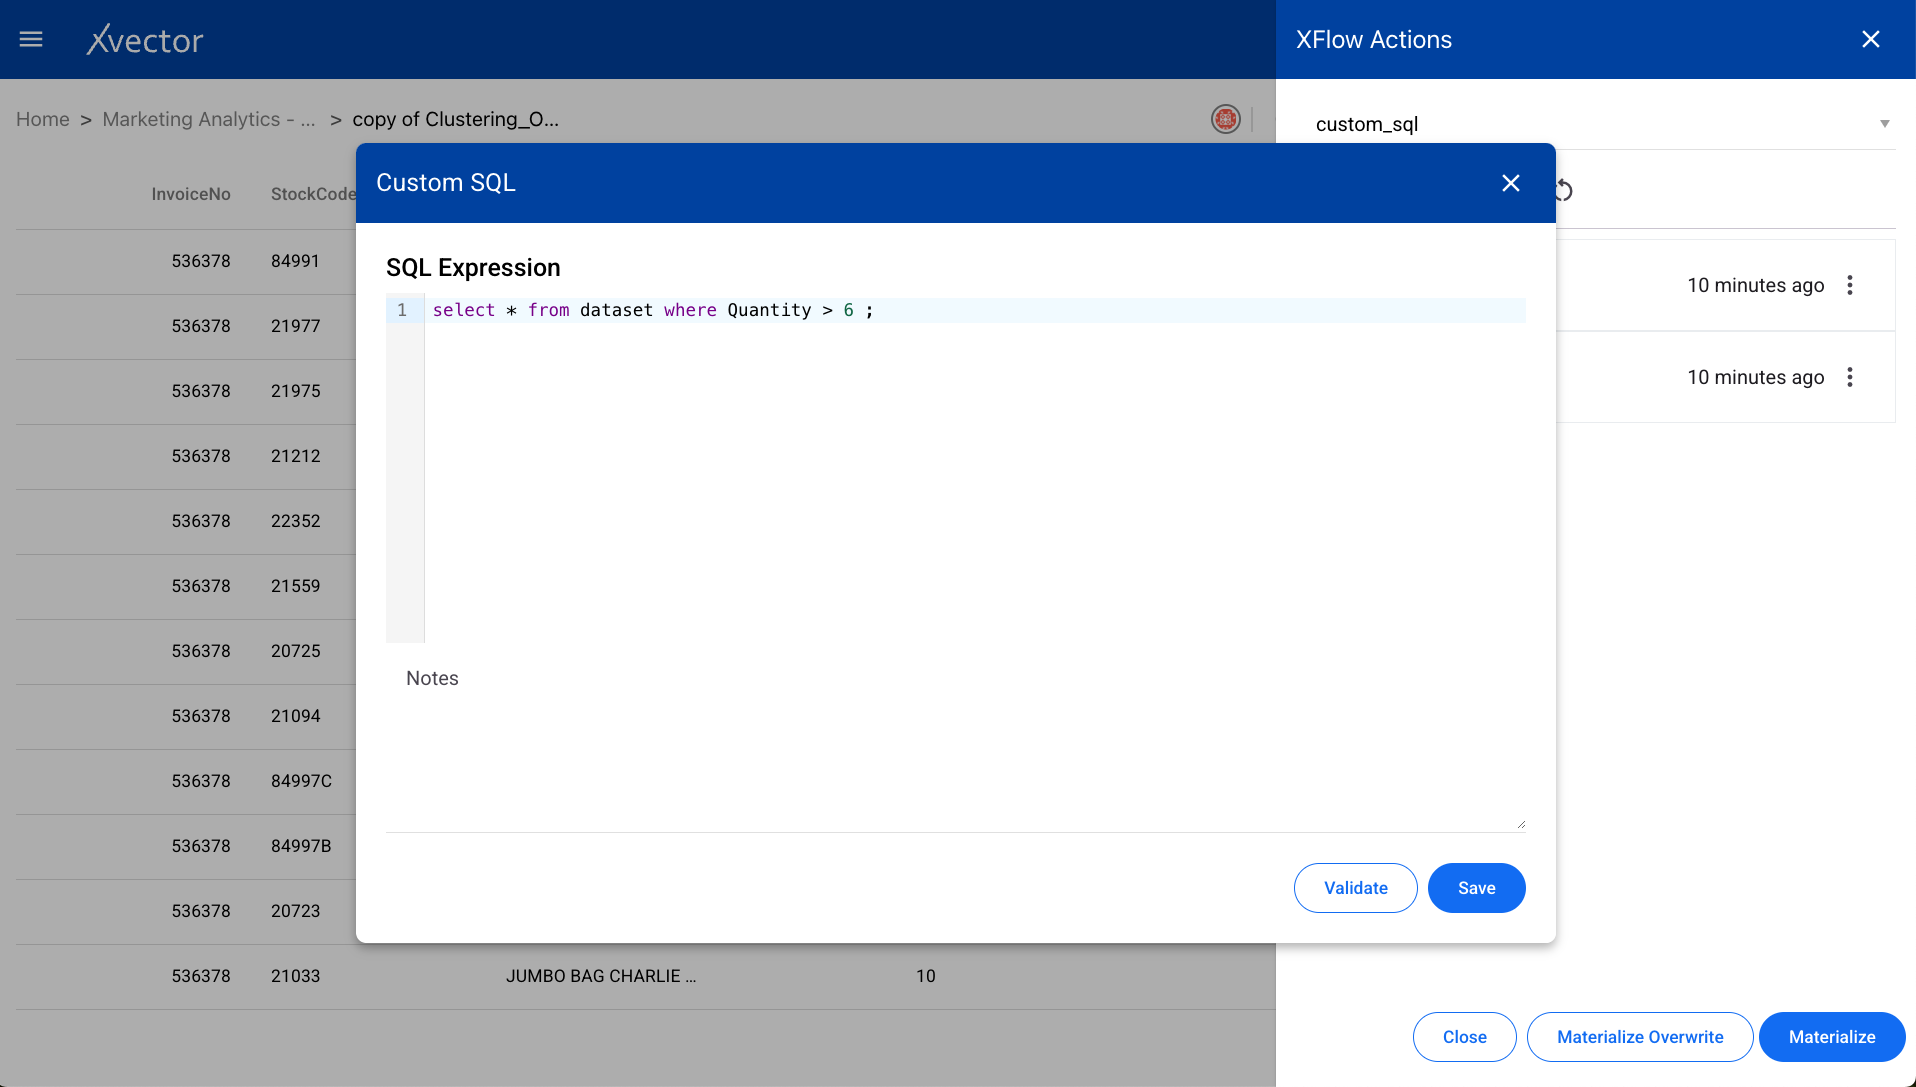
Custom SQL
Section titled “Custom SQL”Write custom SQL queries against the dataset using the SQL editor.
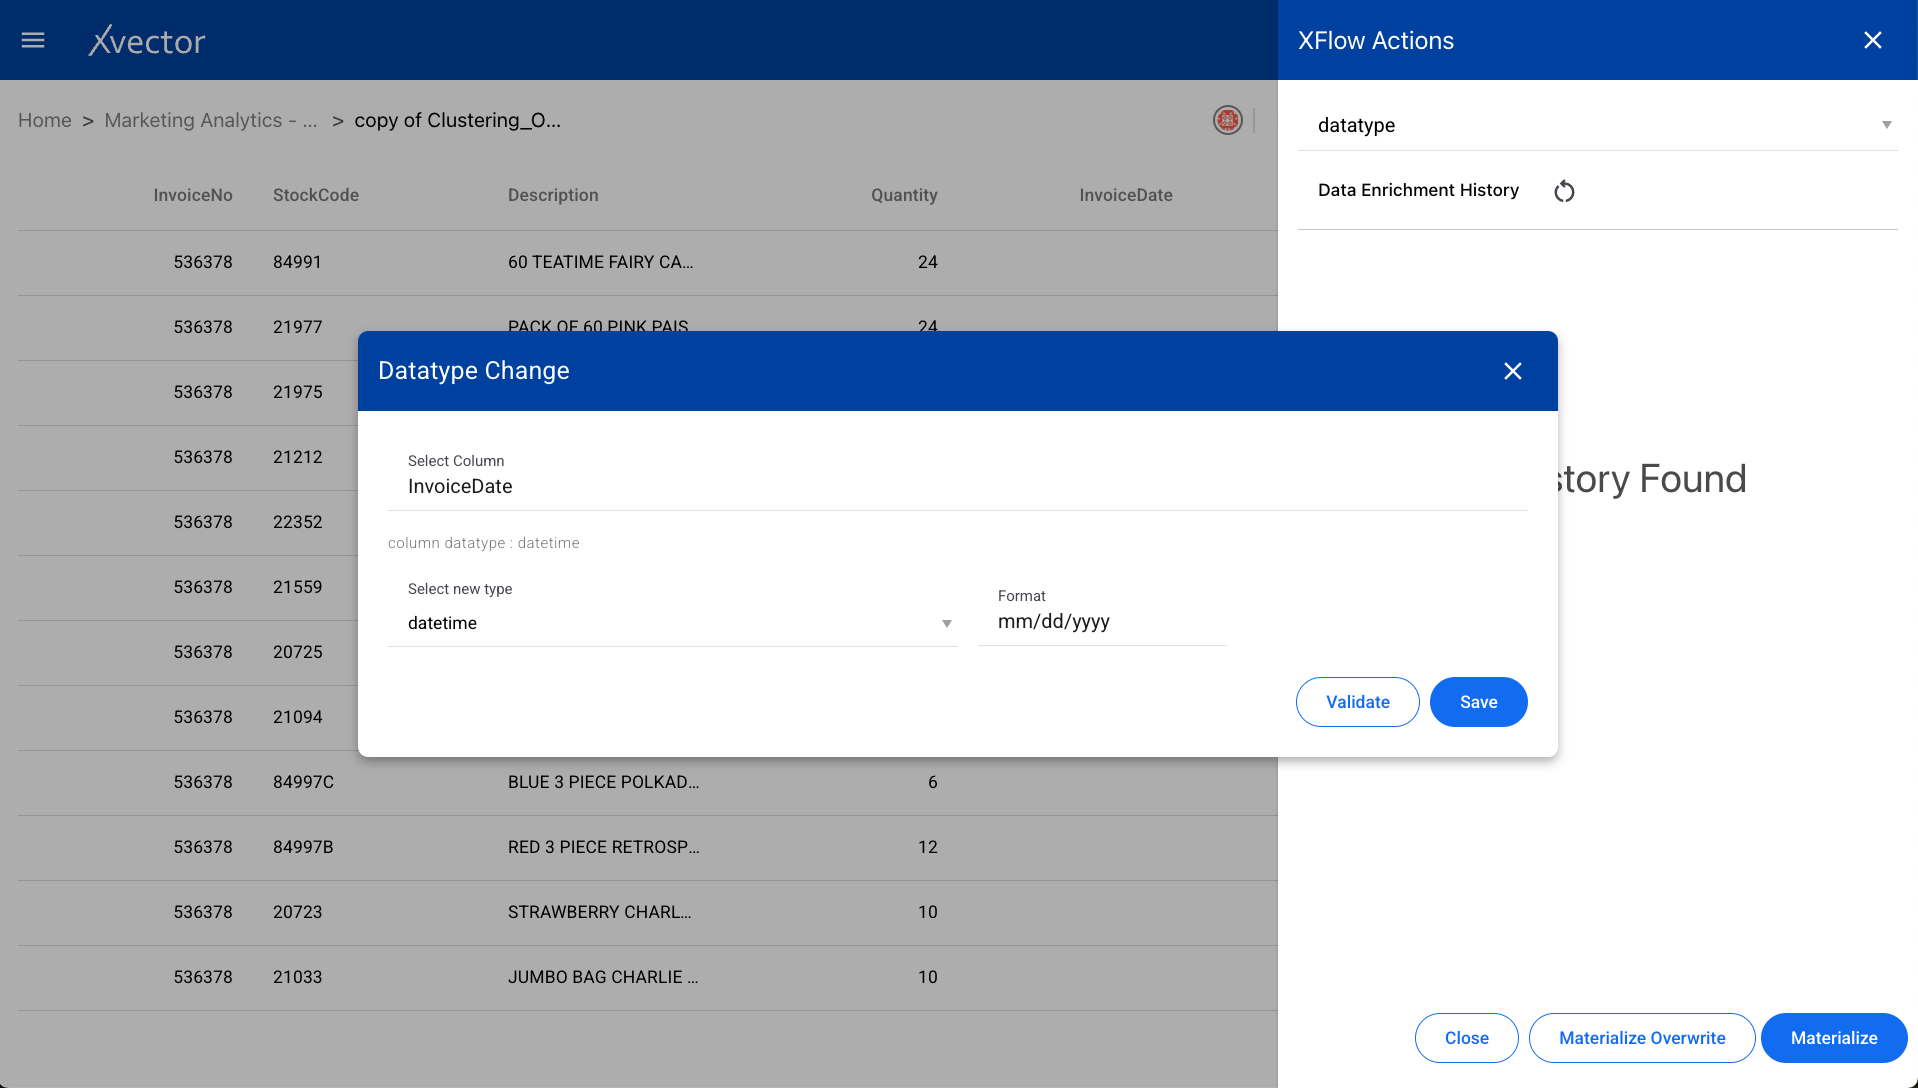
Datatype
Section titled “Datatype”Changes the data type of a column in the dataset. Select the column and the target data type.
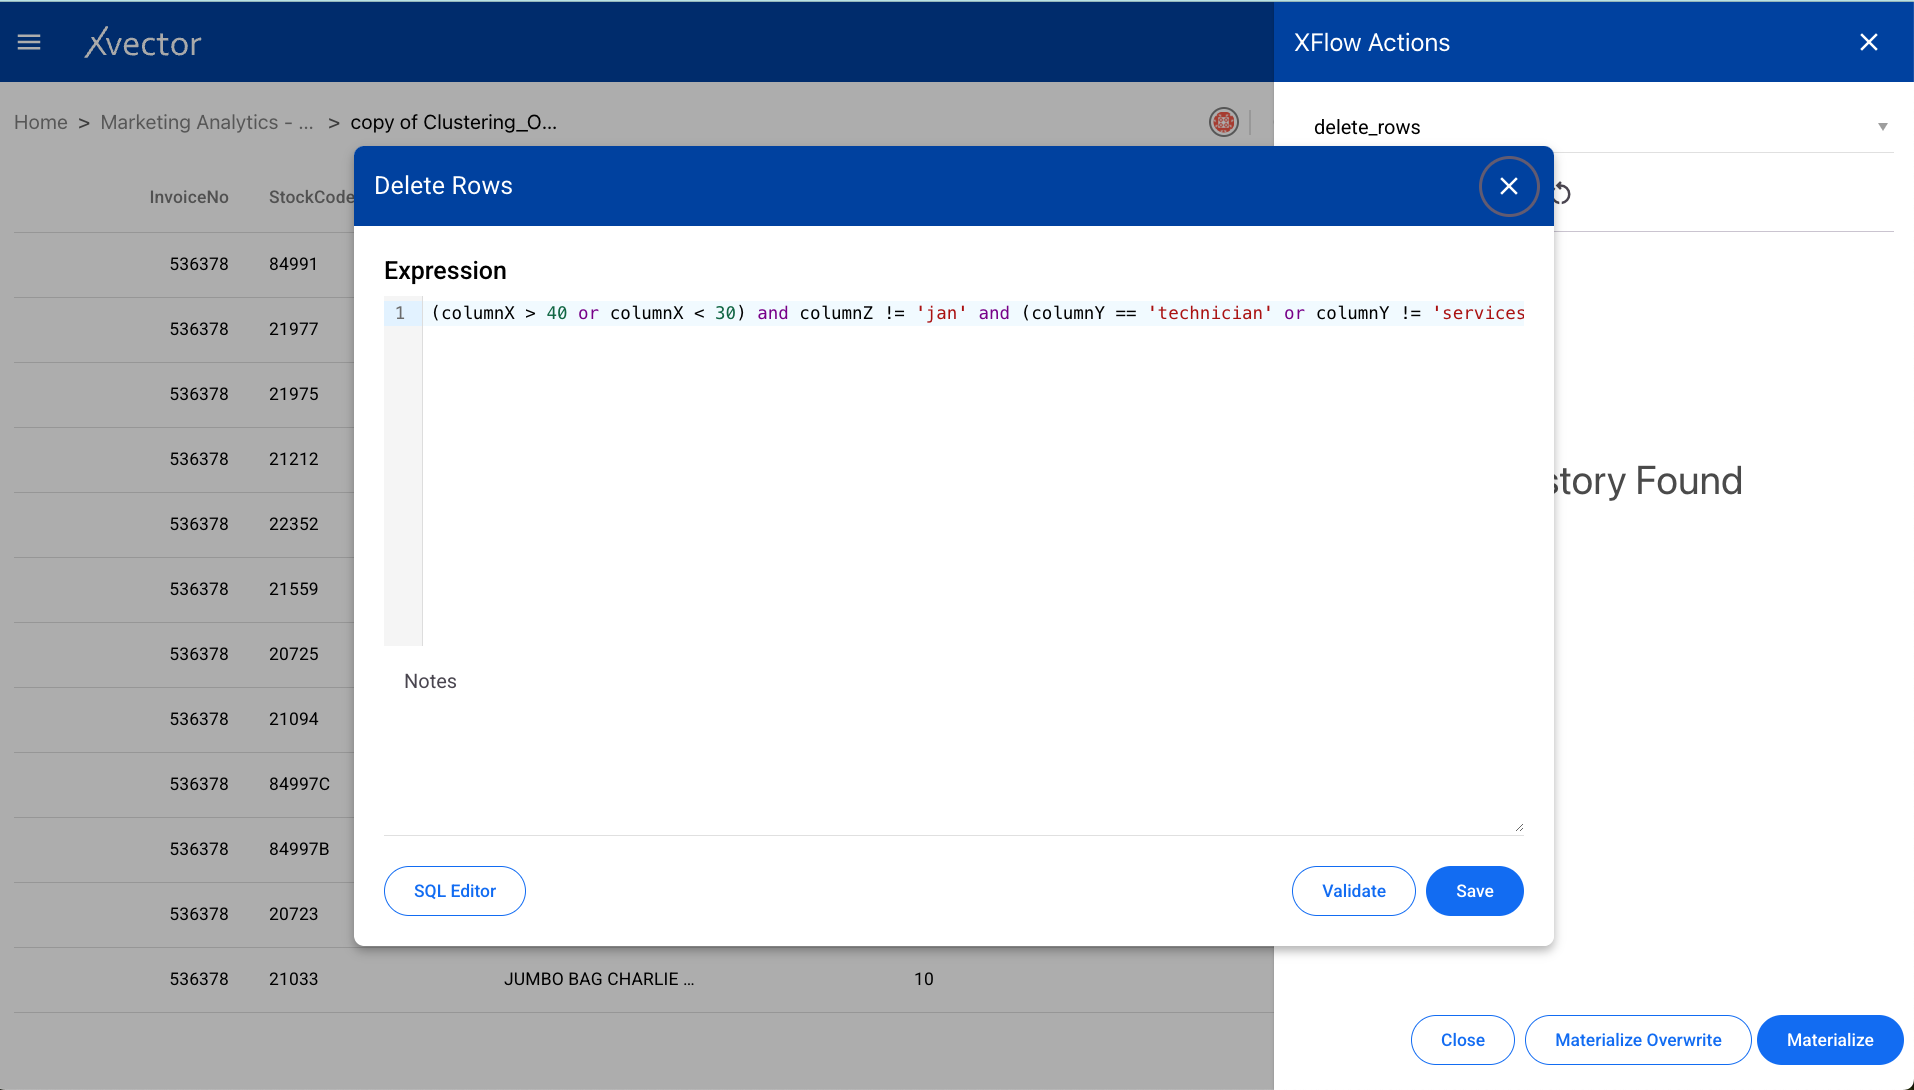
Delete Rows
Section titled “Delete Rows”Removes specific rows from the dataset based on filter criteria.
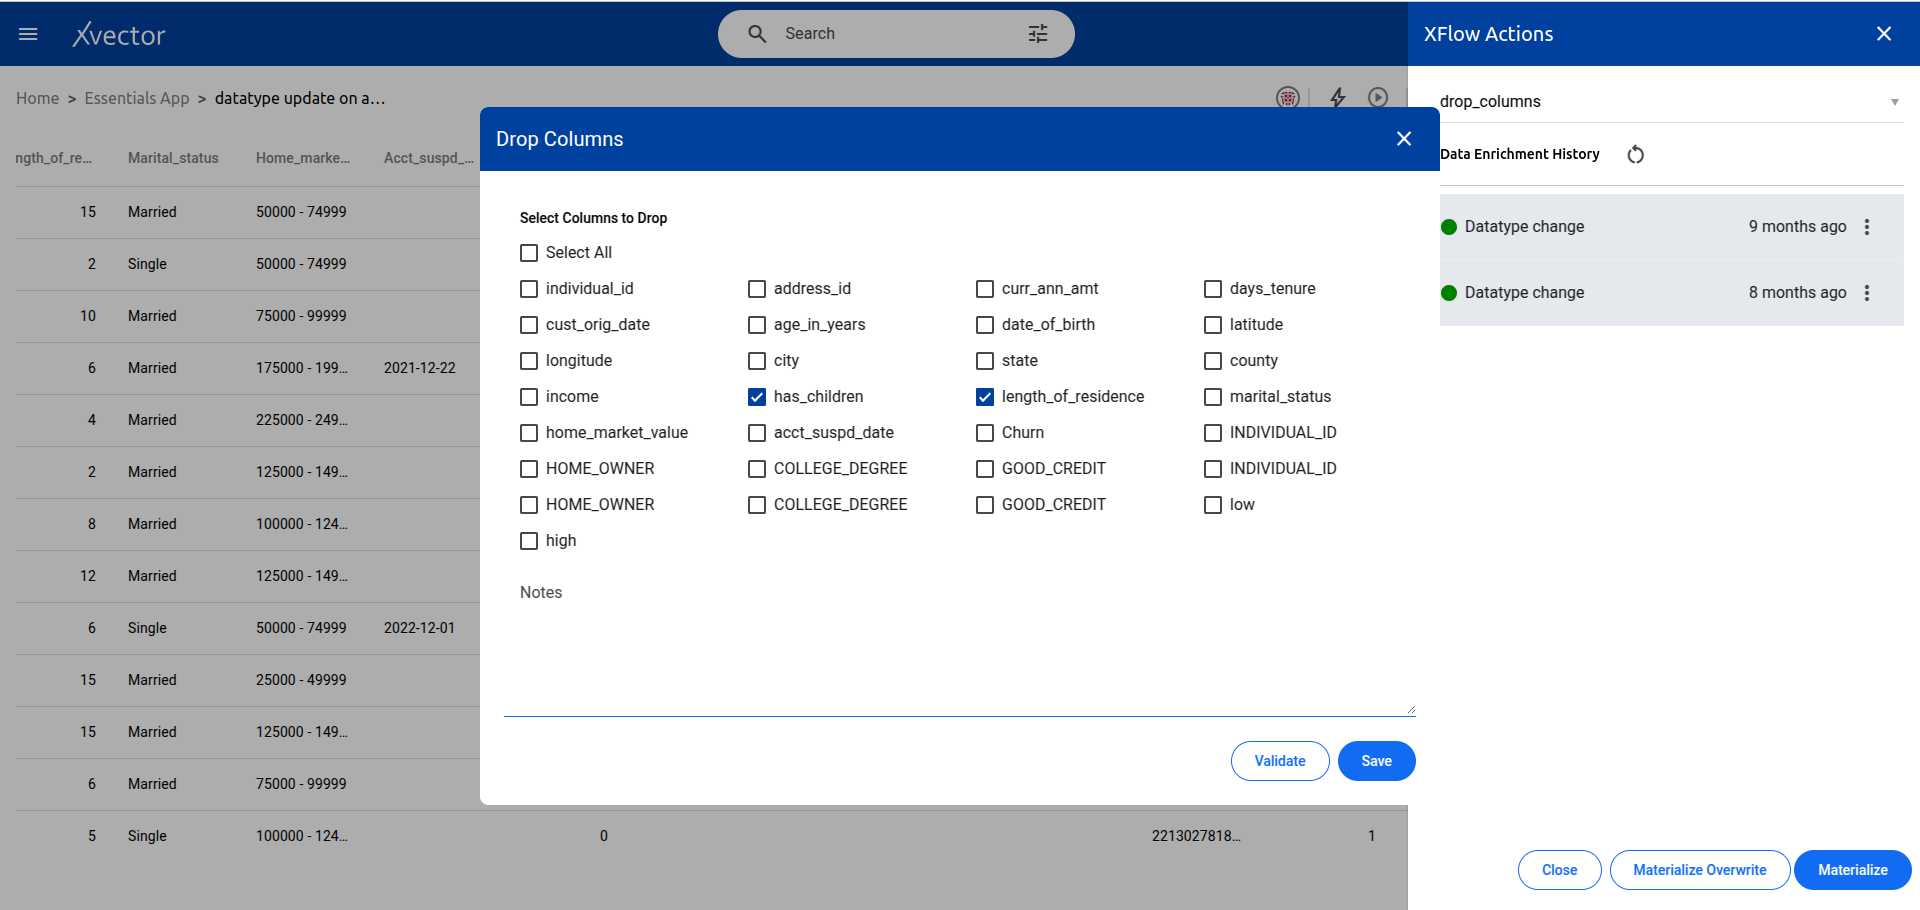
Drop Columns
Section titled “Drop Columns”Removes columns from the dataset. Select the columns to be dropped.
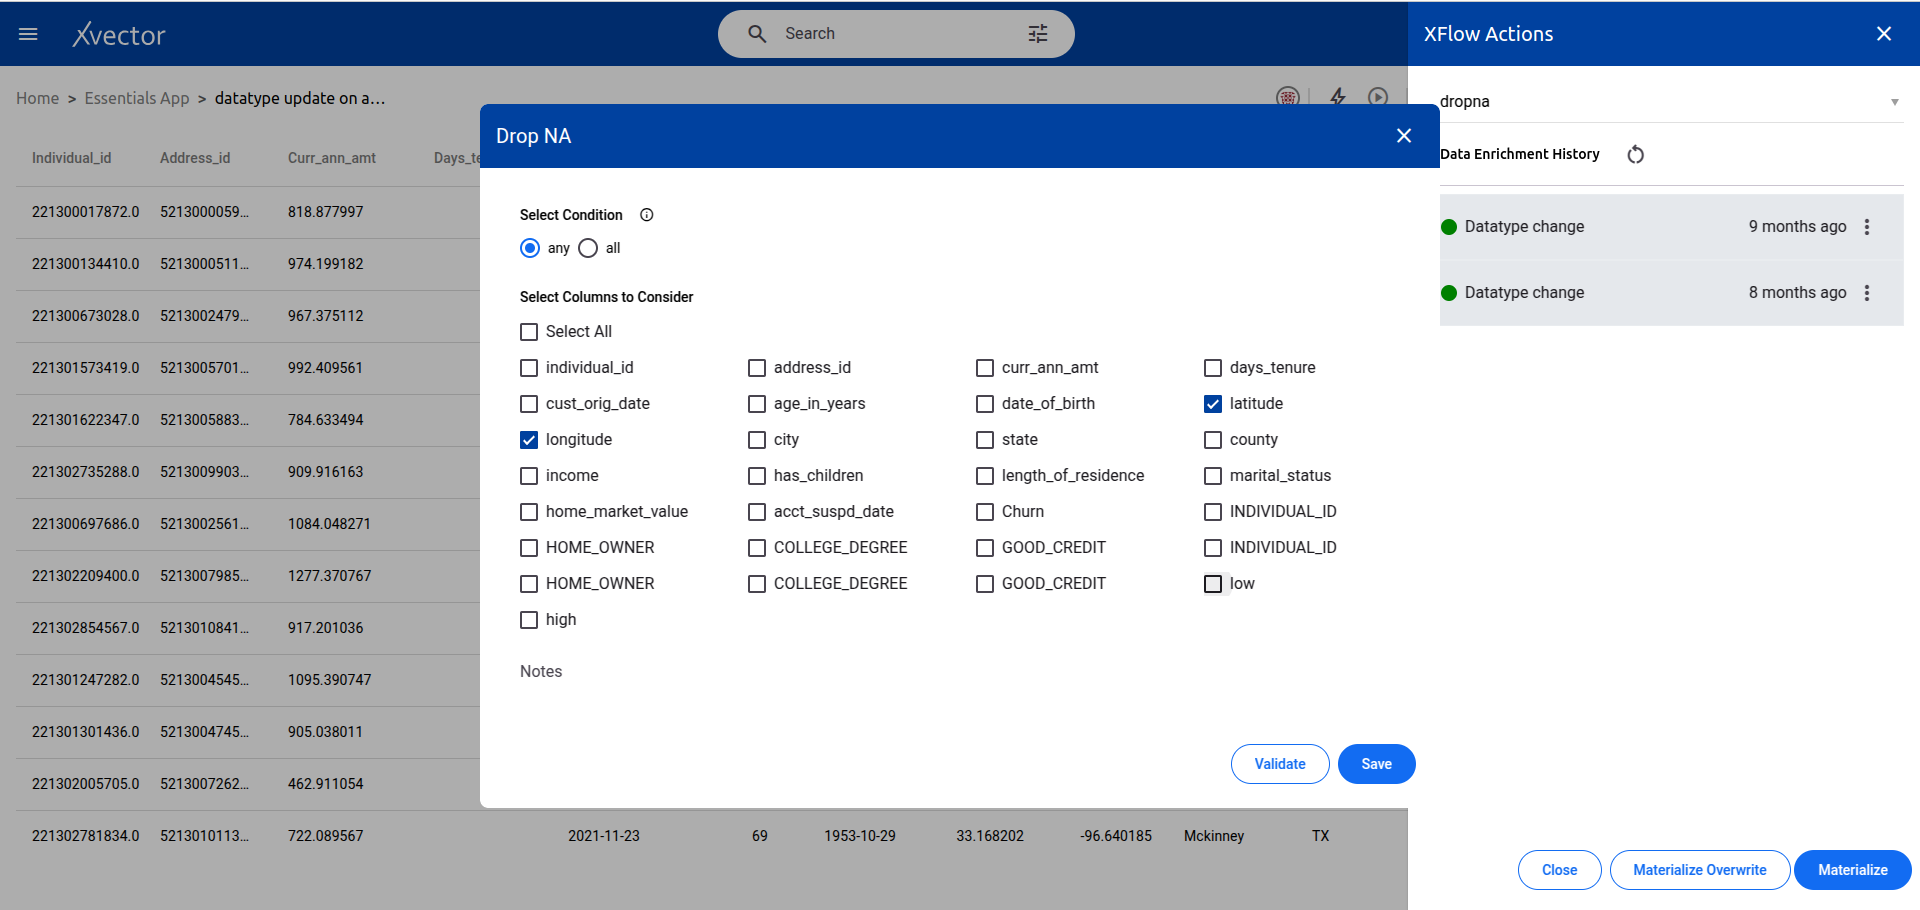
Dropna
Section titled “Dropna”Removes missing values (null/NaN) from the dataset. Configure which columns to check and the threshold for dropping rows.
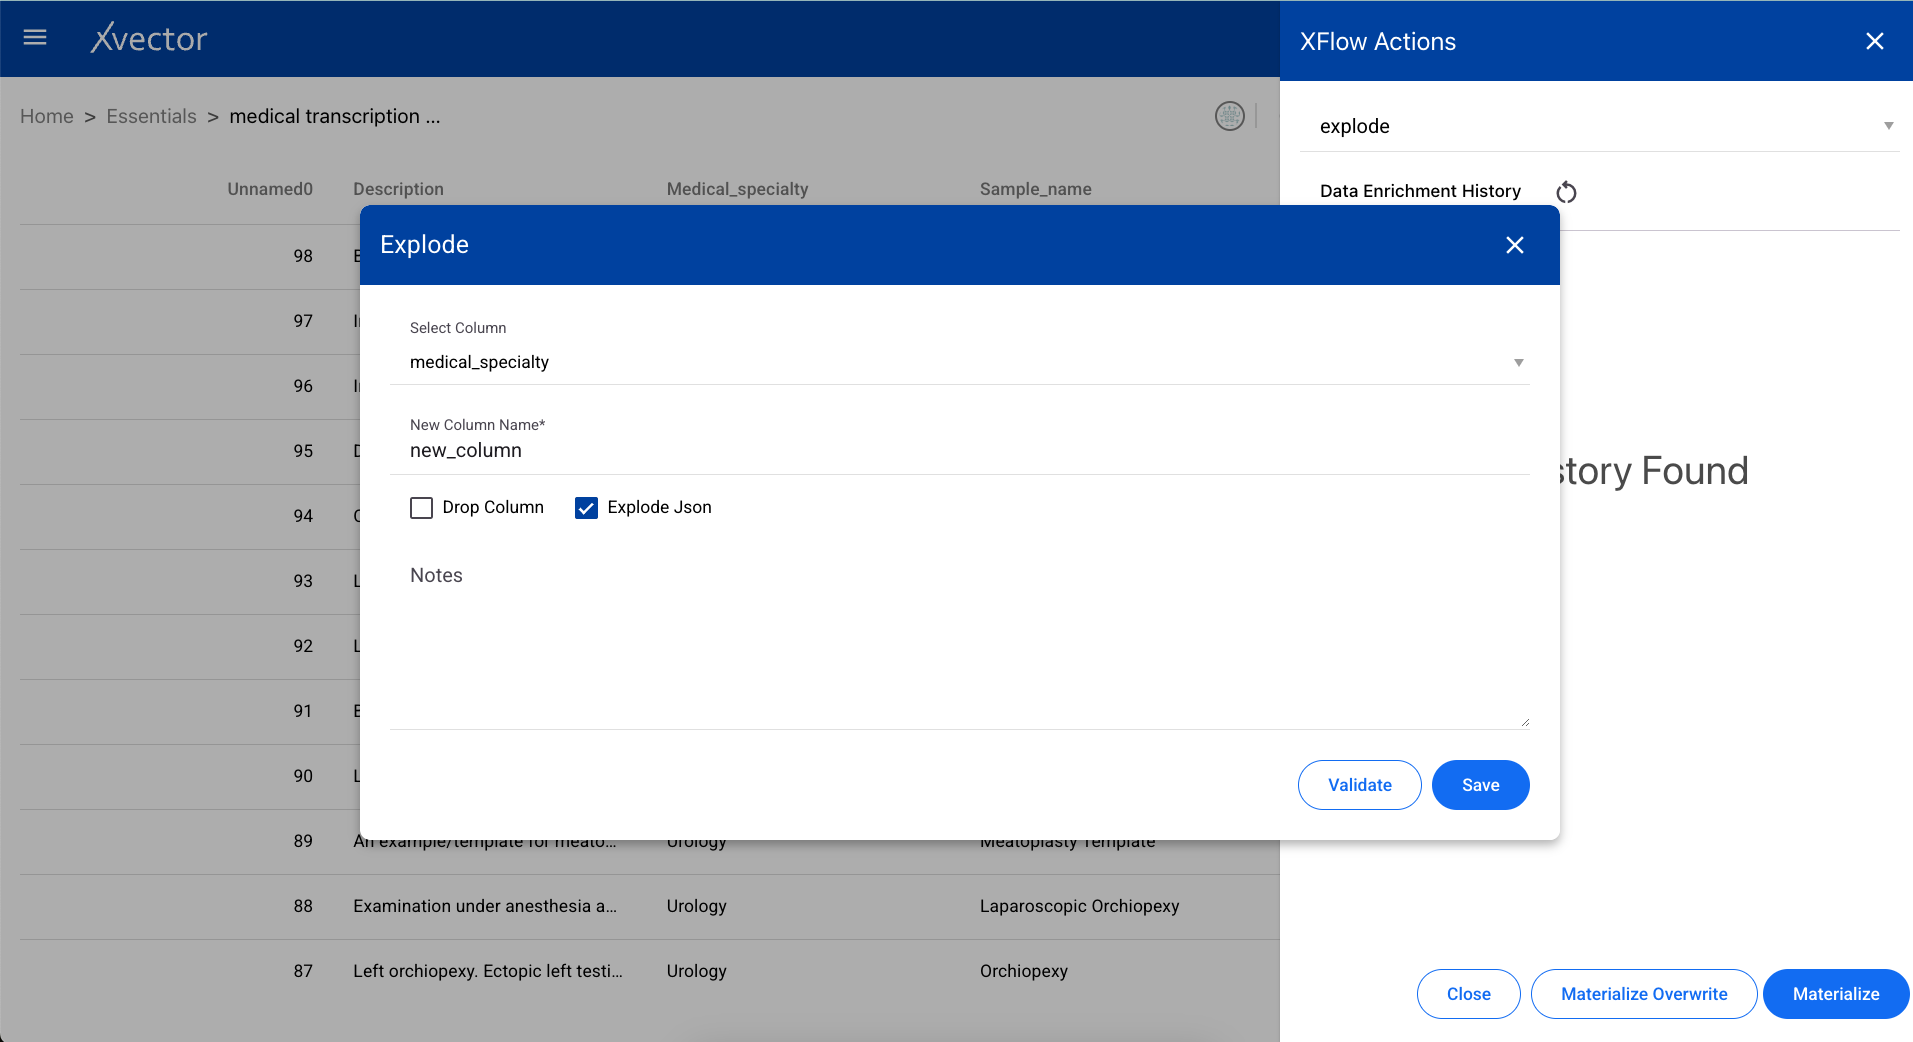
Explode
Section titled “Explode”Converts an array/list of items into separate rows. Useful when a column contains lists that need to be flattened into individual records.
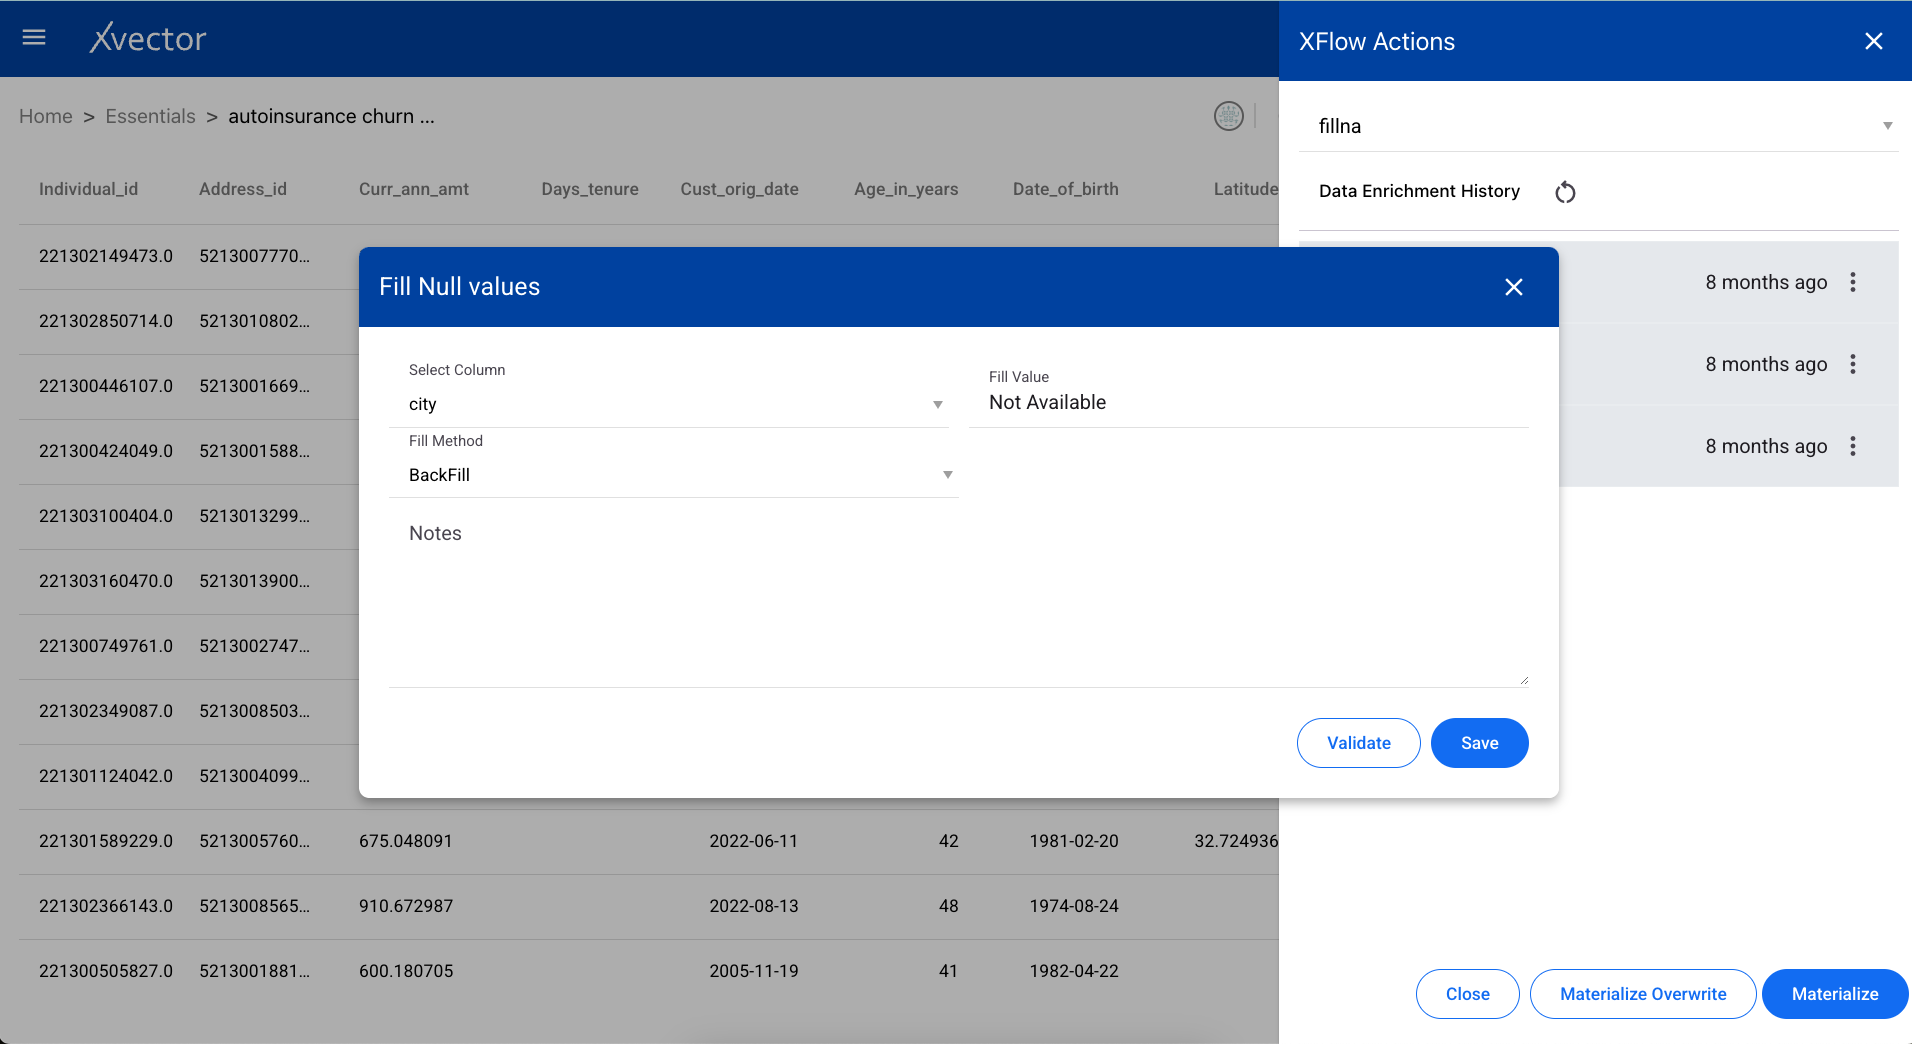
Fillna
Section titled “Fillna”Replaces null values in a dataset with a specified value. Configure the fill value per column or for the entire dataset.
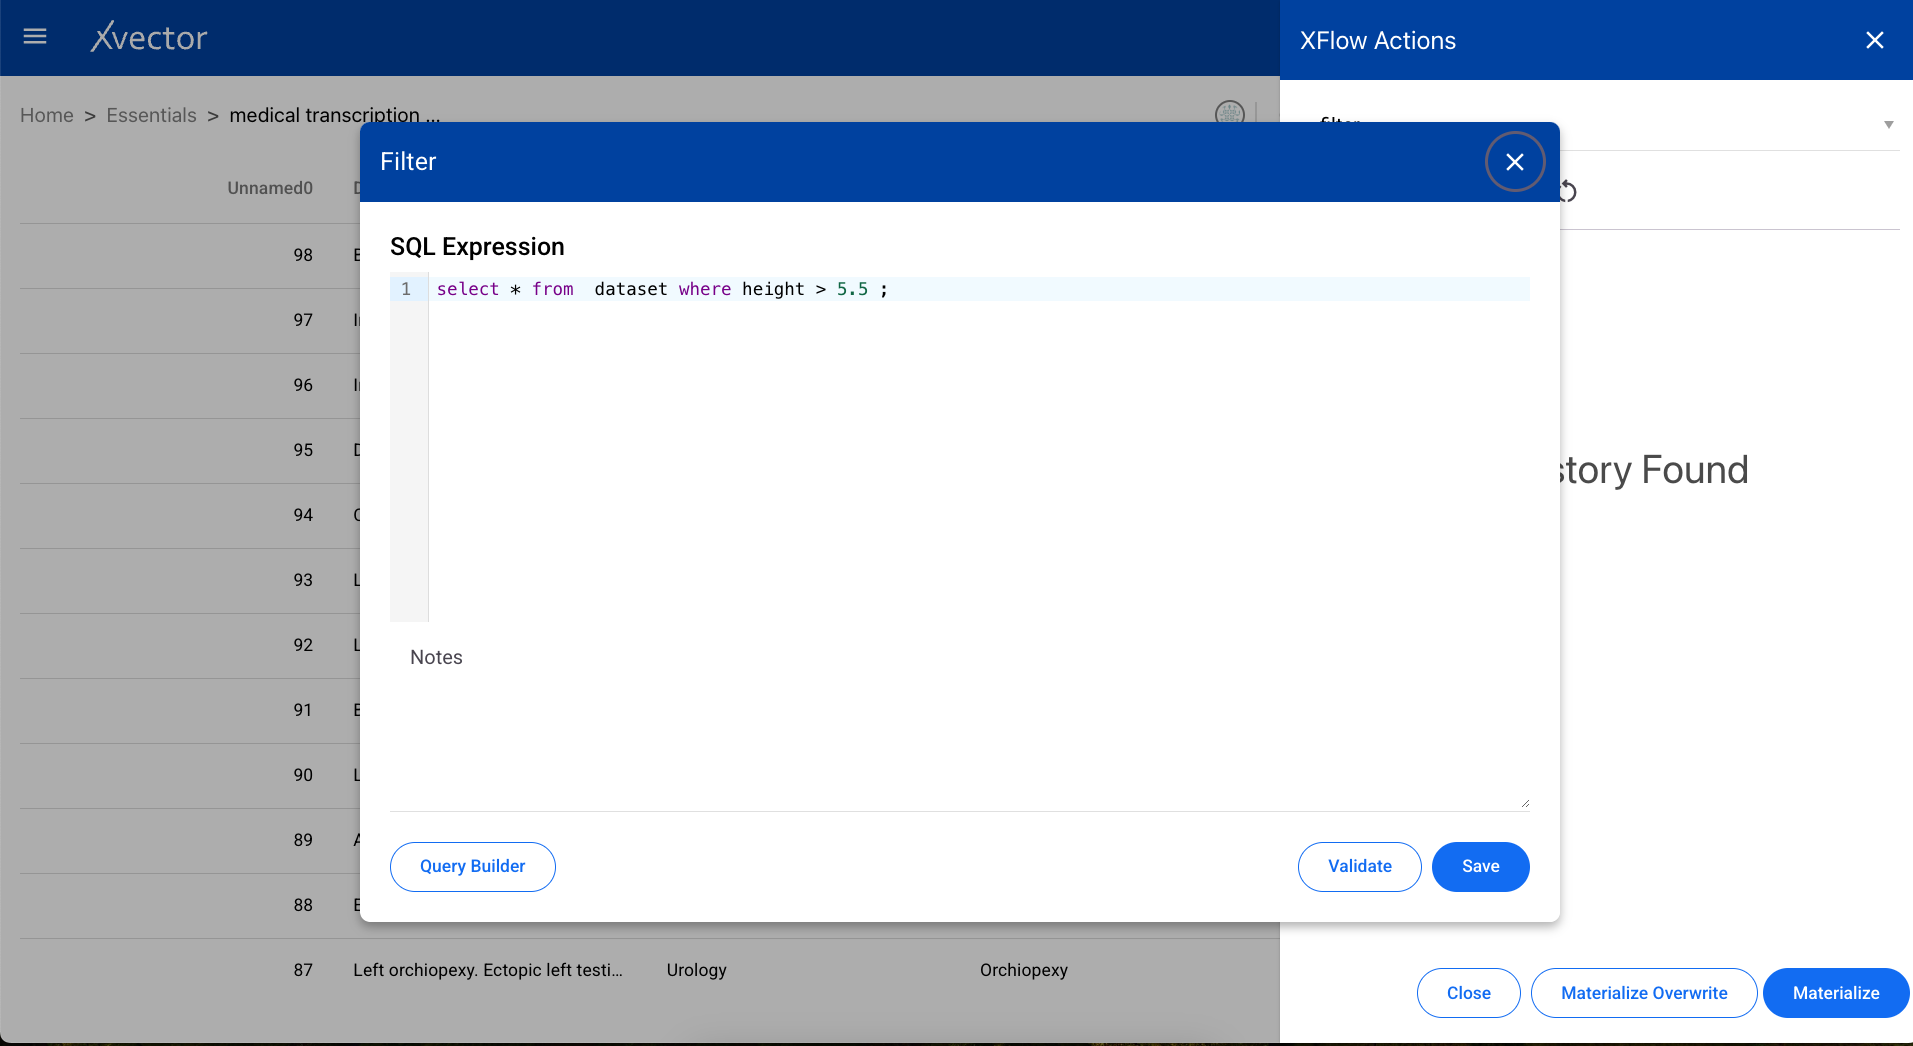
Filter
Section titled “Filter”Extracts specific data from a dataset based on conditions. Define the filter expression using column names, operators, and values.
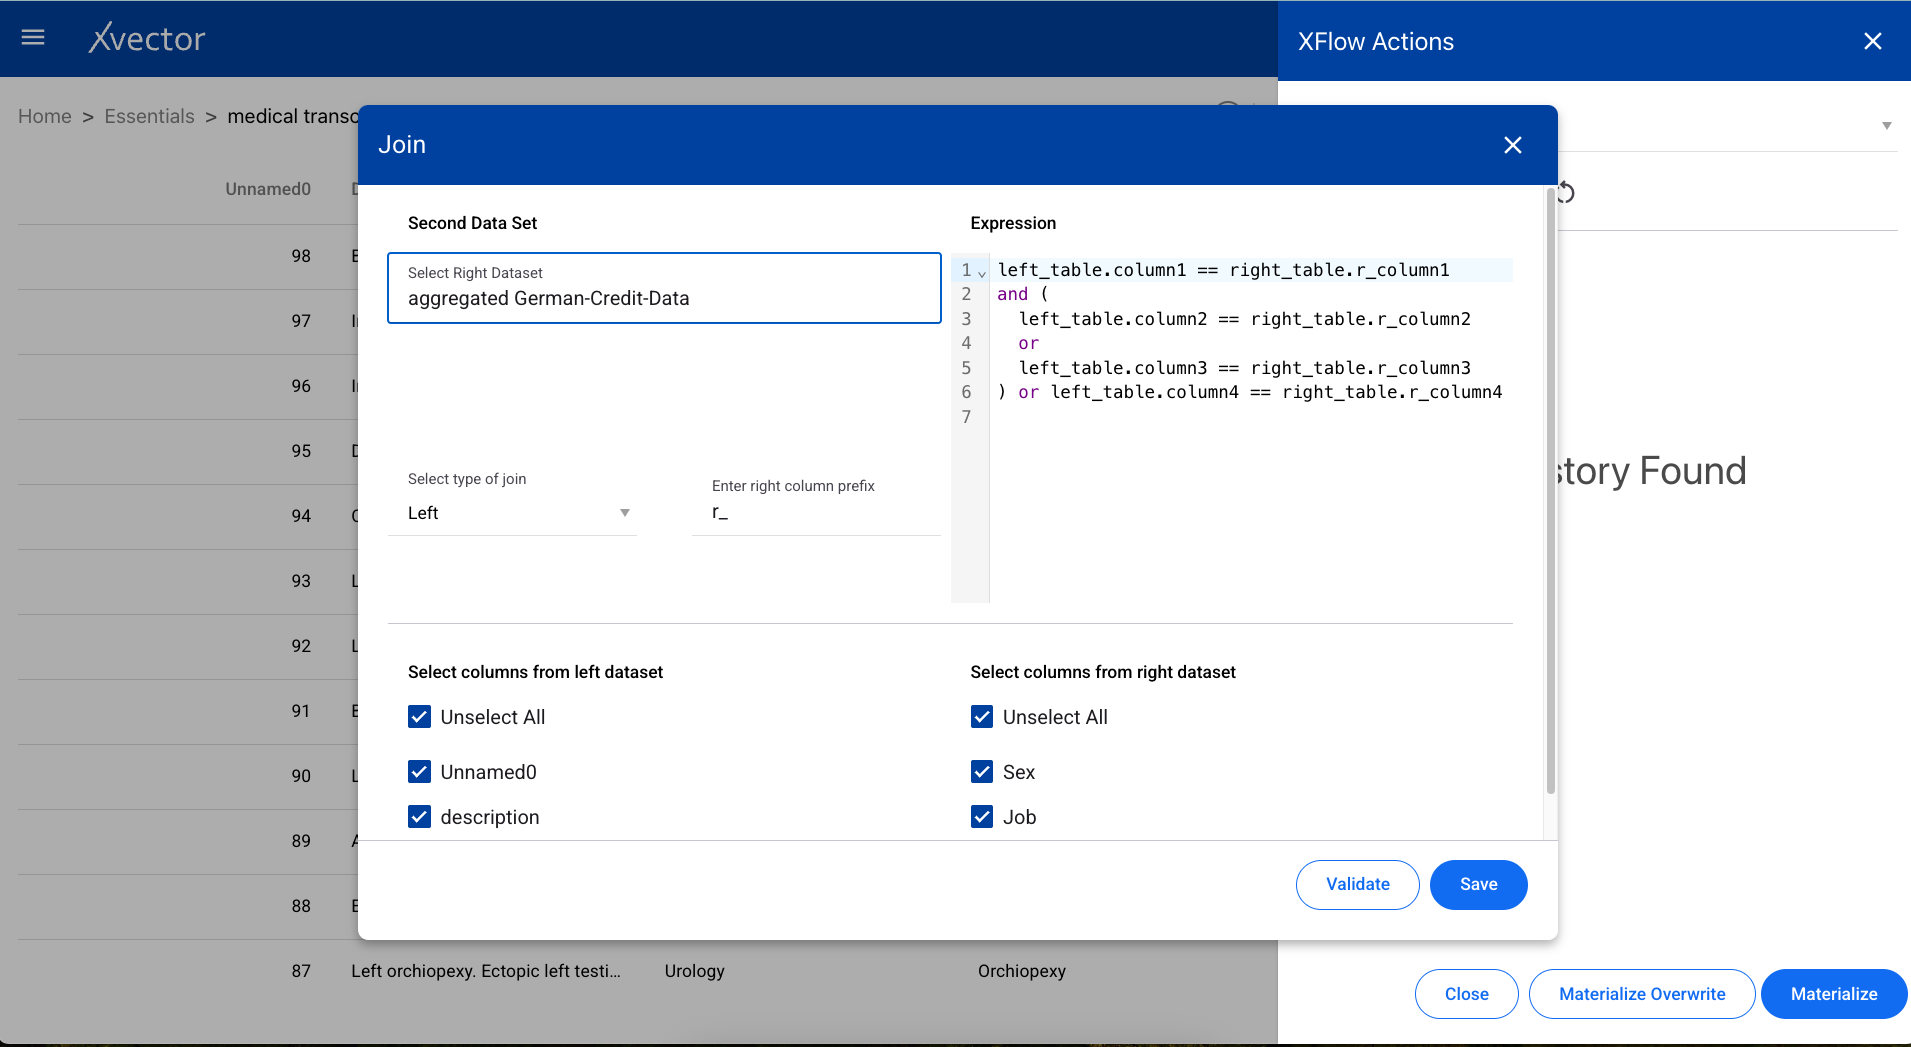
Joins two datasets based on a particular column. Select the join type (inner, left, right, outer), the target dataset, and the join keys.
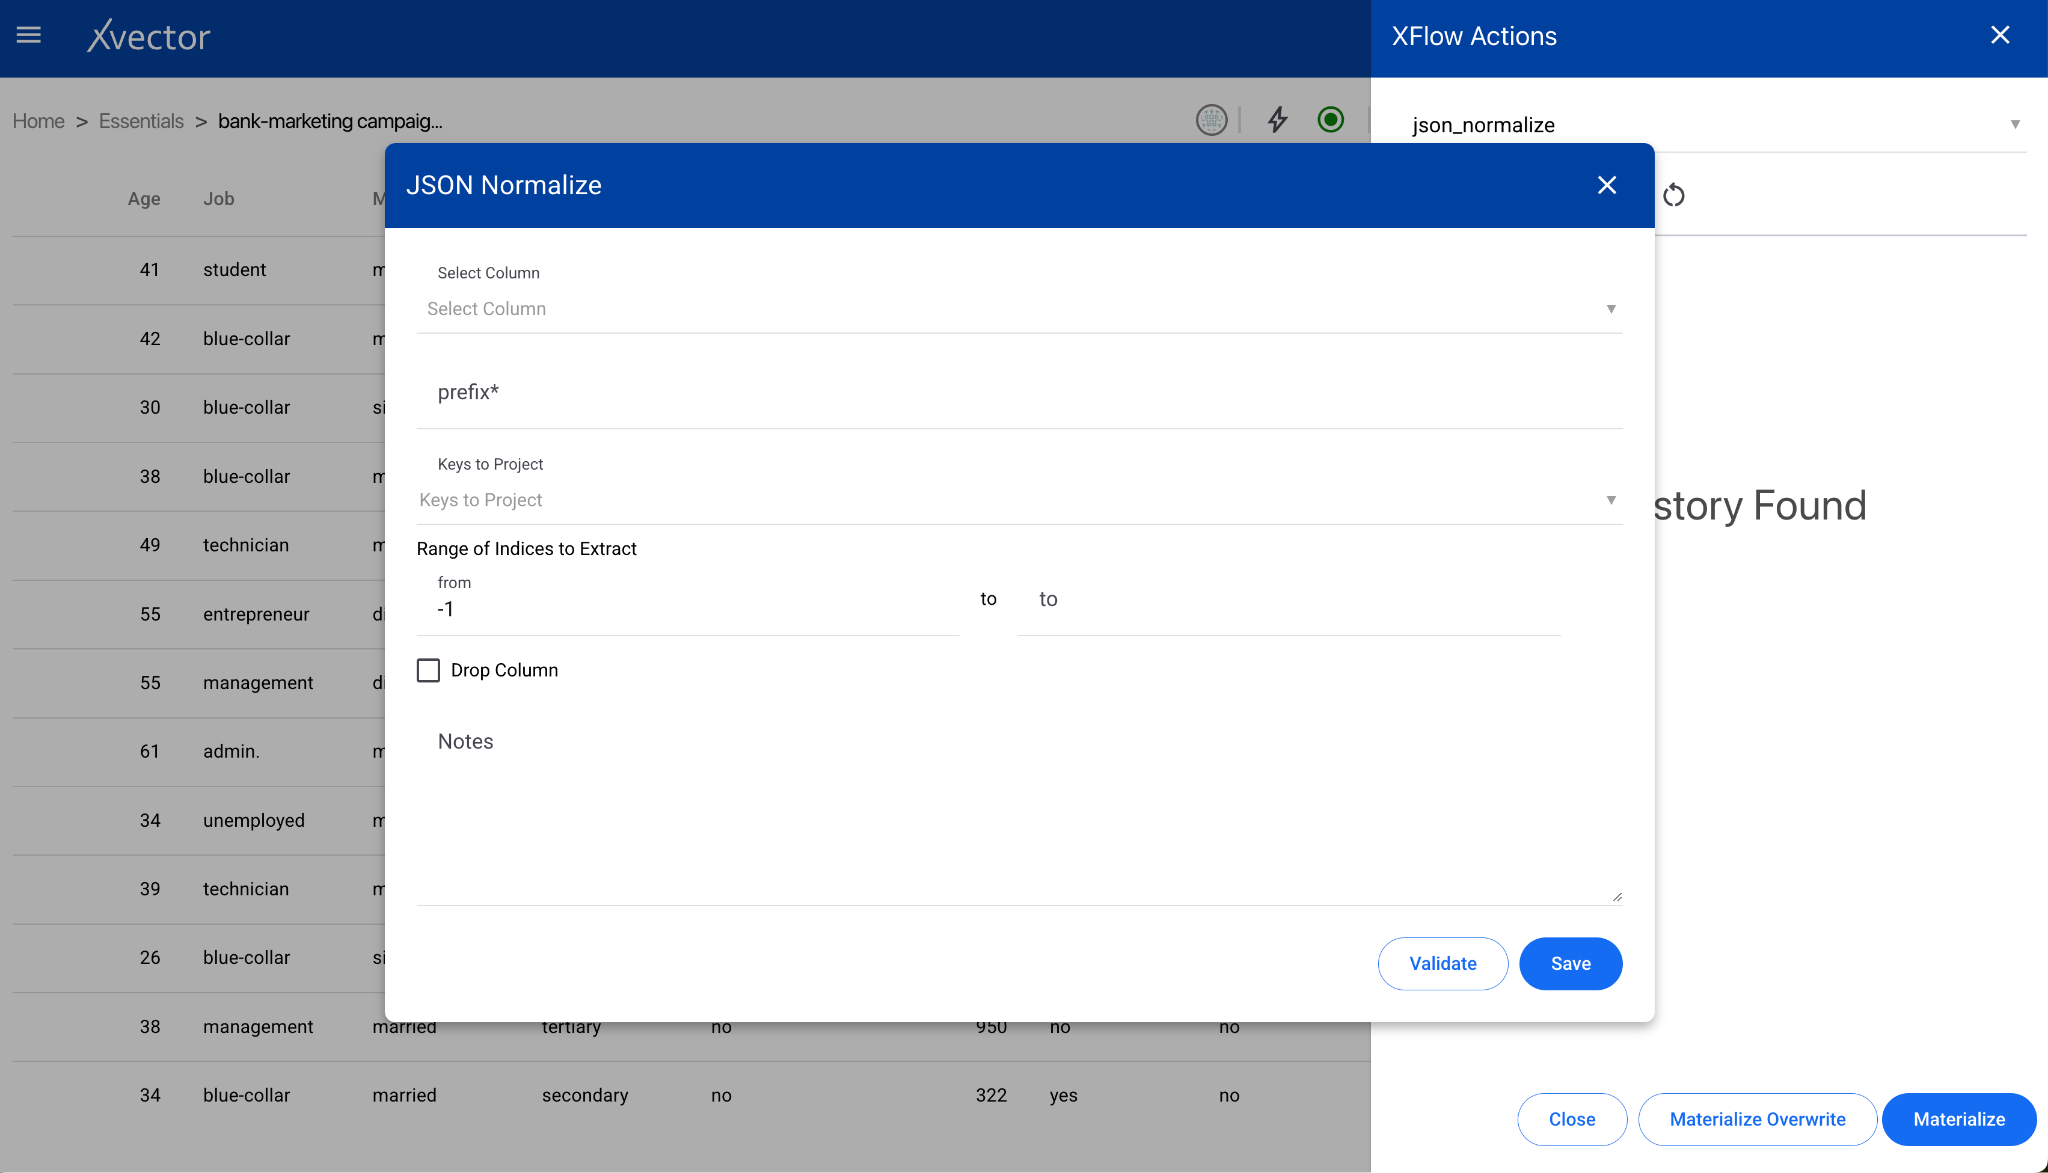
JSON Normalize
Section titled “JSON Normalize”Normalizes semi-structured JSON data into a flat table format.
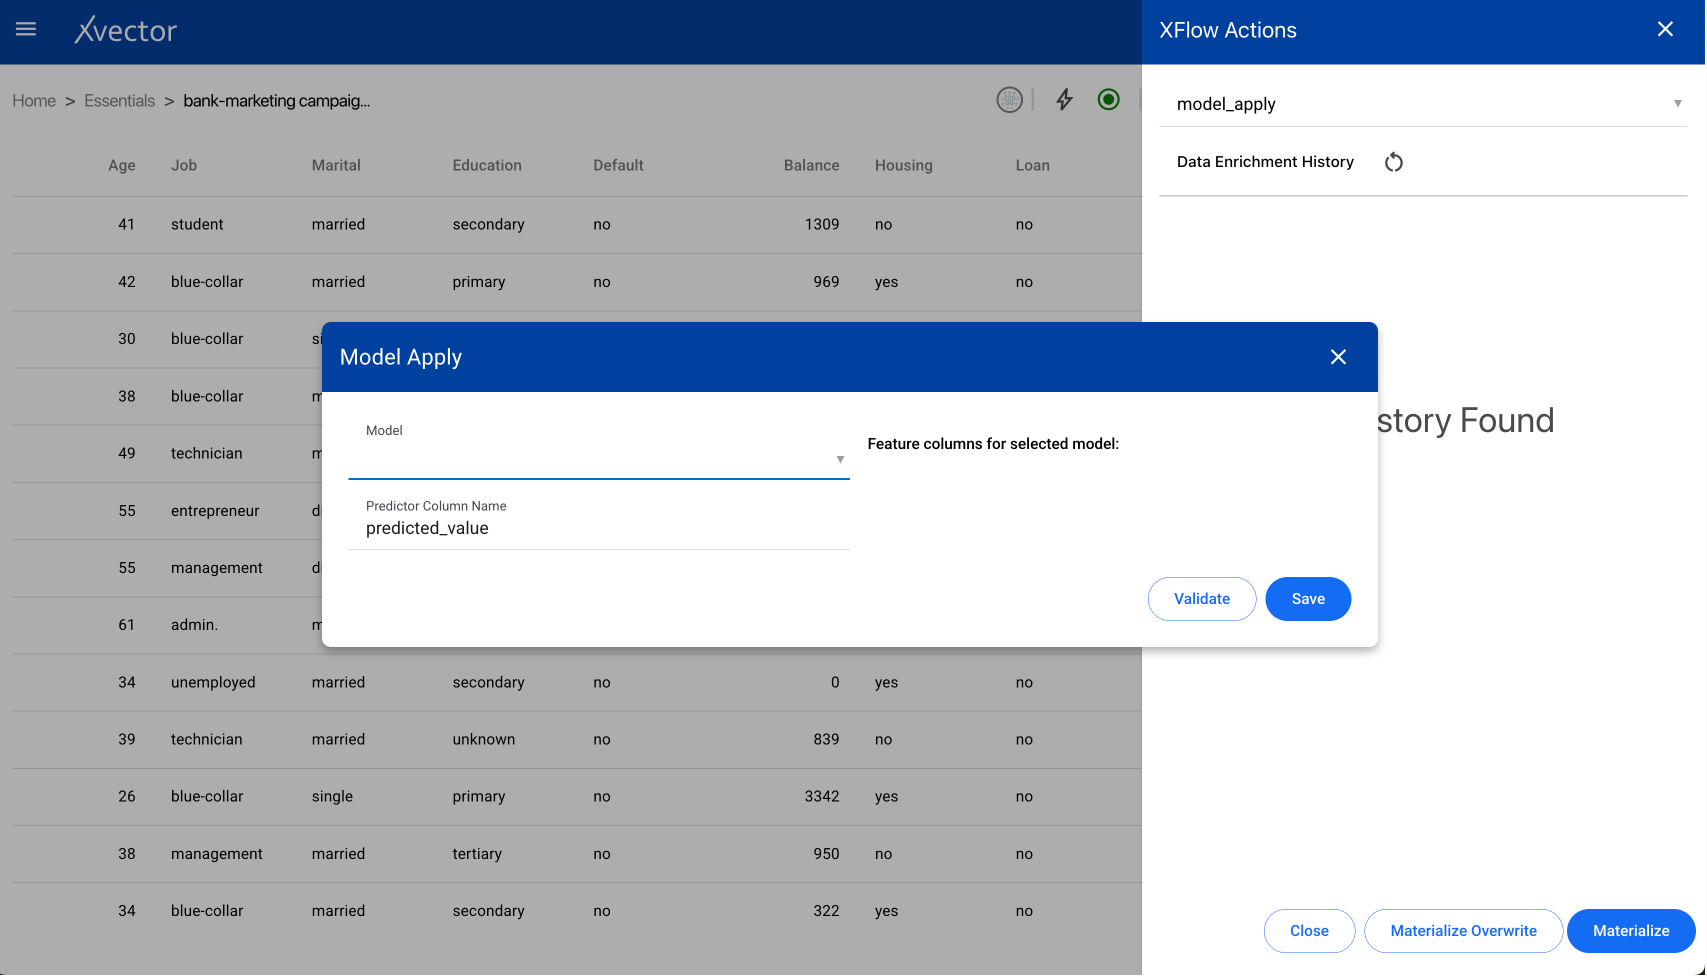
Model Apply
Section titled “Model Apply”Applies a trained model to the dataset to compute new columns. For example, apply a classifier to identify customers likely to churn from the latest order data.
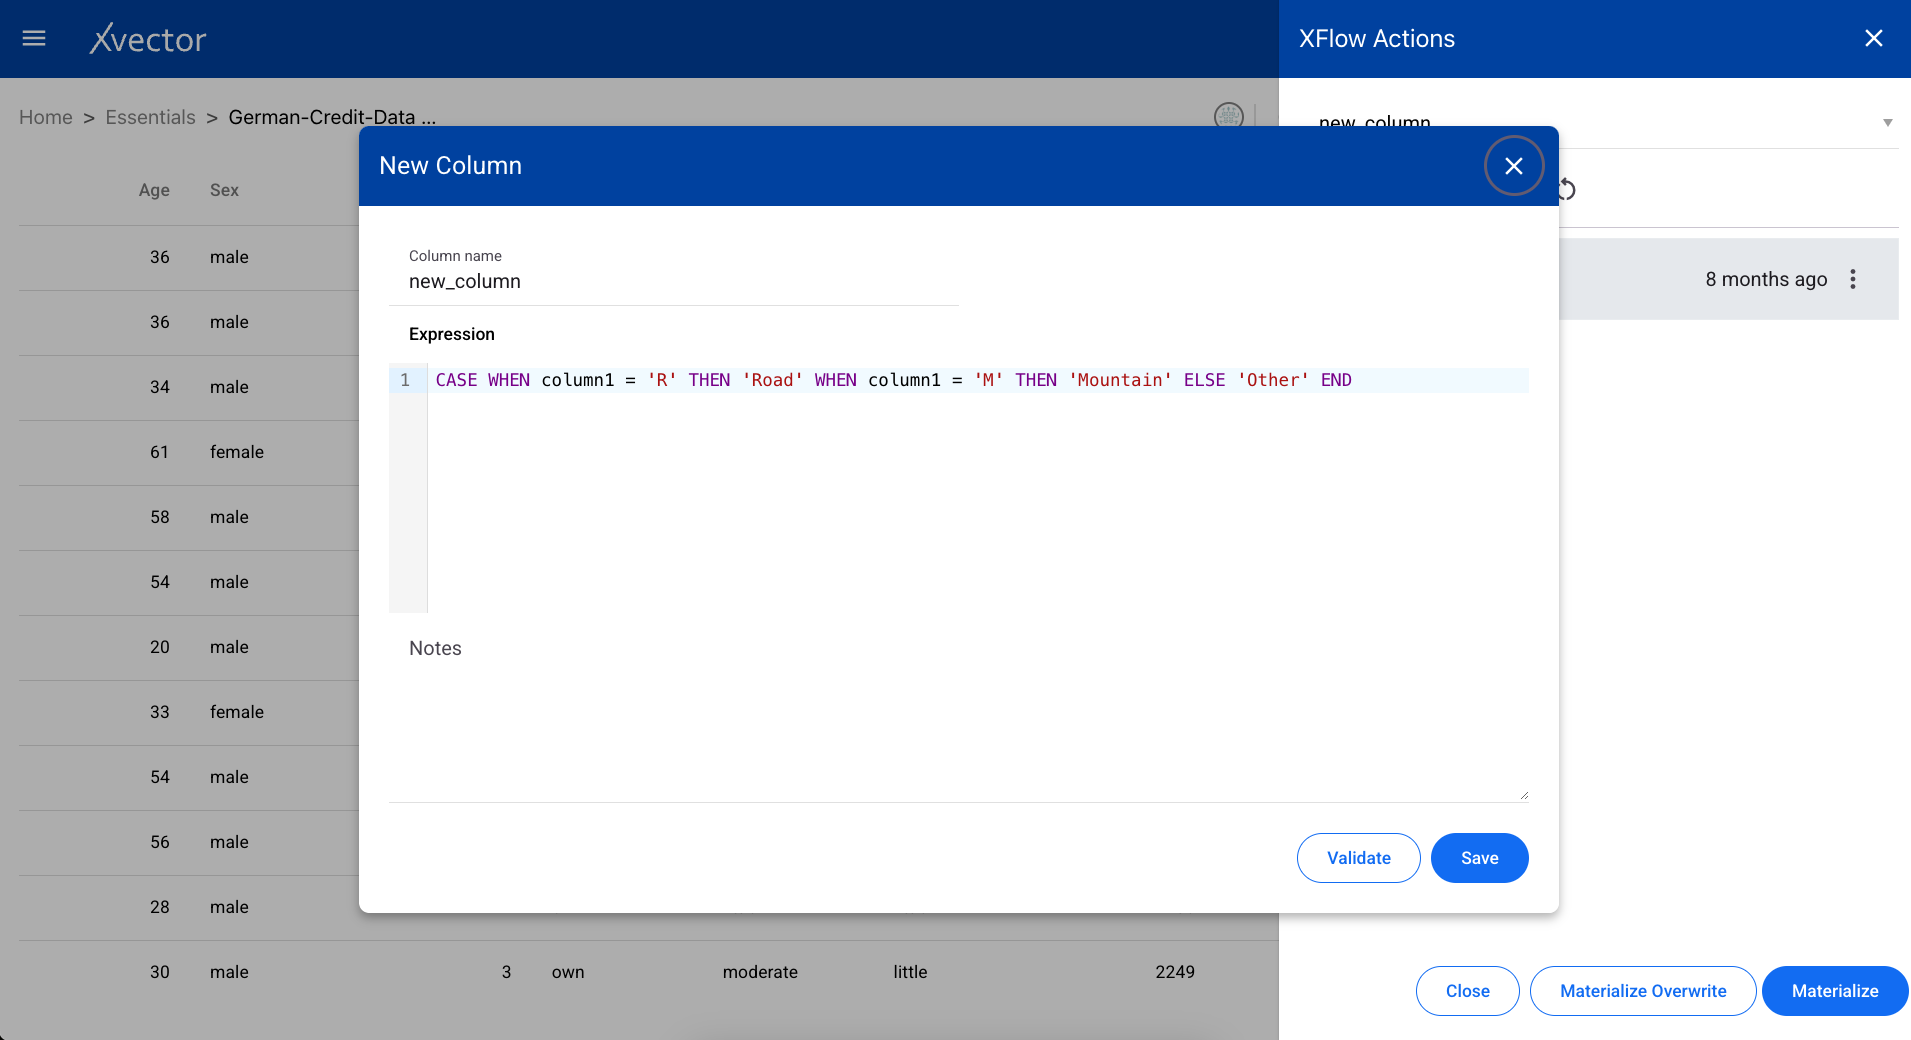
New Column
Section titled “New Column”Creates a new column in the dataset based on a provided expression. Define the column name, data type, and the expression to compute its values.
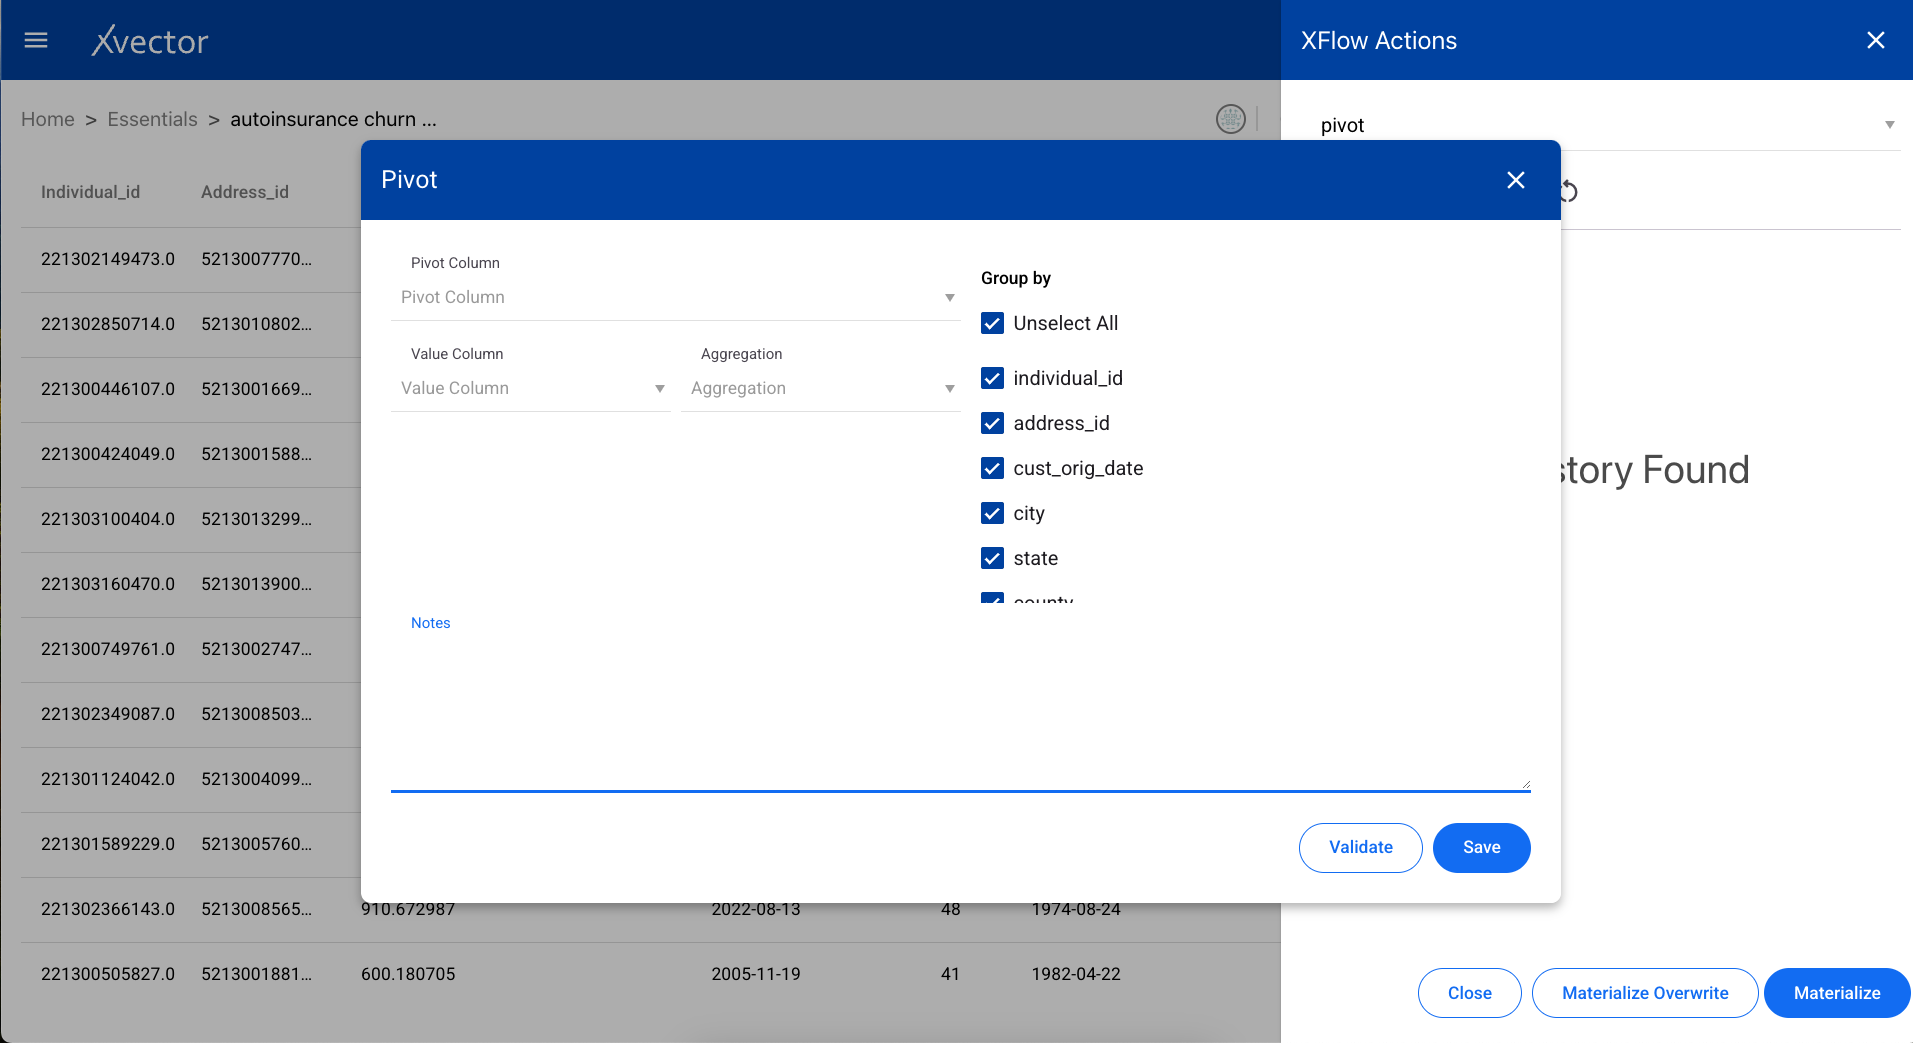
A data transformation tool used to reorganize data from a long format to a wide format. Select the index columns, pivot columns, and aggregation functions.
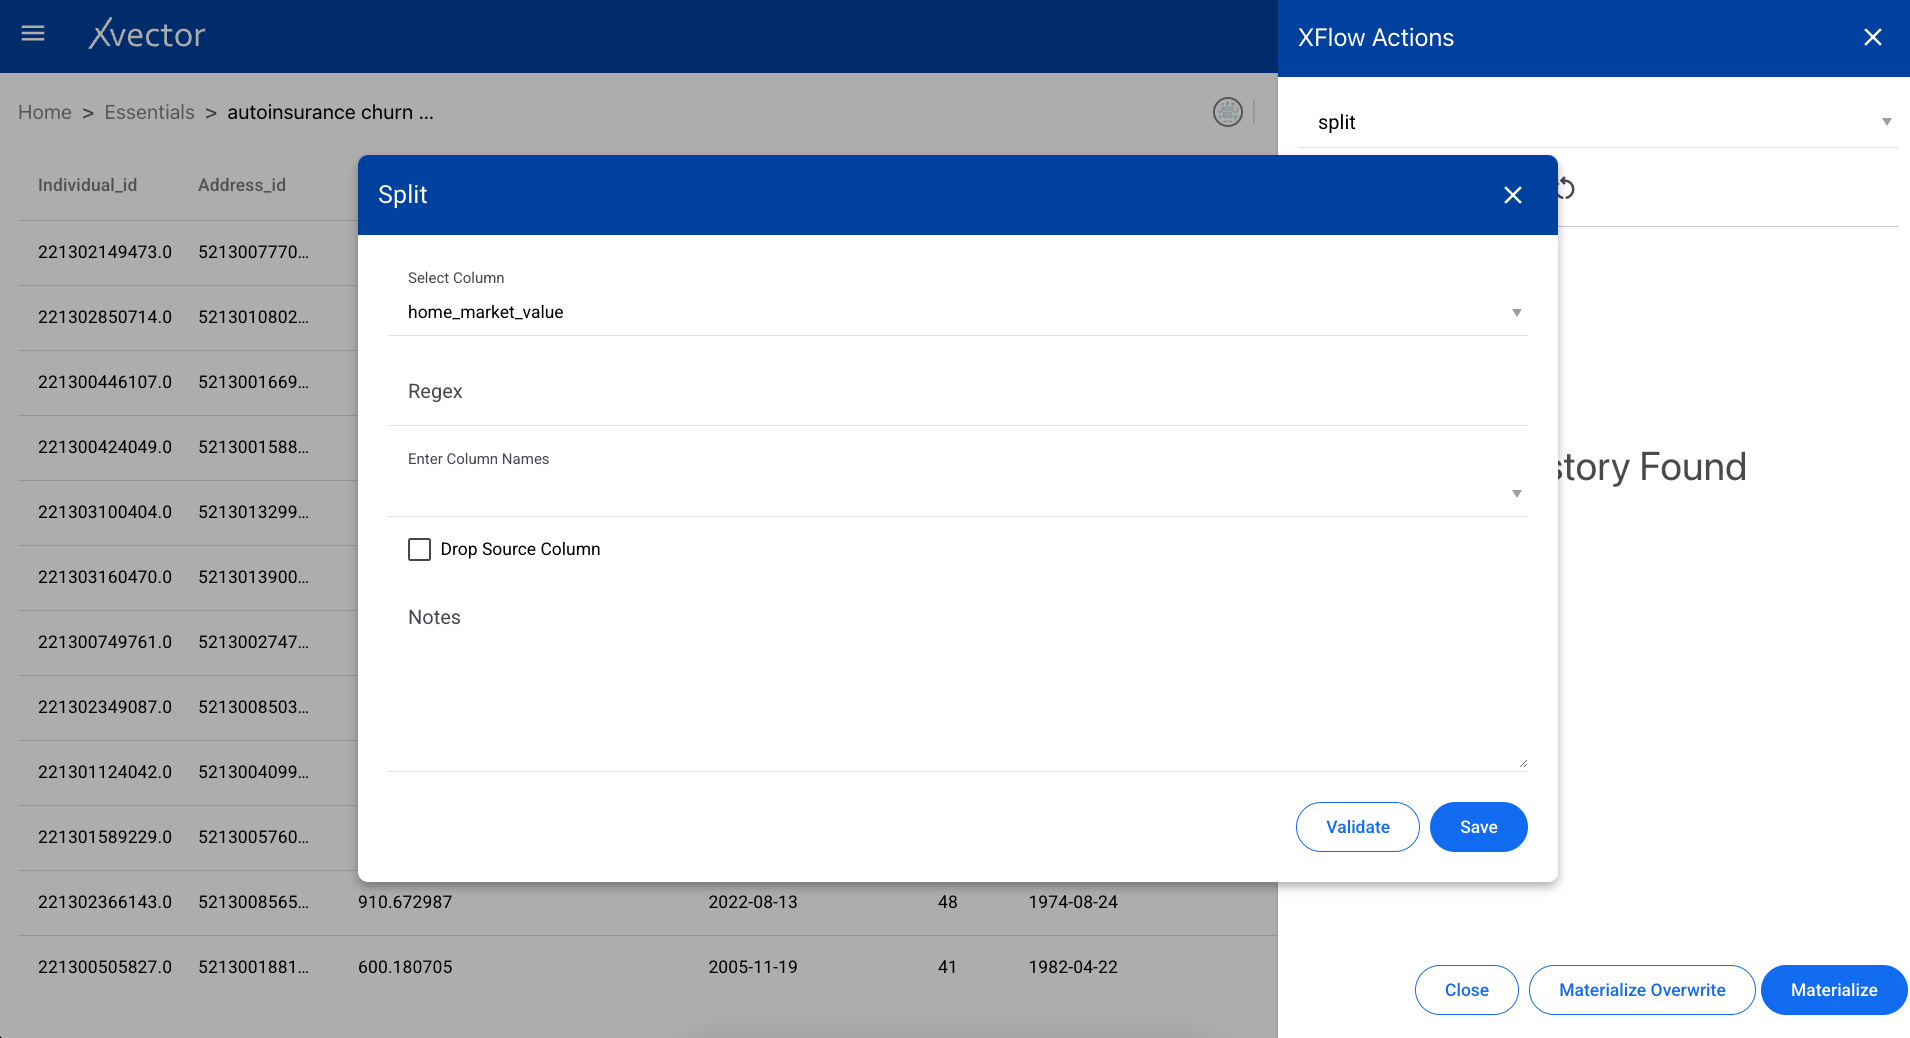
Splits string-type columns based on a delimiter into separate columns.
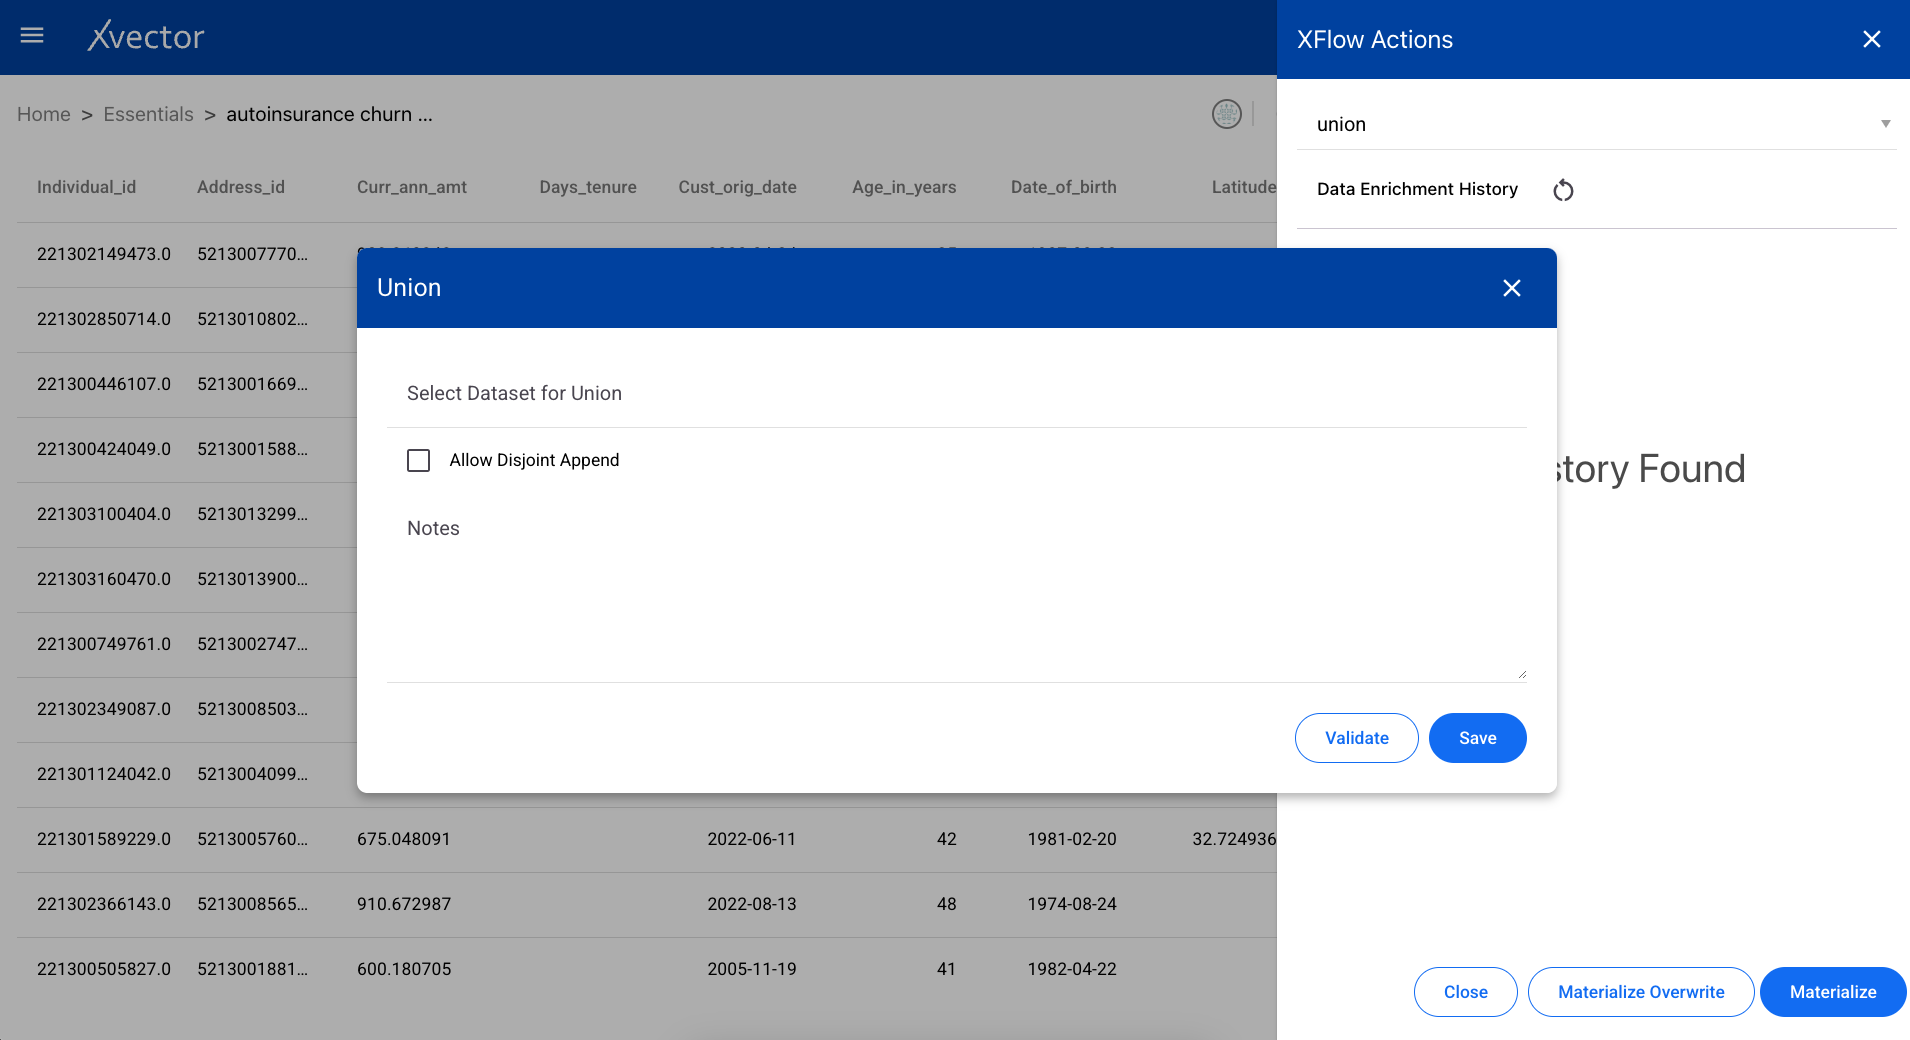
Adds rows from another dataset to the current dataset. The schemas must be compatible.
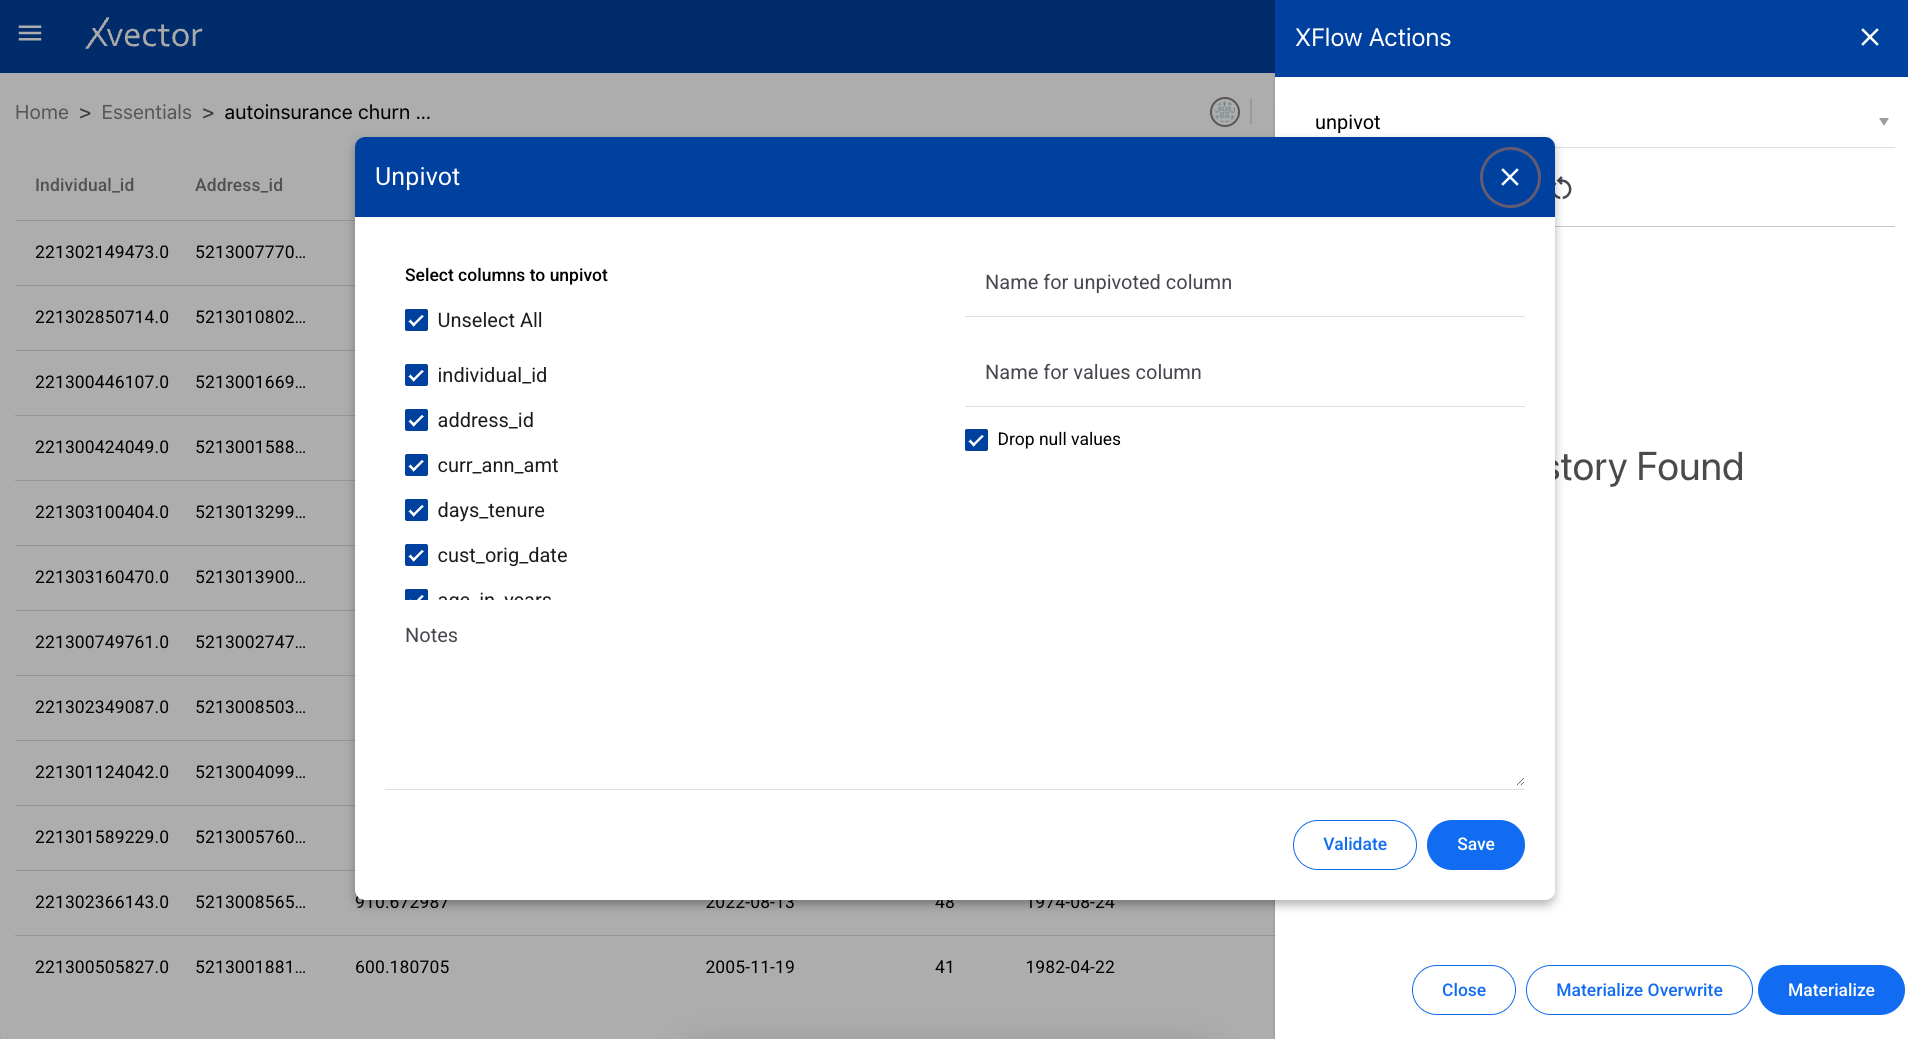
Unpivot
Section titled “Unpivot”A data transformation tool used to reorganize data from a wide format to a long format — the reverse of pivot.
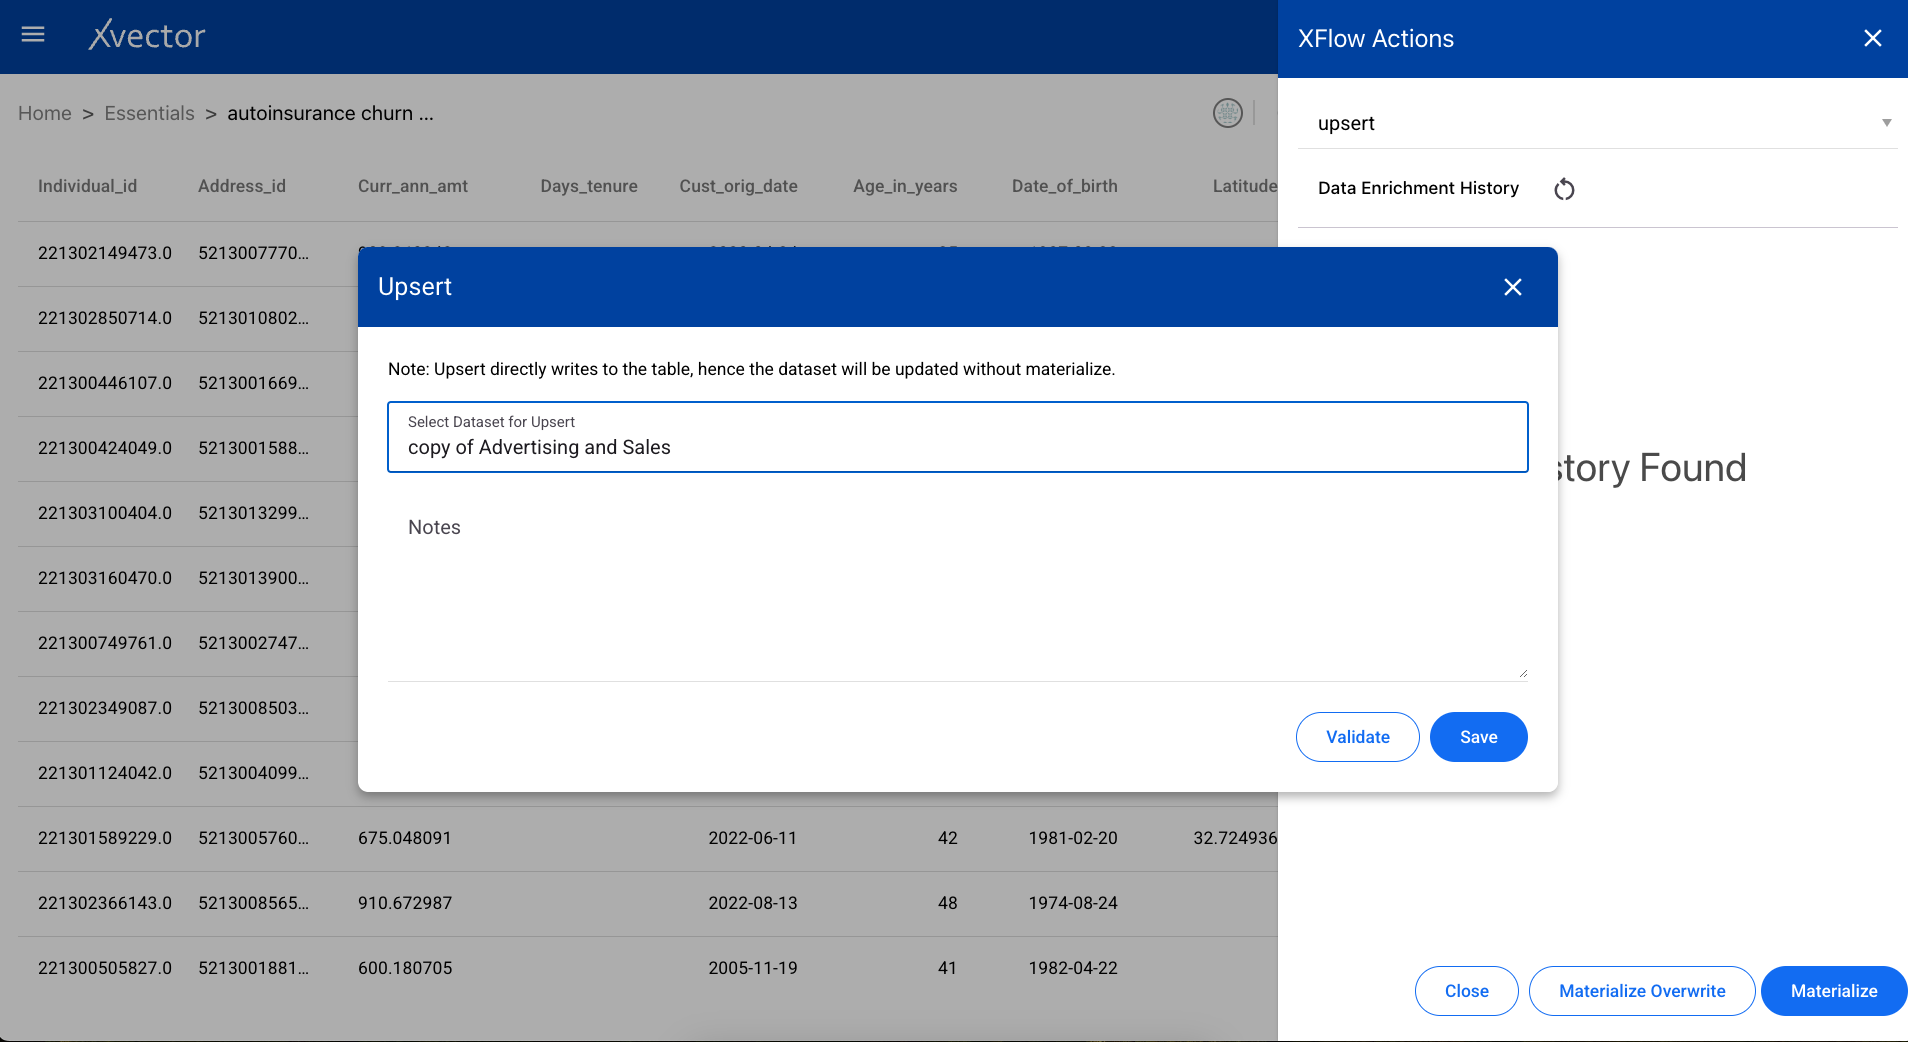
Upsert
Section titled “Upsert”Adds rows that are not duplicates to the dataset. Existing rows matching on the key columns are updated with the new values.
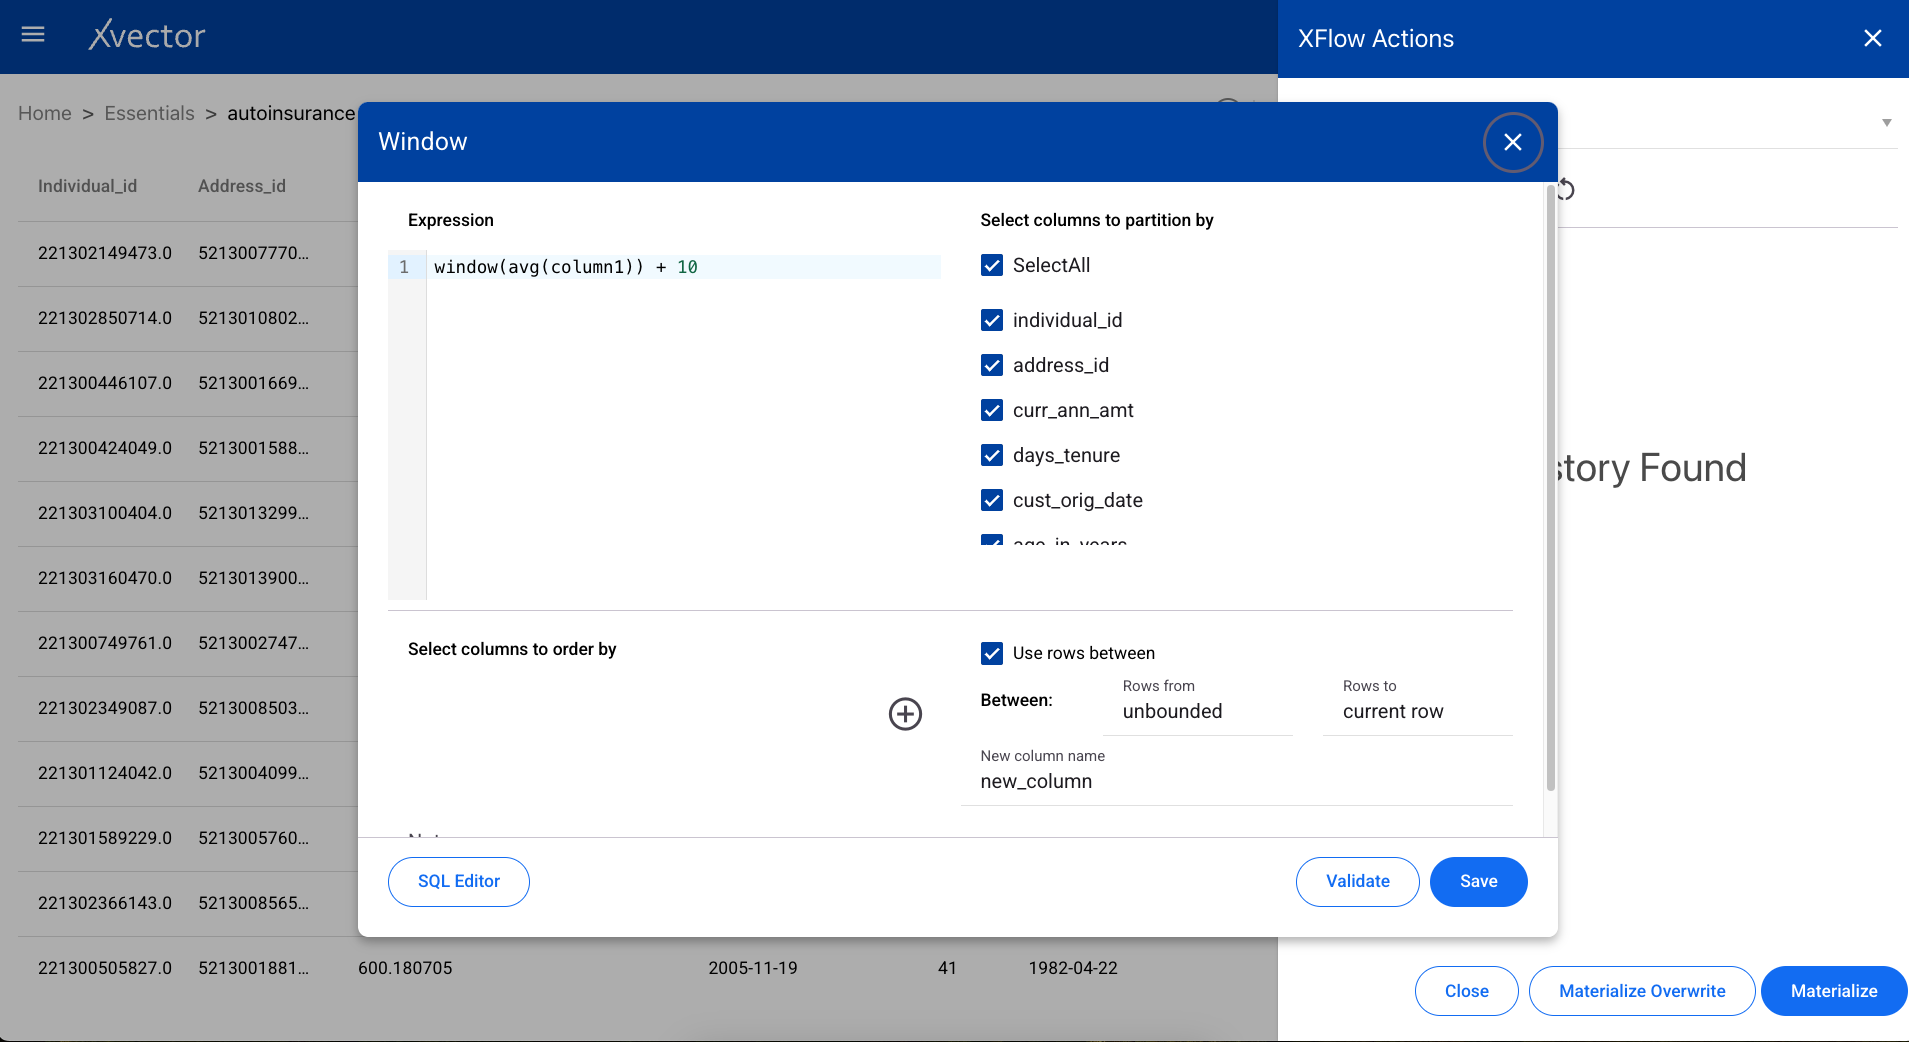
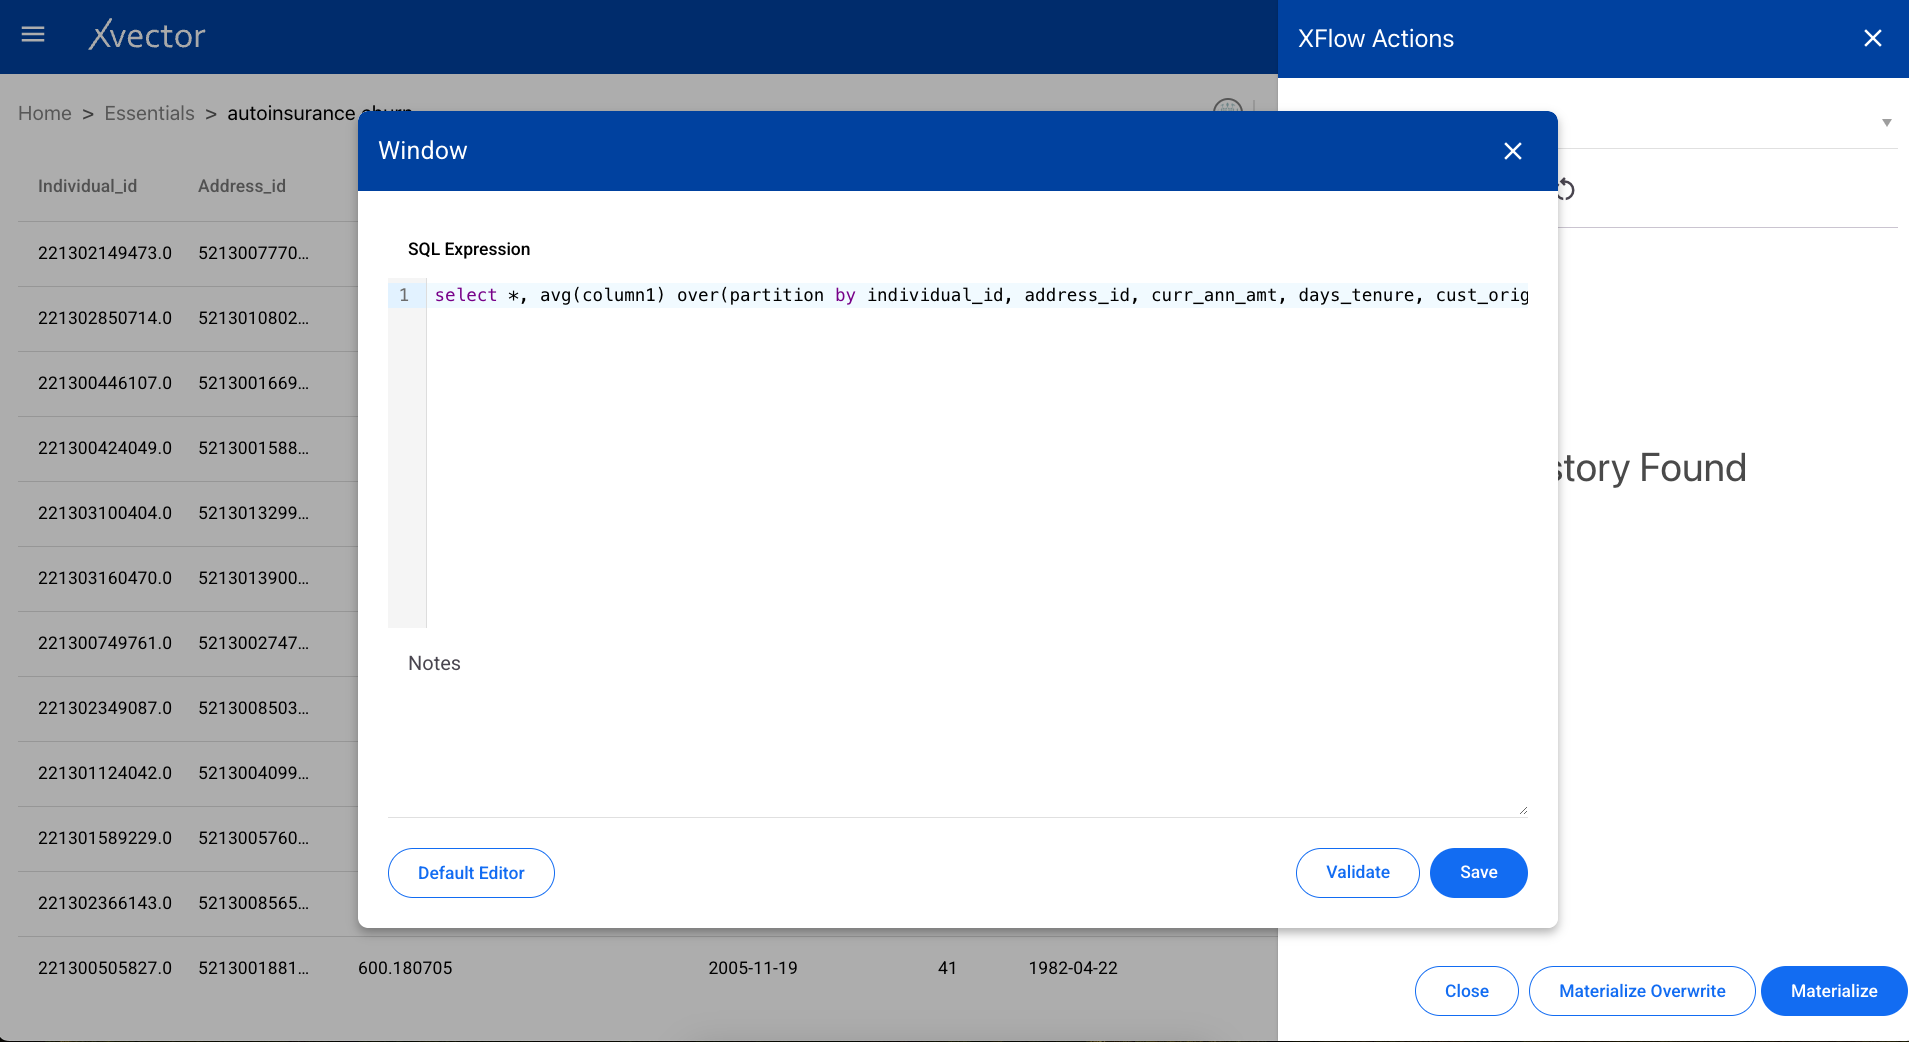
Window
Section titled “Window”Performs statistical operations such as rank, row number, and cumulative aggregations over a window of rows defined by partition and ordering columns.
SQL Editor
Section titled “SQL Editor”Use the SQL editor to write your own queries against the dataset.
Common Options
Section titled “Common Options”The following options are common across enrichment functions:
- Validate — Validates the provided input expression and configuration. It is recommended to run validate first, verify the inputs, and update if required.
- Save — Runs the selected actions and saves the configuration. Saving does not result in actual data being created; it only saves the logic of applied transformations. To create actual data, you must materialize the dataset.
- Materialize — Persists the data. Available at the bottom of the xflow-action tab (accessible via the sigma icon Σ).
- Materialize Overwrite — Creates a new dataset and persists. Overwrites and recreates the data, deleting the older version. Recommended when schema changes occur.
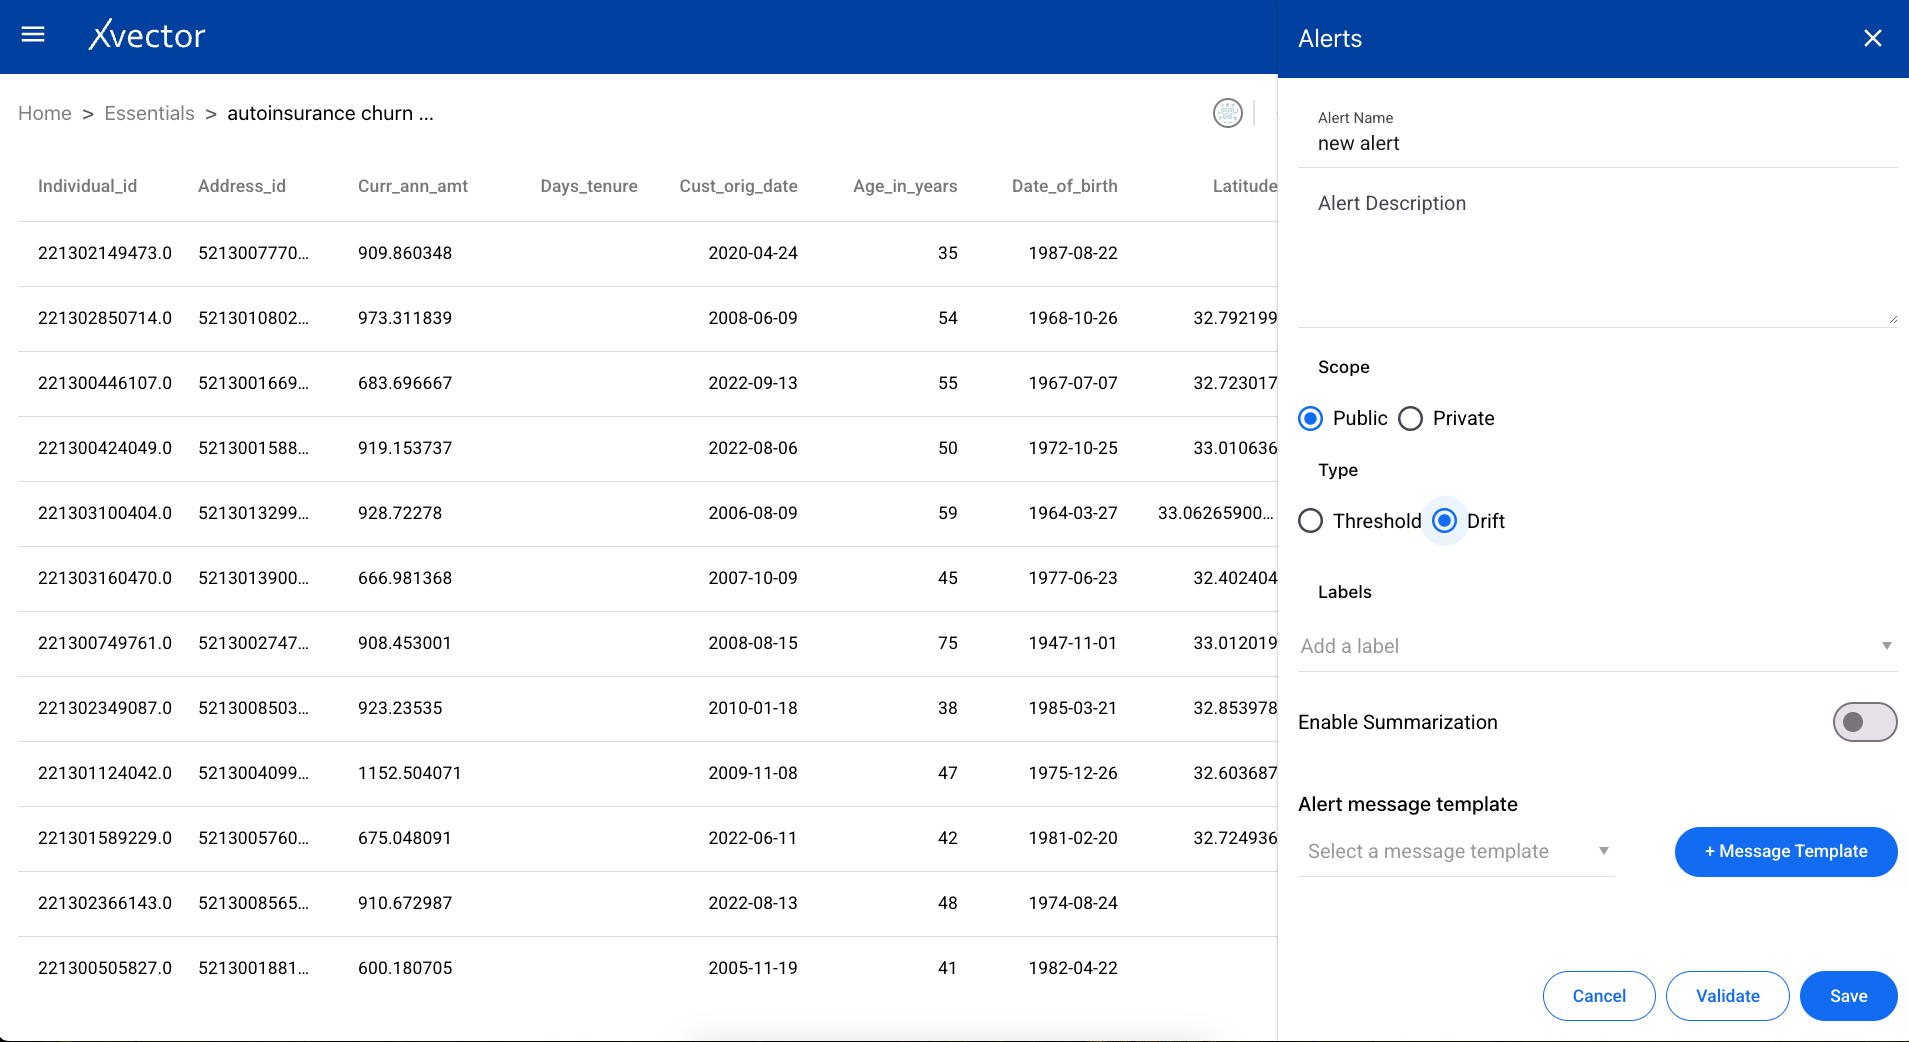
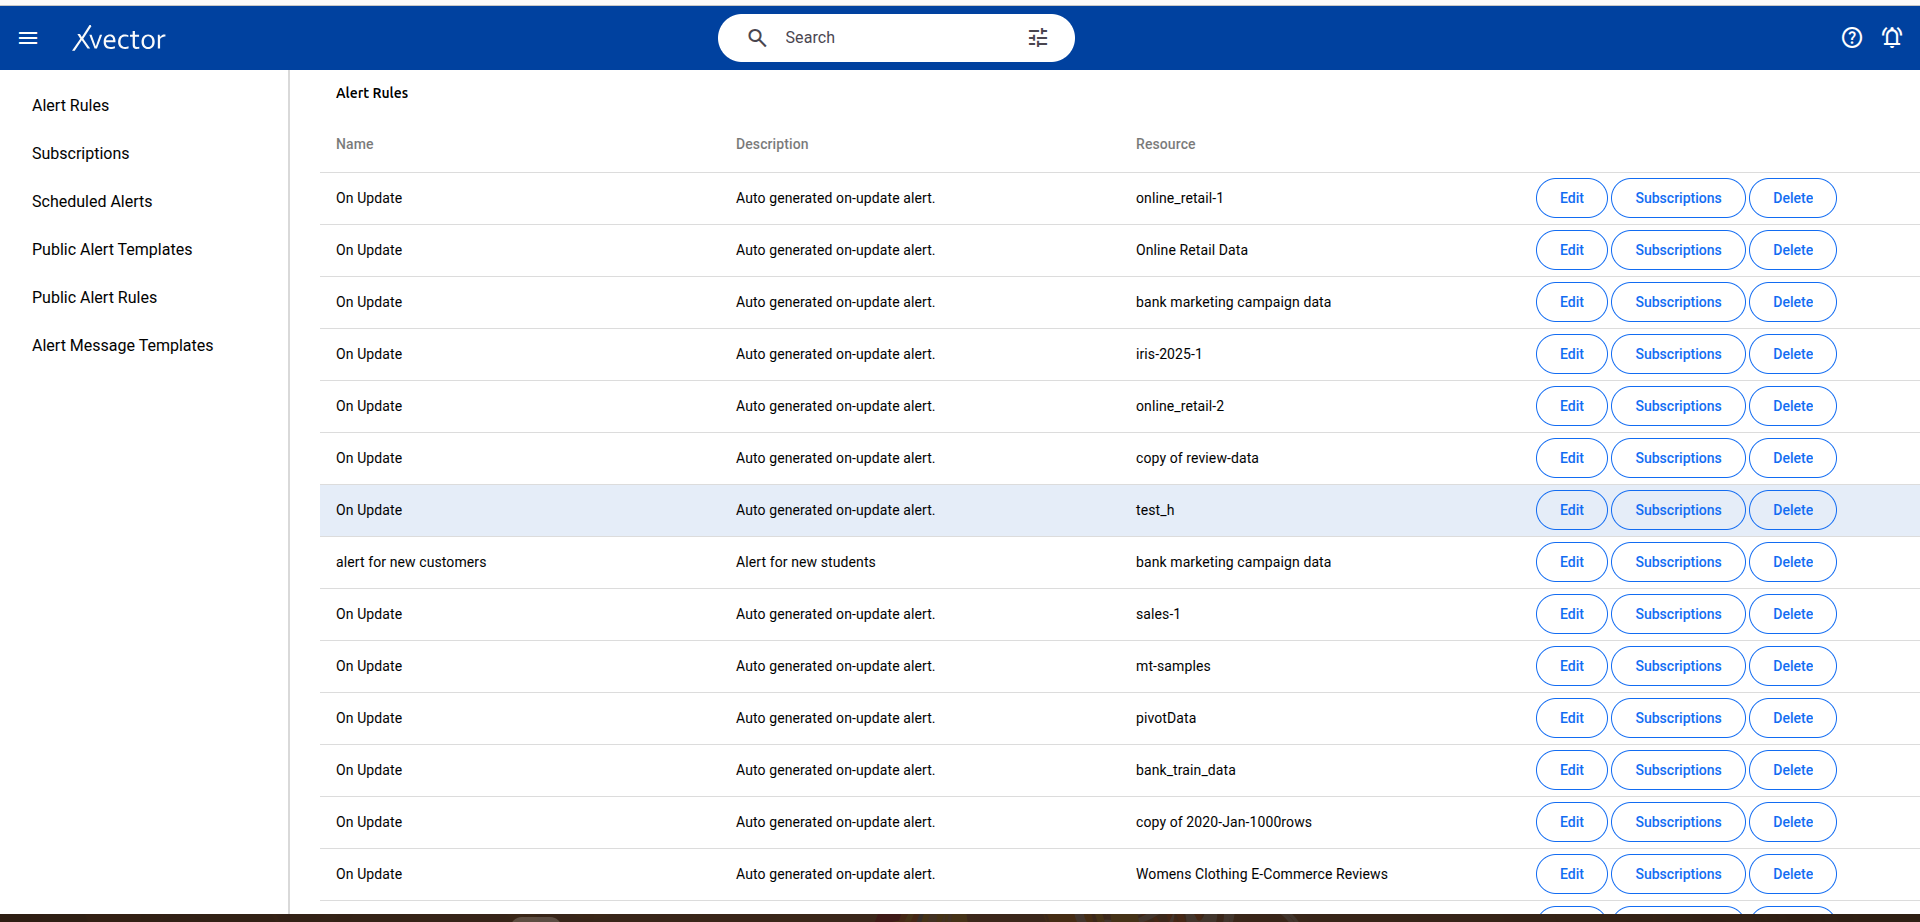
Alerts
Section titled “Alerts”Users can set up alerts based on rules for thresholds or drifts.
Threshold
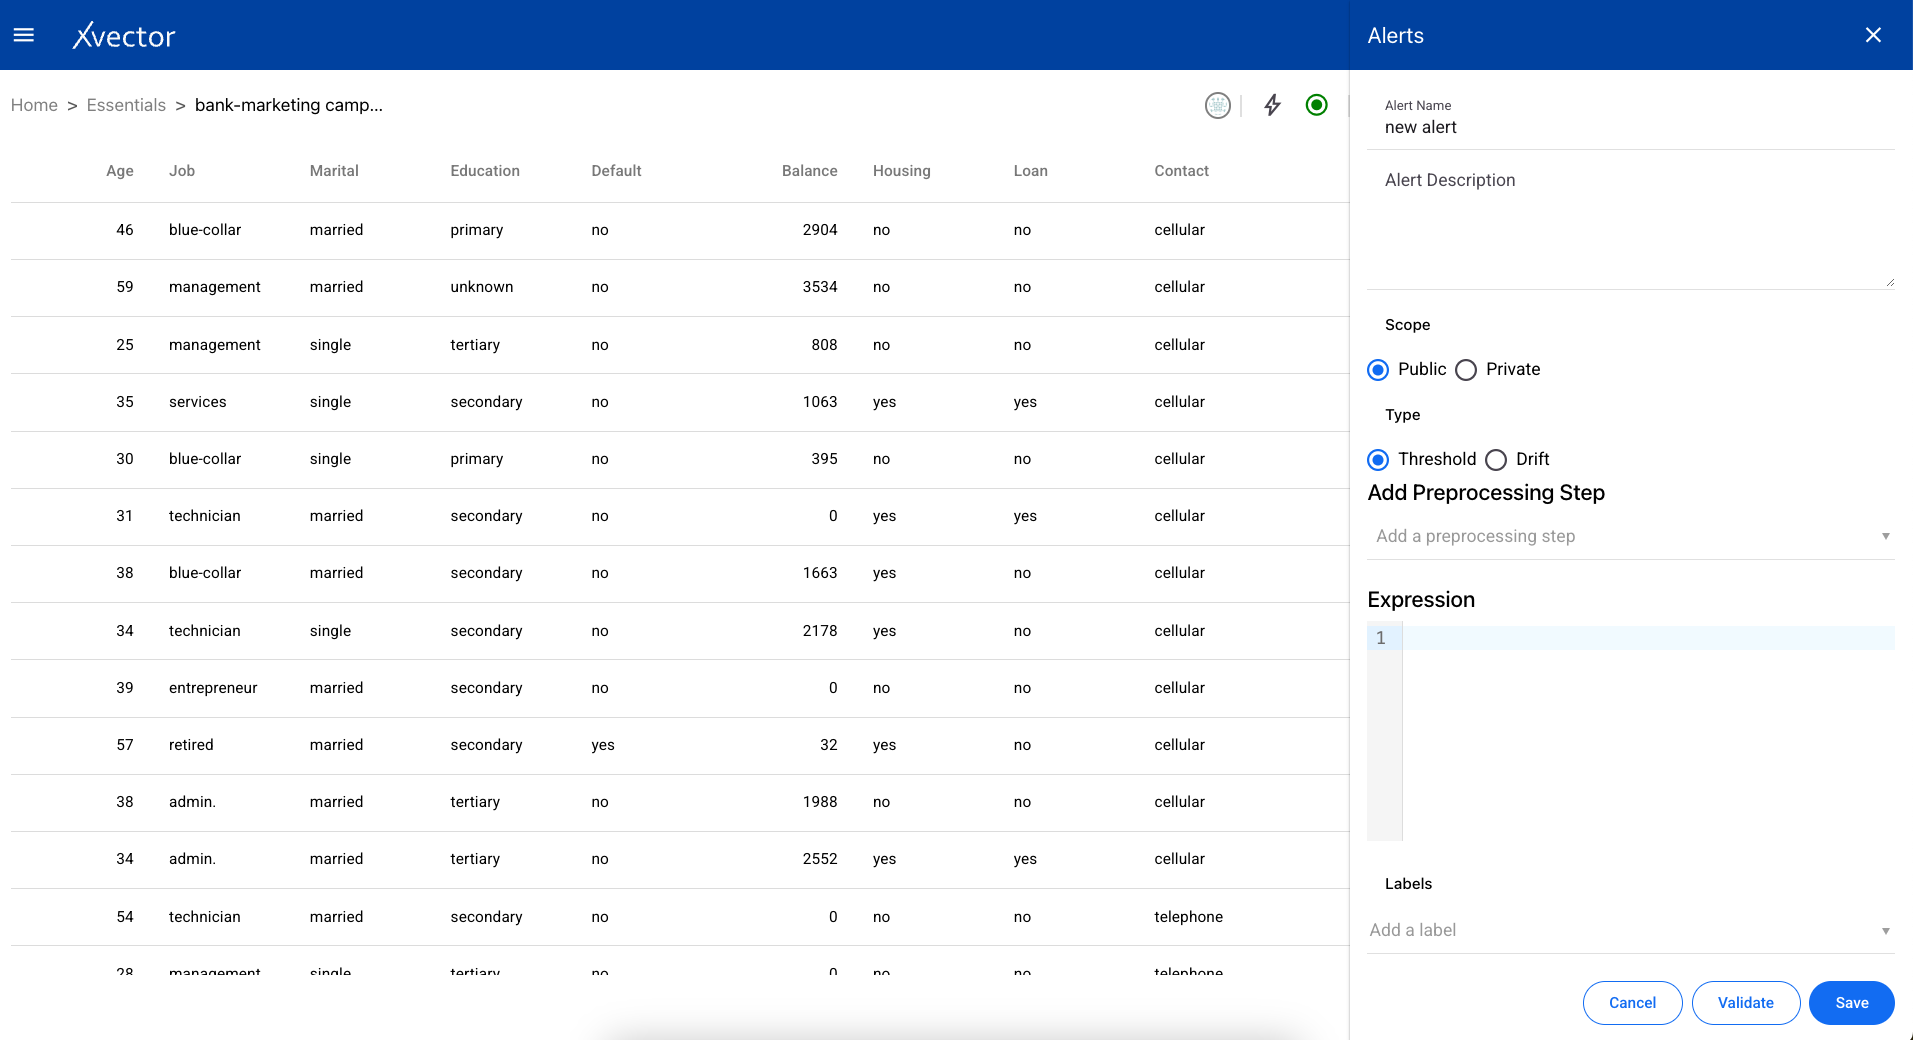
Section titled “Threshold”Create a threshold alert with the following steps:
- Alert Name — Provide a name for the alert
- Alert Description — Provide a description
- Scope — Choose the alert to be either public or private
- Type — Choose Threshold
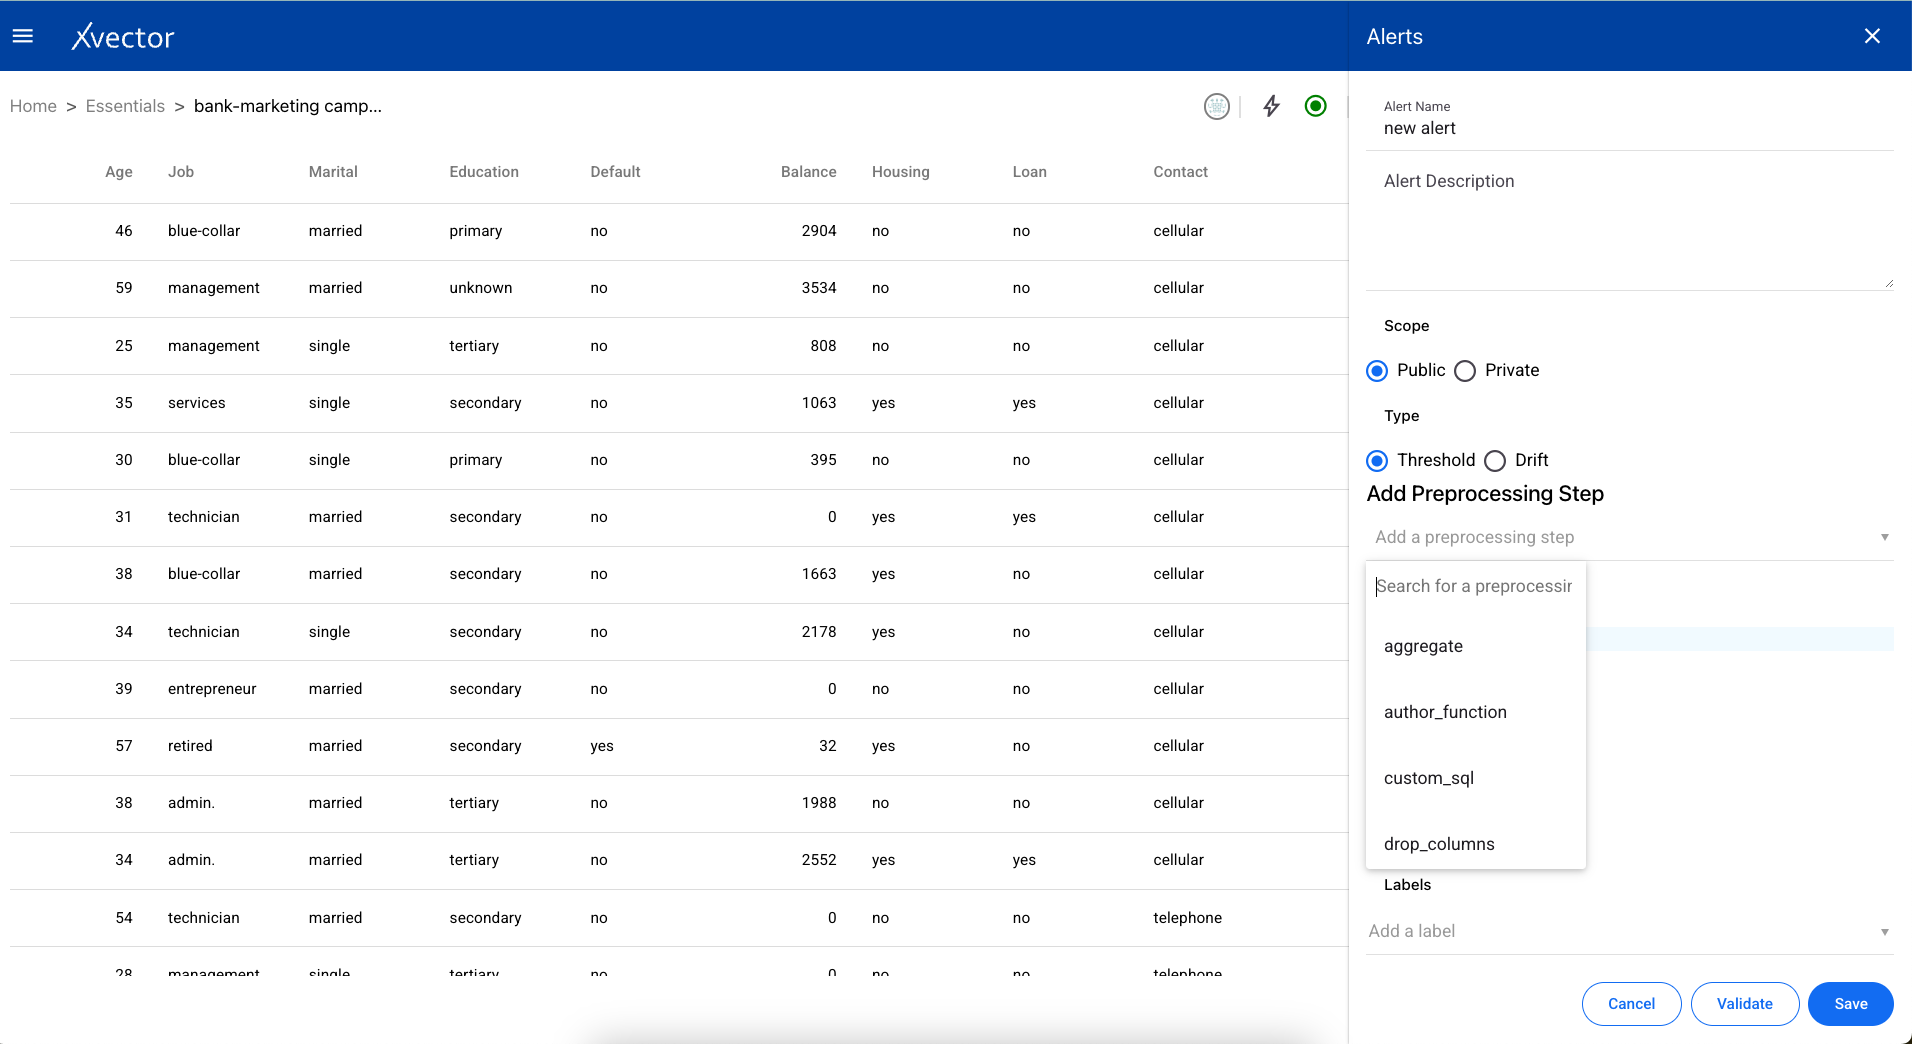
- Add Preprocessing Step — Add a preprocessing step (uses the same enrichment functions described above)
- Expression — Provide a custom expression for the alert to run
- Validate — Best practice to validate input before saving
- Save — Save and run the alert on the dataset
Drifts are calculated in the context of models. They are calculated when the dataset is synchronized with the Data Source. The data source should have indices for synchronization.