Models
Models allow users to find patterns in data and make predictions. Given the sensitivity of algorithms to data distribution — which can change over time and lead to performance deterioration — xVector provides a structured approach to experimentation and model management.
In xVector, building models begins with drivers — powerful libraries such as Scikit-learn and XGBoost that power the algorithms. Once a driver is set up, the next step is to create a model, a framework for experimentation. Each model becomes a hub of exploration where experiments are authored, and experiments are populated with multiple runs, each a unique attempt to capture and compare parameters.
Once the user picks a model that fits the data best, the model can be deployed to make predictions. Models in production are then continuously monitored for performance. Anomalous behaviors are quickly identified and notified for further action.
Key Concepts
Section titled “Key Concepts”Experiments
Section titled “Experiments”A user can create multiple experiments under a model. Each experiment includes one or more runs. Under each experiment, various parameters with available drivers can be tried on different datasets. On updating any input parameters and triggering “re-train”, a new run under that experiment gets created. Different runs under an experiment can be compared using selected performance metrics.
Experiments can create multiple runs with different input parameters and performance metrics as output. Based on the metric, one can be chosen for the final model. This enables users to experiment with different drivers, datasets, and parameters to achieve the expected performance metric before deploying.
Drivers
Section titled “Drivers”Runs under experiments are powered by underlying libraries and algorithms defined in drivers. The platform provides a comprehensive set of model drivers for business analysts and advanced users. In addition, data scientists can author custom drivers.
Authoring Custom Drivers
Section titled “Authoring Custom Drivers”Users can author custom drivers for different model types. If requirements don’t fit any defined type, users can choose the ‘app’ type.
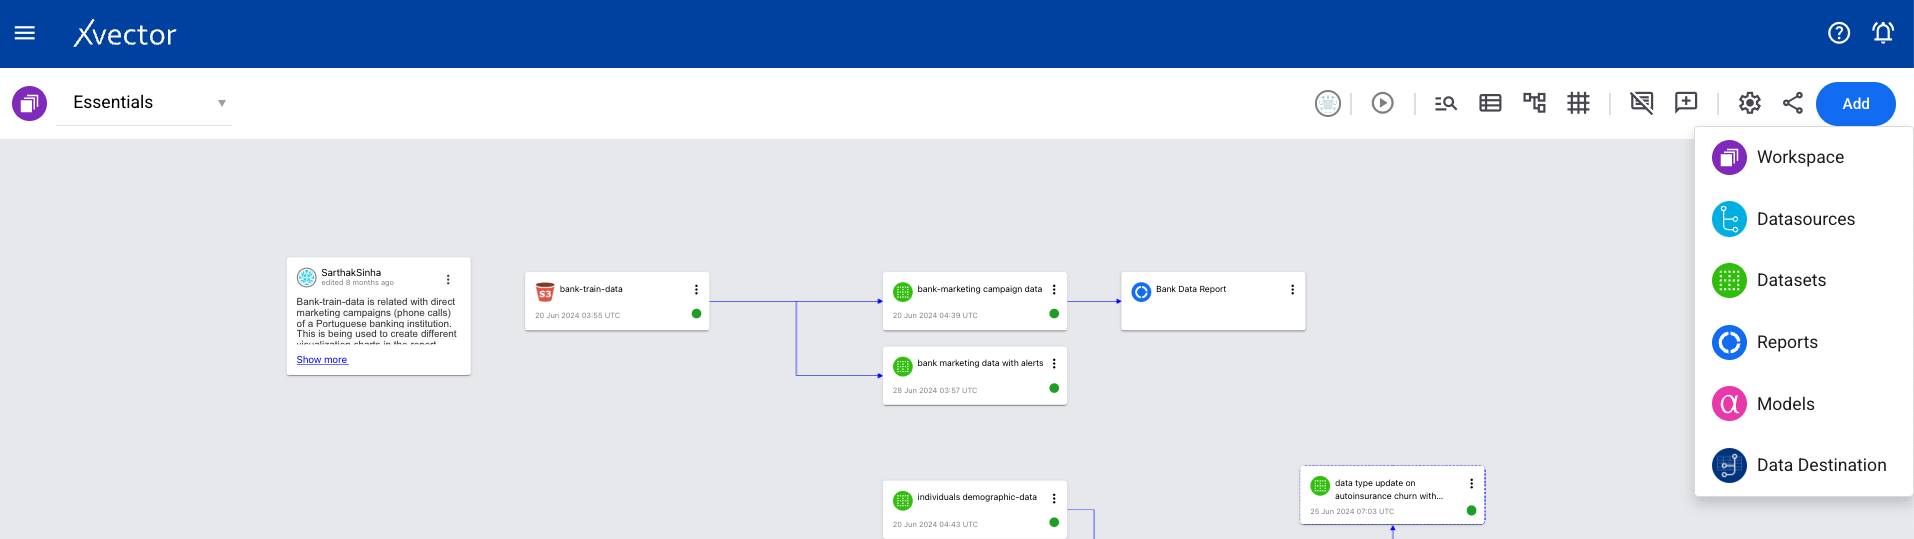
- From a workspace, click on Add and choose Models.
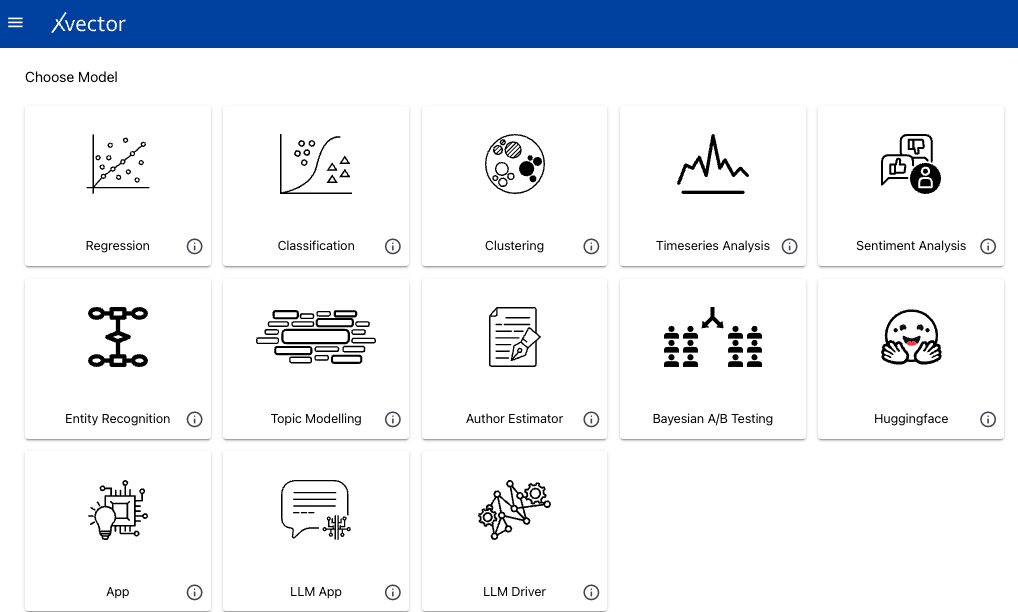
- Choose Author Estimator from the available list.
- Enter details: Name, Type, base driver (optional), whether it’s pretrained, and scope.
A Jupyter server will be launched where users can author drivers. The notebook contains five files: train.ipynb, predict.ipynb, xvector_estimator_utils.py, config.json, and requirements.txt. Write the algorithm in train.ipynb and modify predict.ipynb for predictions. Training parameters are defined in config.json.
Notebook options under the xVector menu: Select dataset (updates config.json with metadata), Register (makes the driver available for use in models), and Shutdown (stops the Jupyter server).
Creating a Model
Section titled “Creating a Model”For all model types, the general workflow is:
- From a workspace, click on Add and choose Models.
- Choose the model type from the available options.
- Configure the model following the type-specific steps described below.
Regression
Section titled “Regression”Regression is a supervised learning technique for uncovering relationships between features (independent variables) and a continuous outcome (dependent variable). The goal is to use these relationships to predict the outcome of new data.
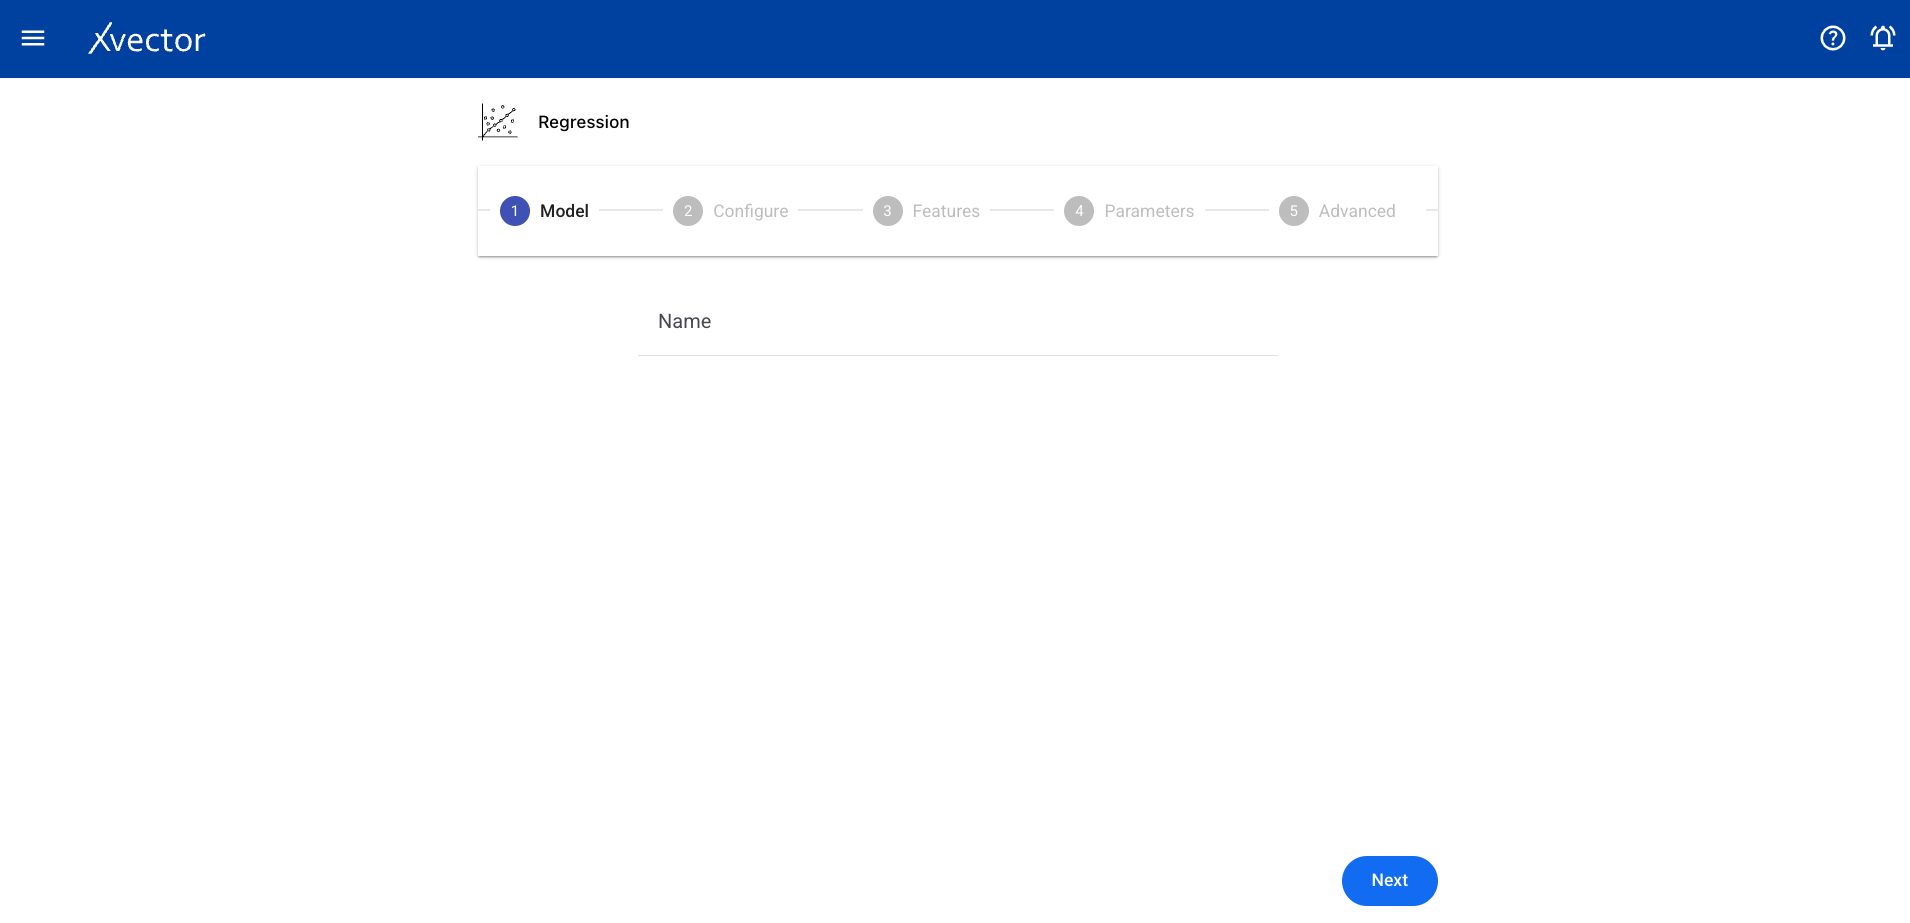
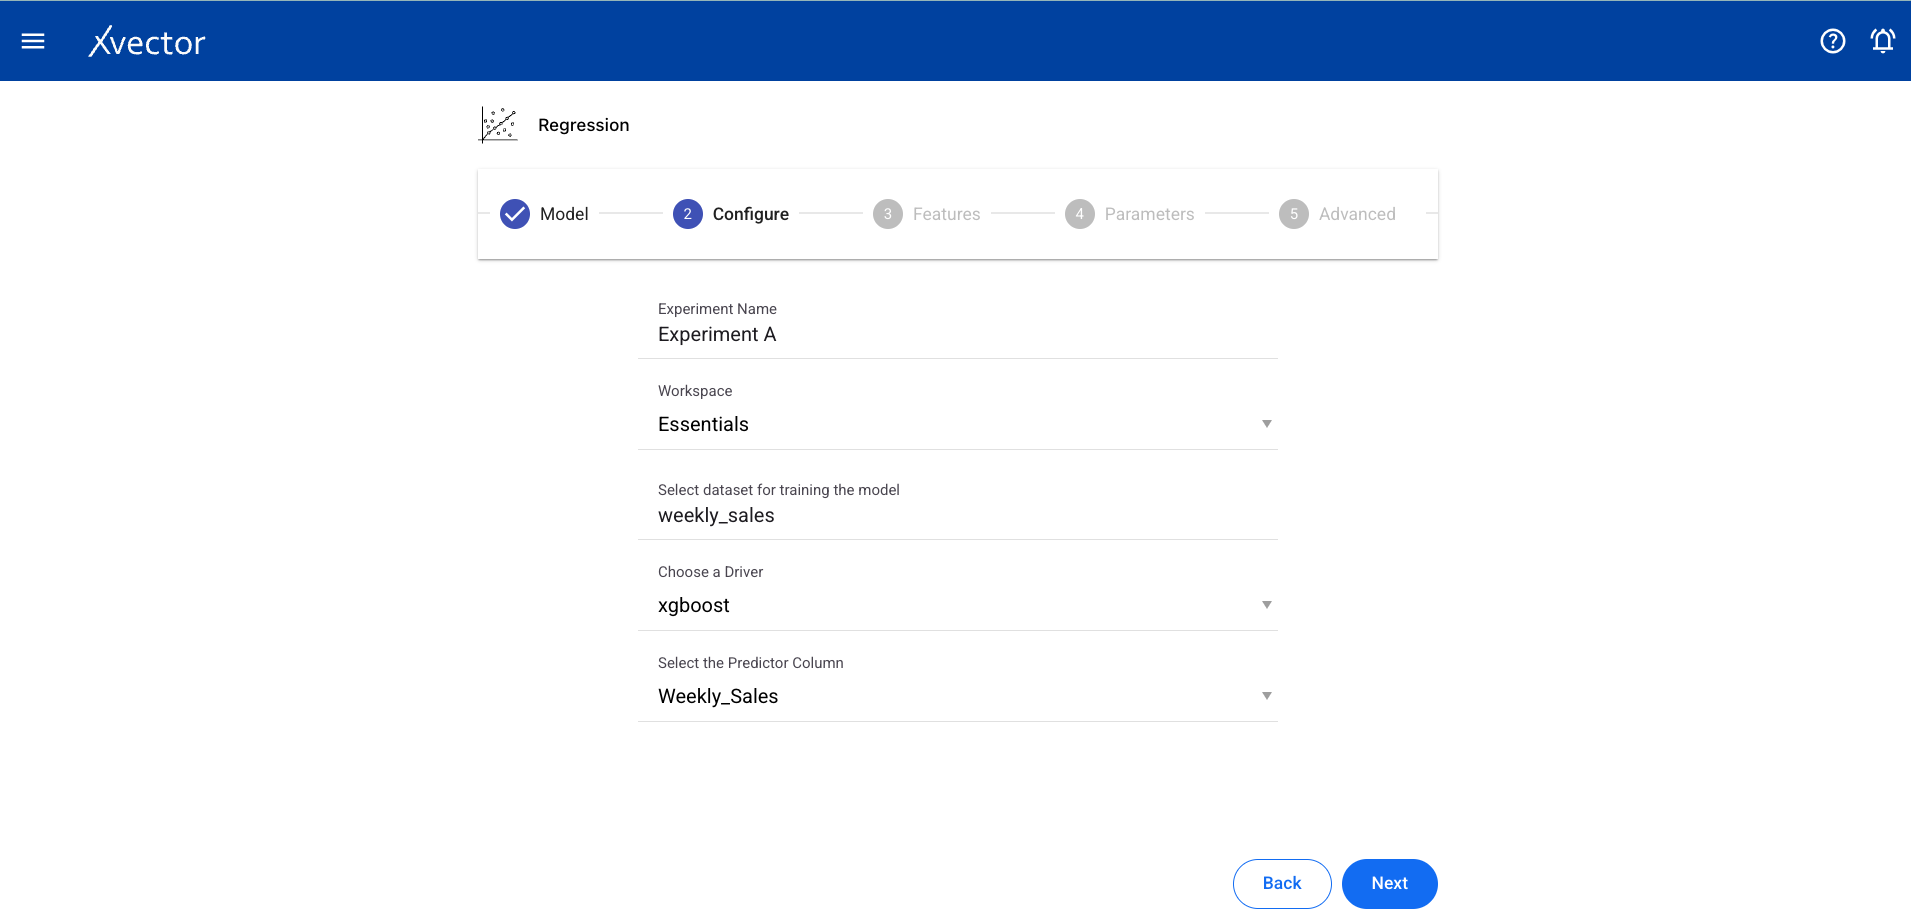
Configure steps:
- Model — Provide a name for the model
- Configure — Experiment name, workspace, select dataset, choose a driver, select the Predictor Column (target column for prediction)
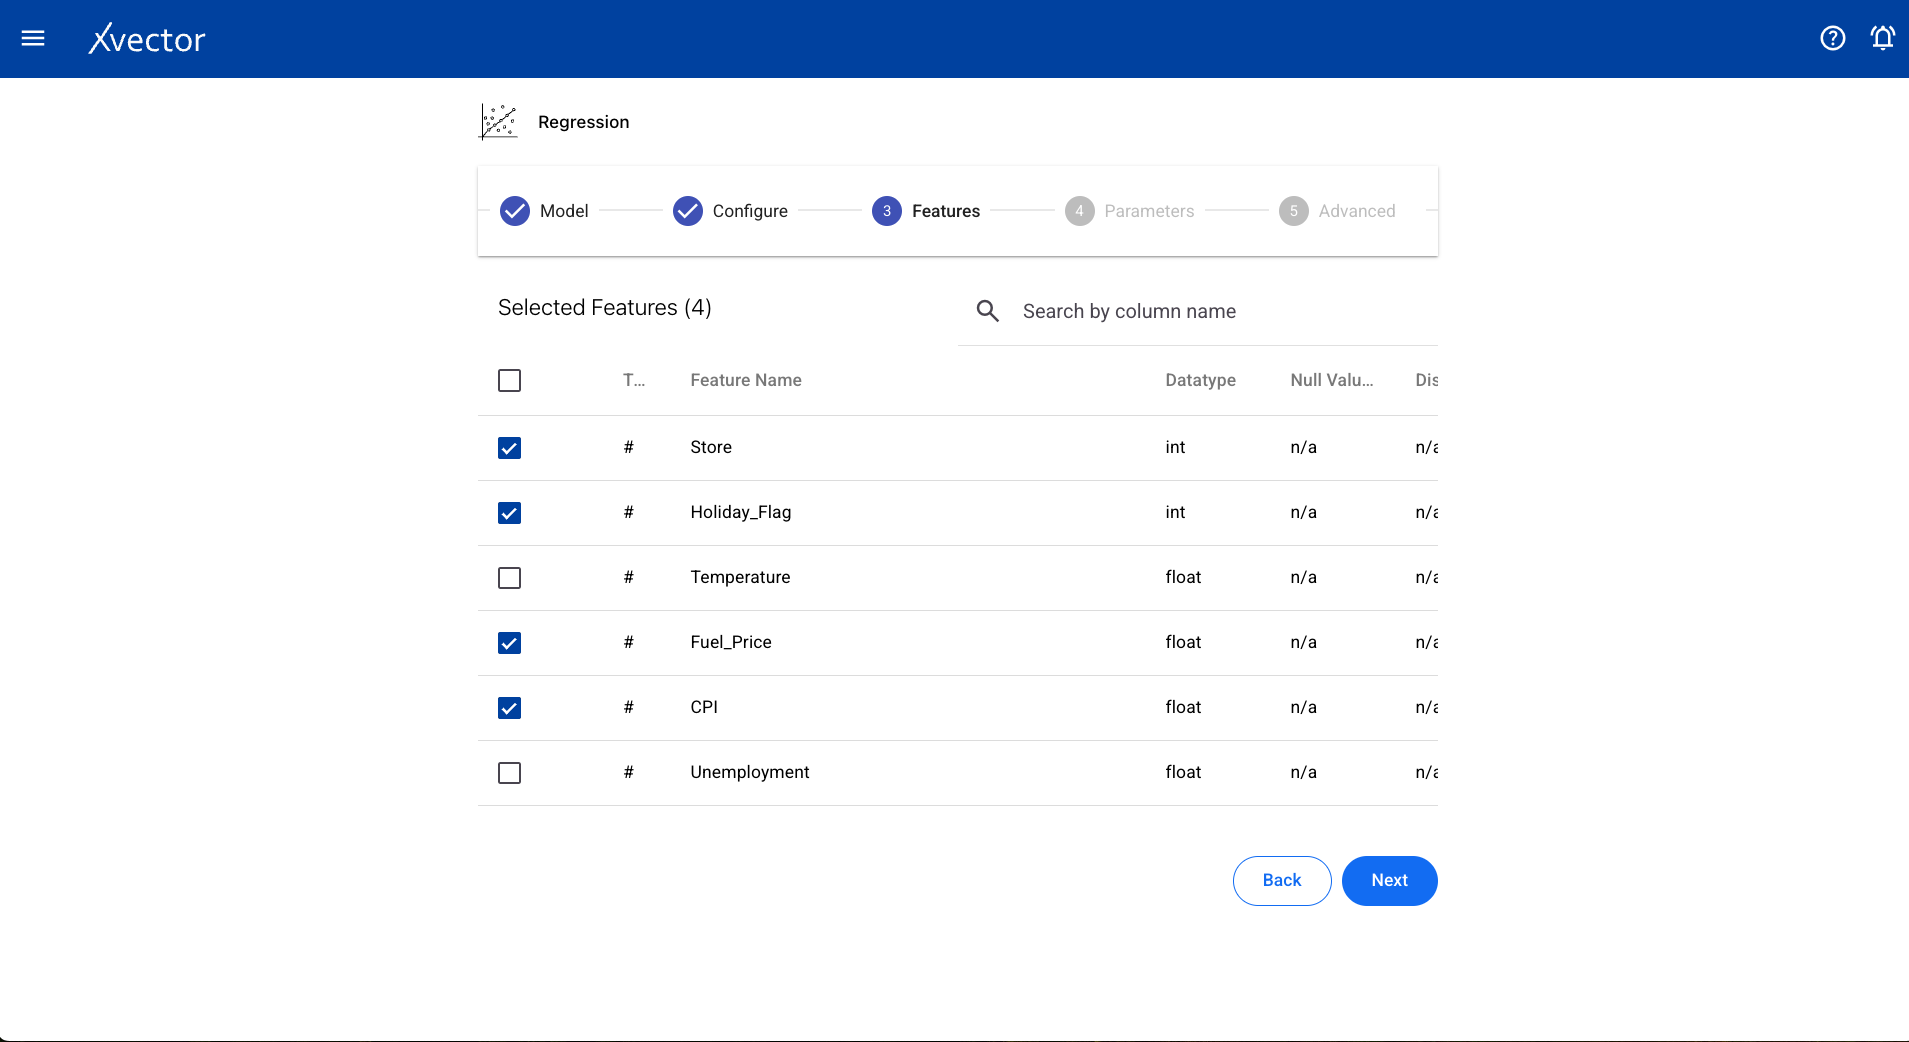
- Features — Select all columns used for the regression
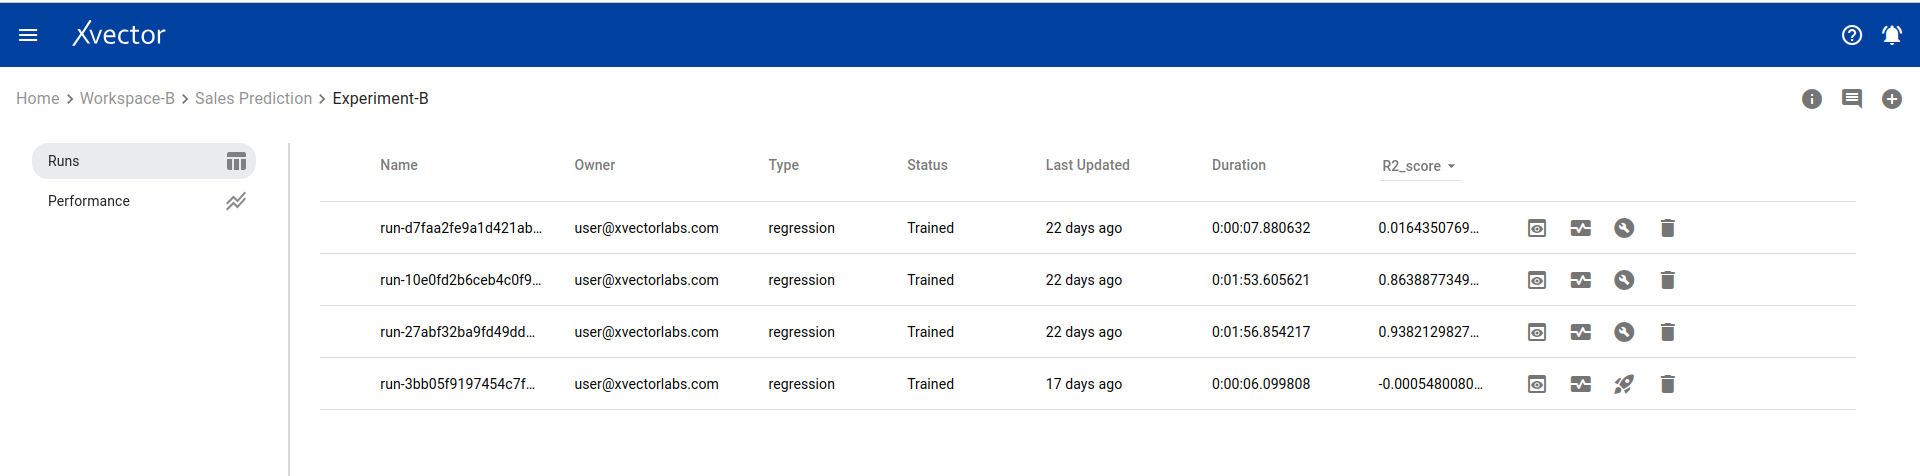
Experiment view — Shows the experiment with runs and performance metrics:
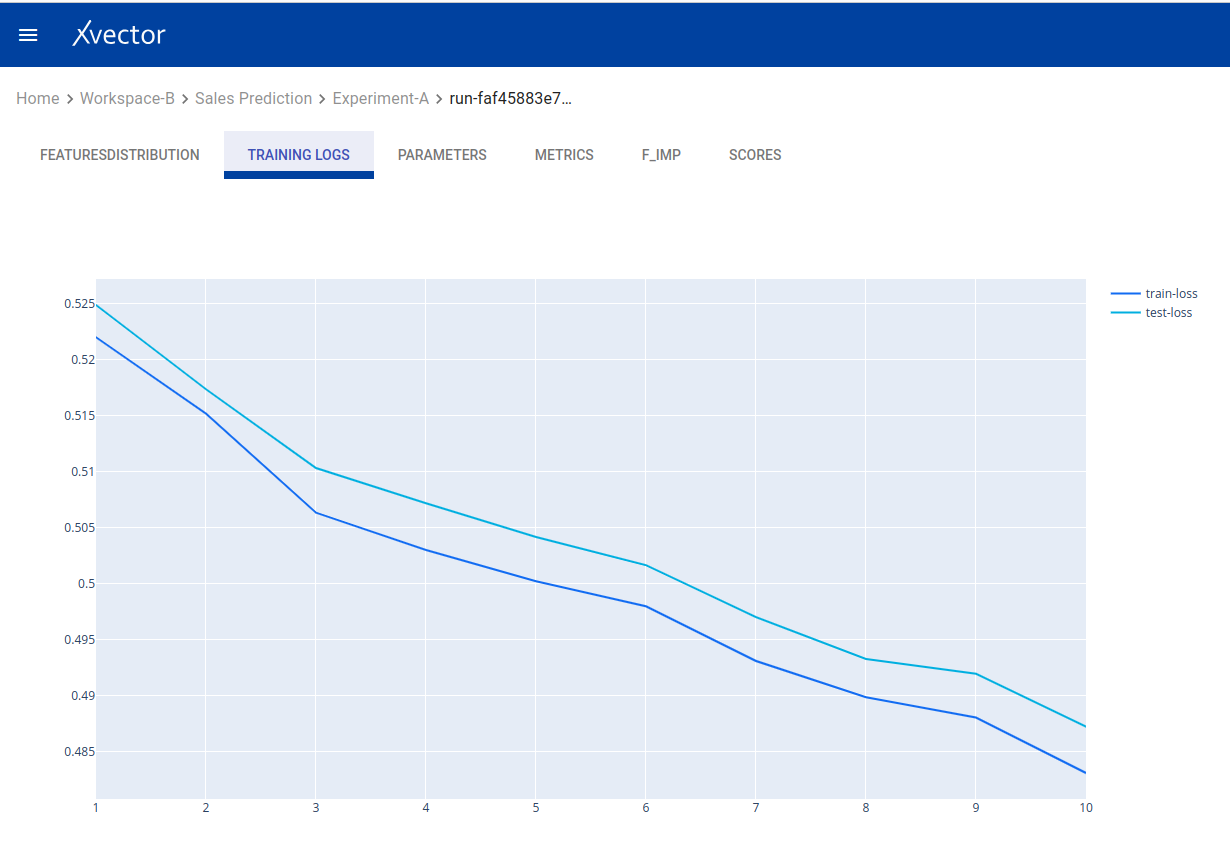
Run results — Model output with coefficients and metrics:
Predictions — Apply the trained model to generate predictions:
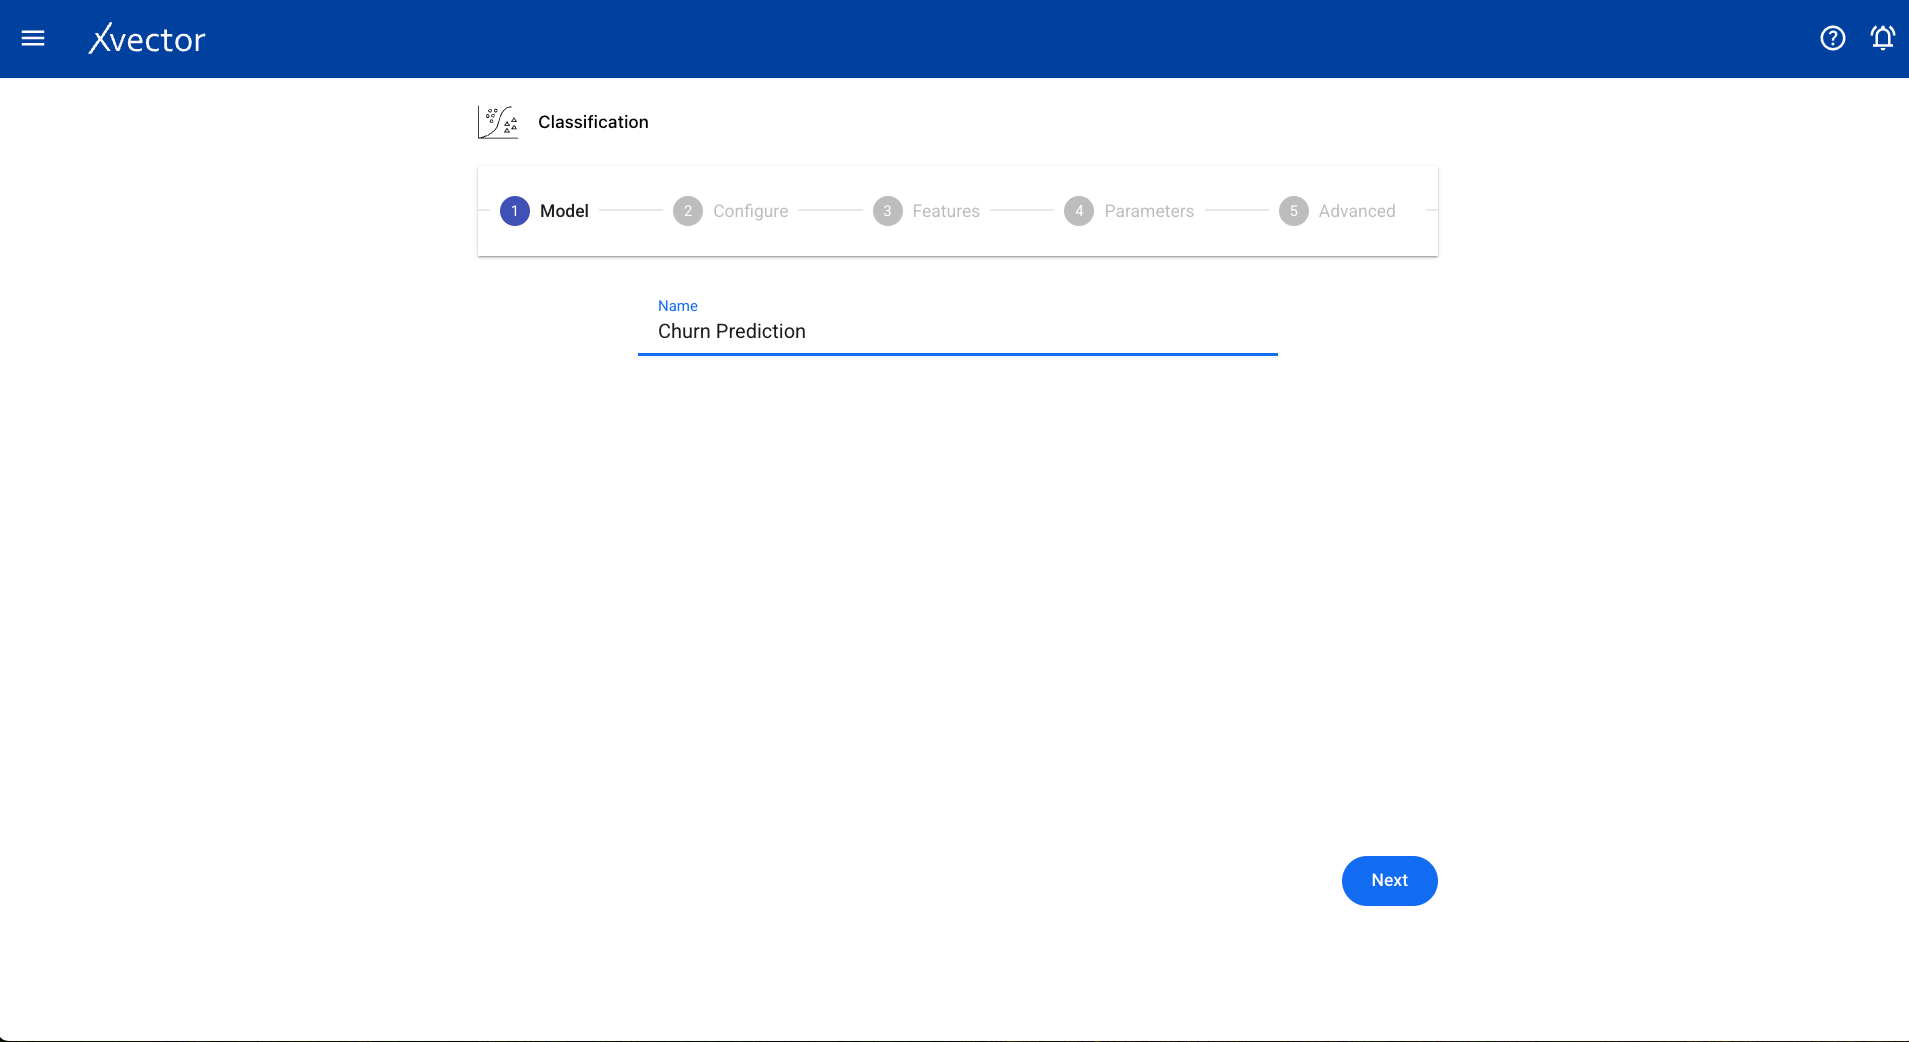
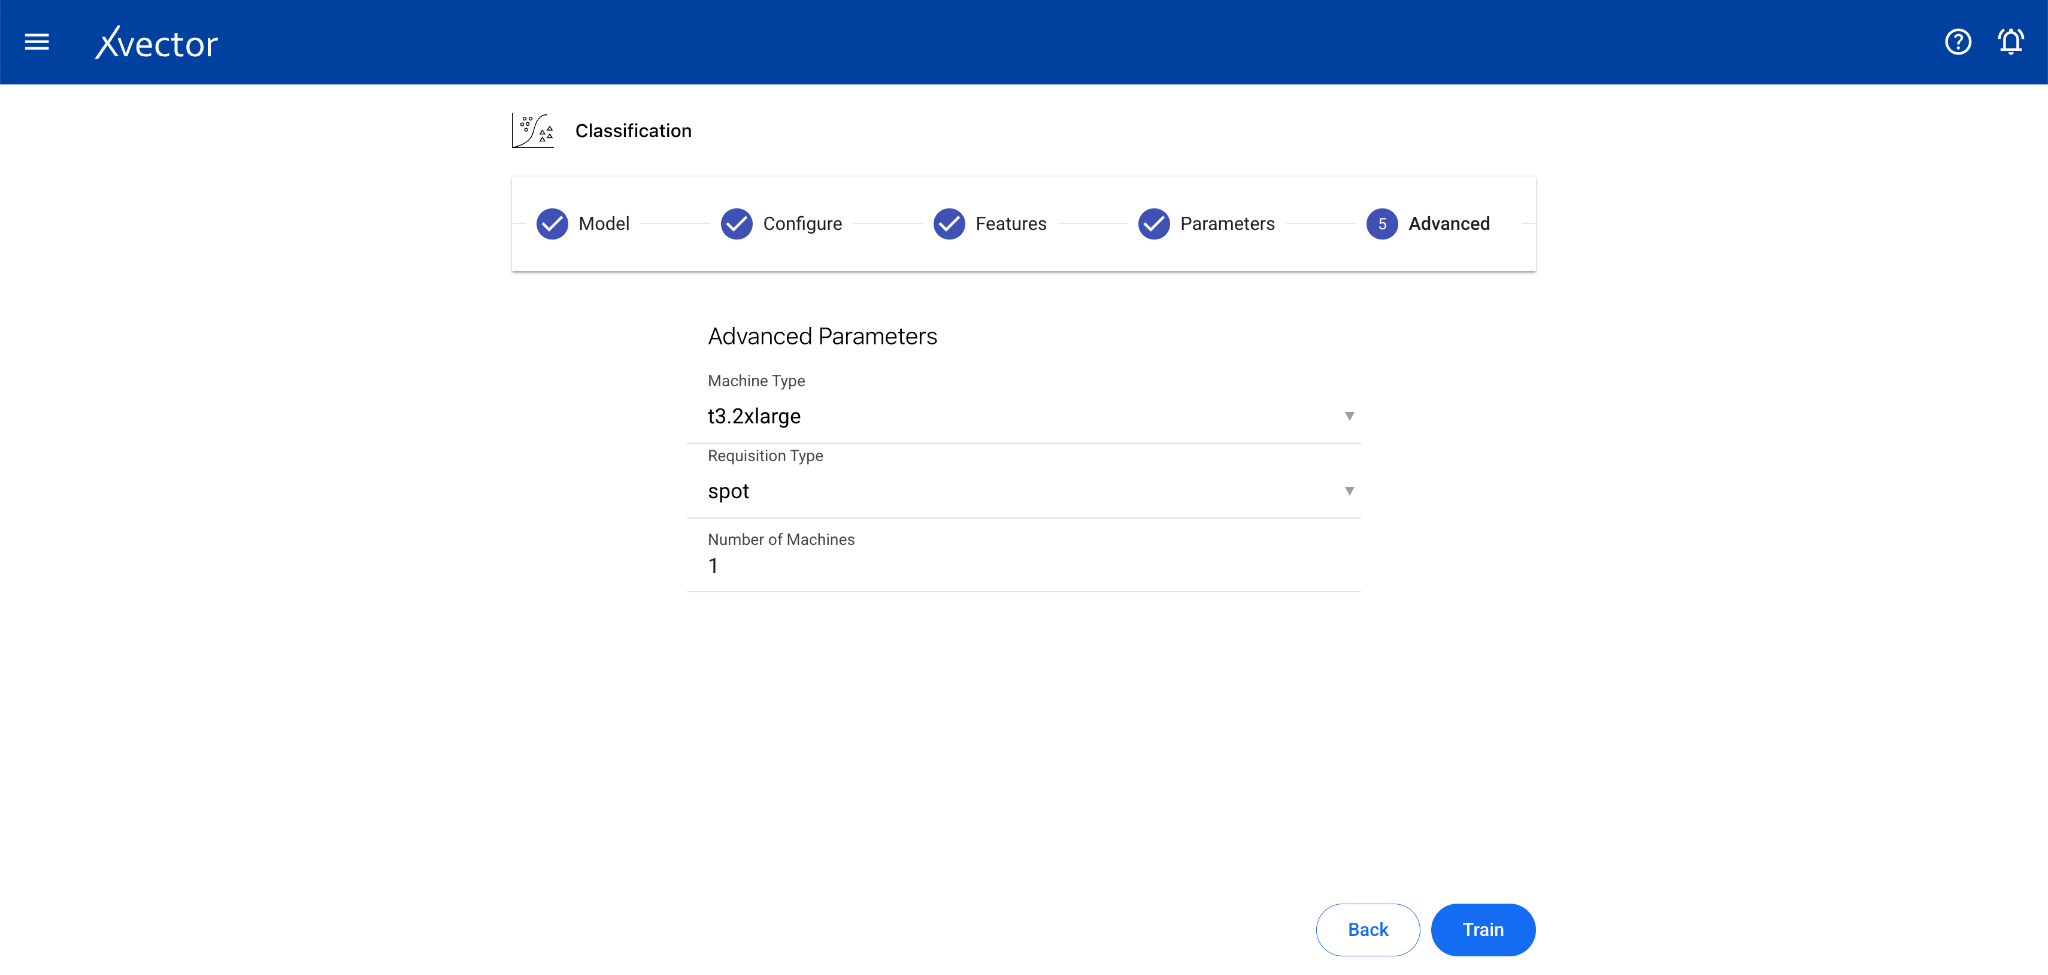
Classification
Section titled “Classification”Classification is a supervised learning technique that categorizes data into predefined classes based on features or attributes using labeled training data.
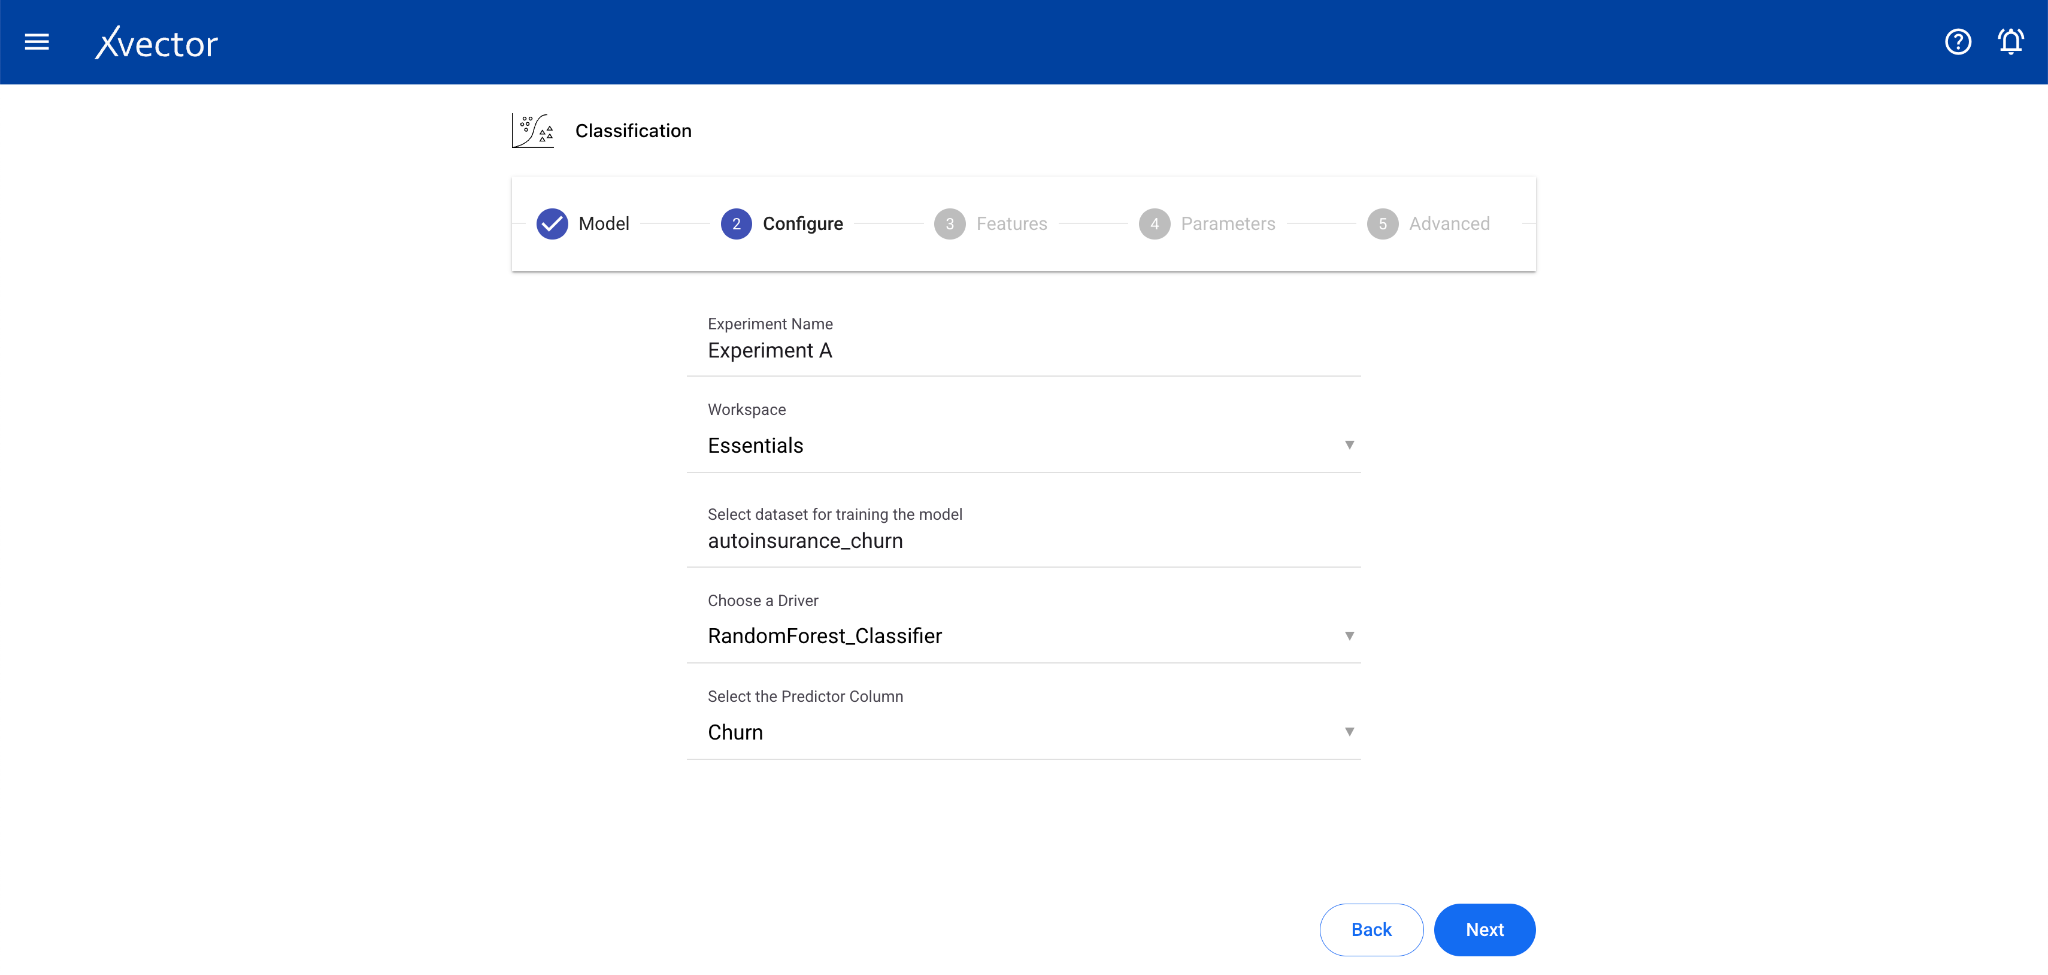
Configure steps:
- Model — Provide a name for the model
- Configure — Experiment name, workspace, select dataset, choose a driver, select the Predictor Column (the column containing the label or class)
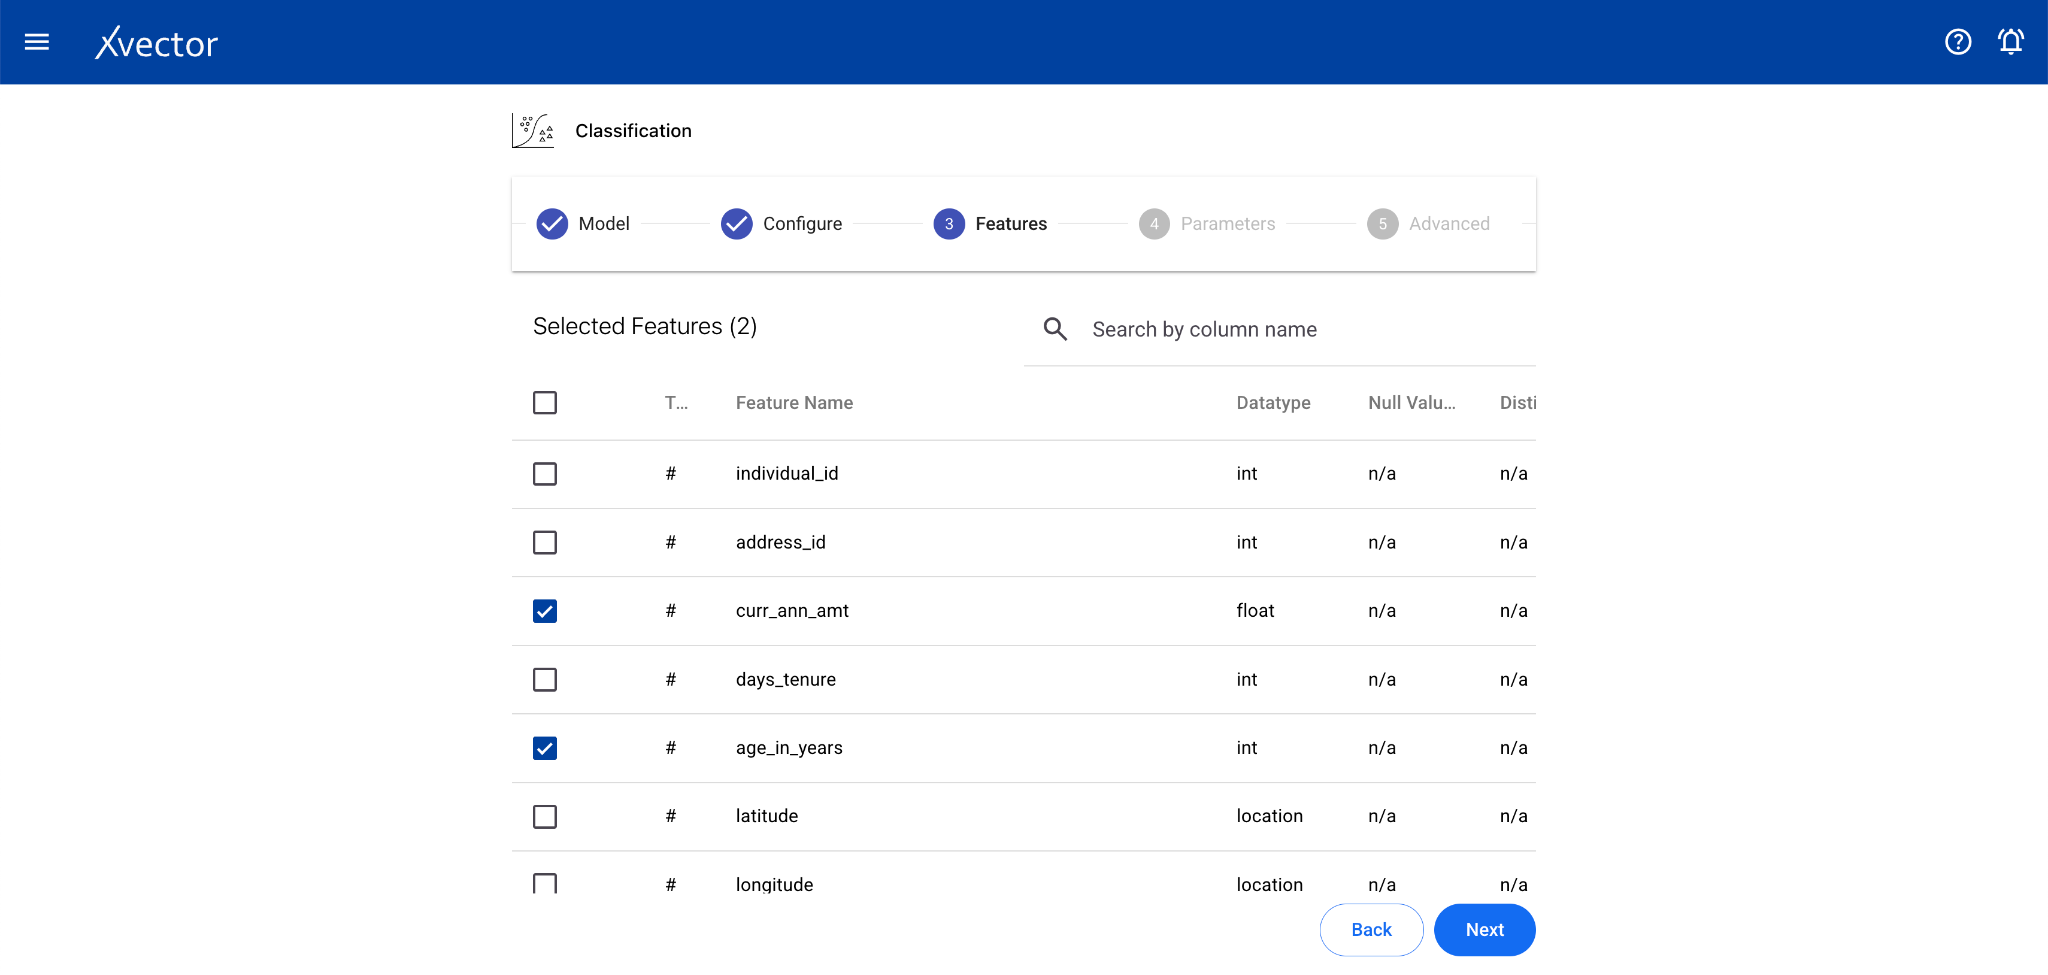
- Features — Select all columns used for classification
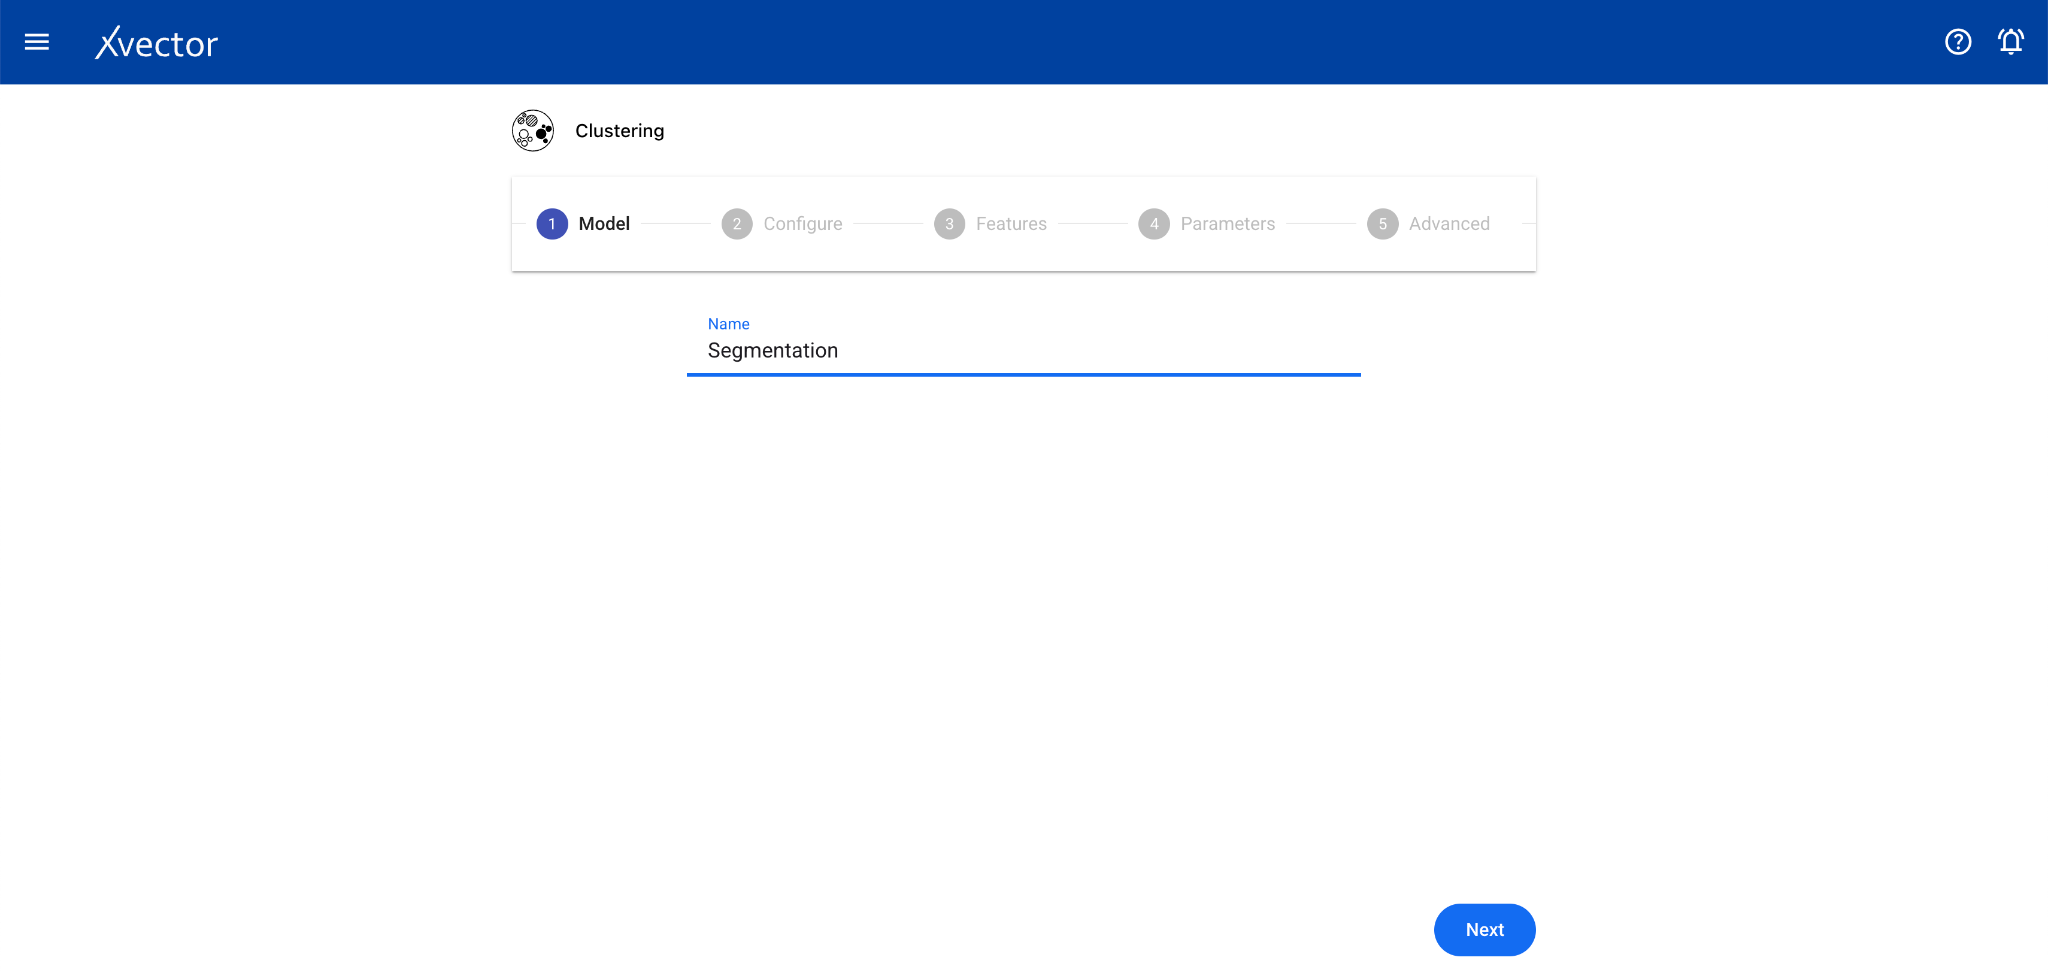
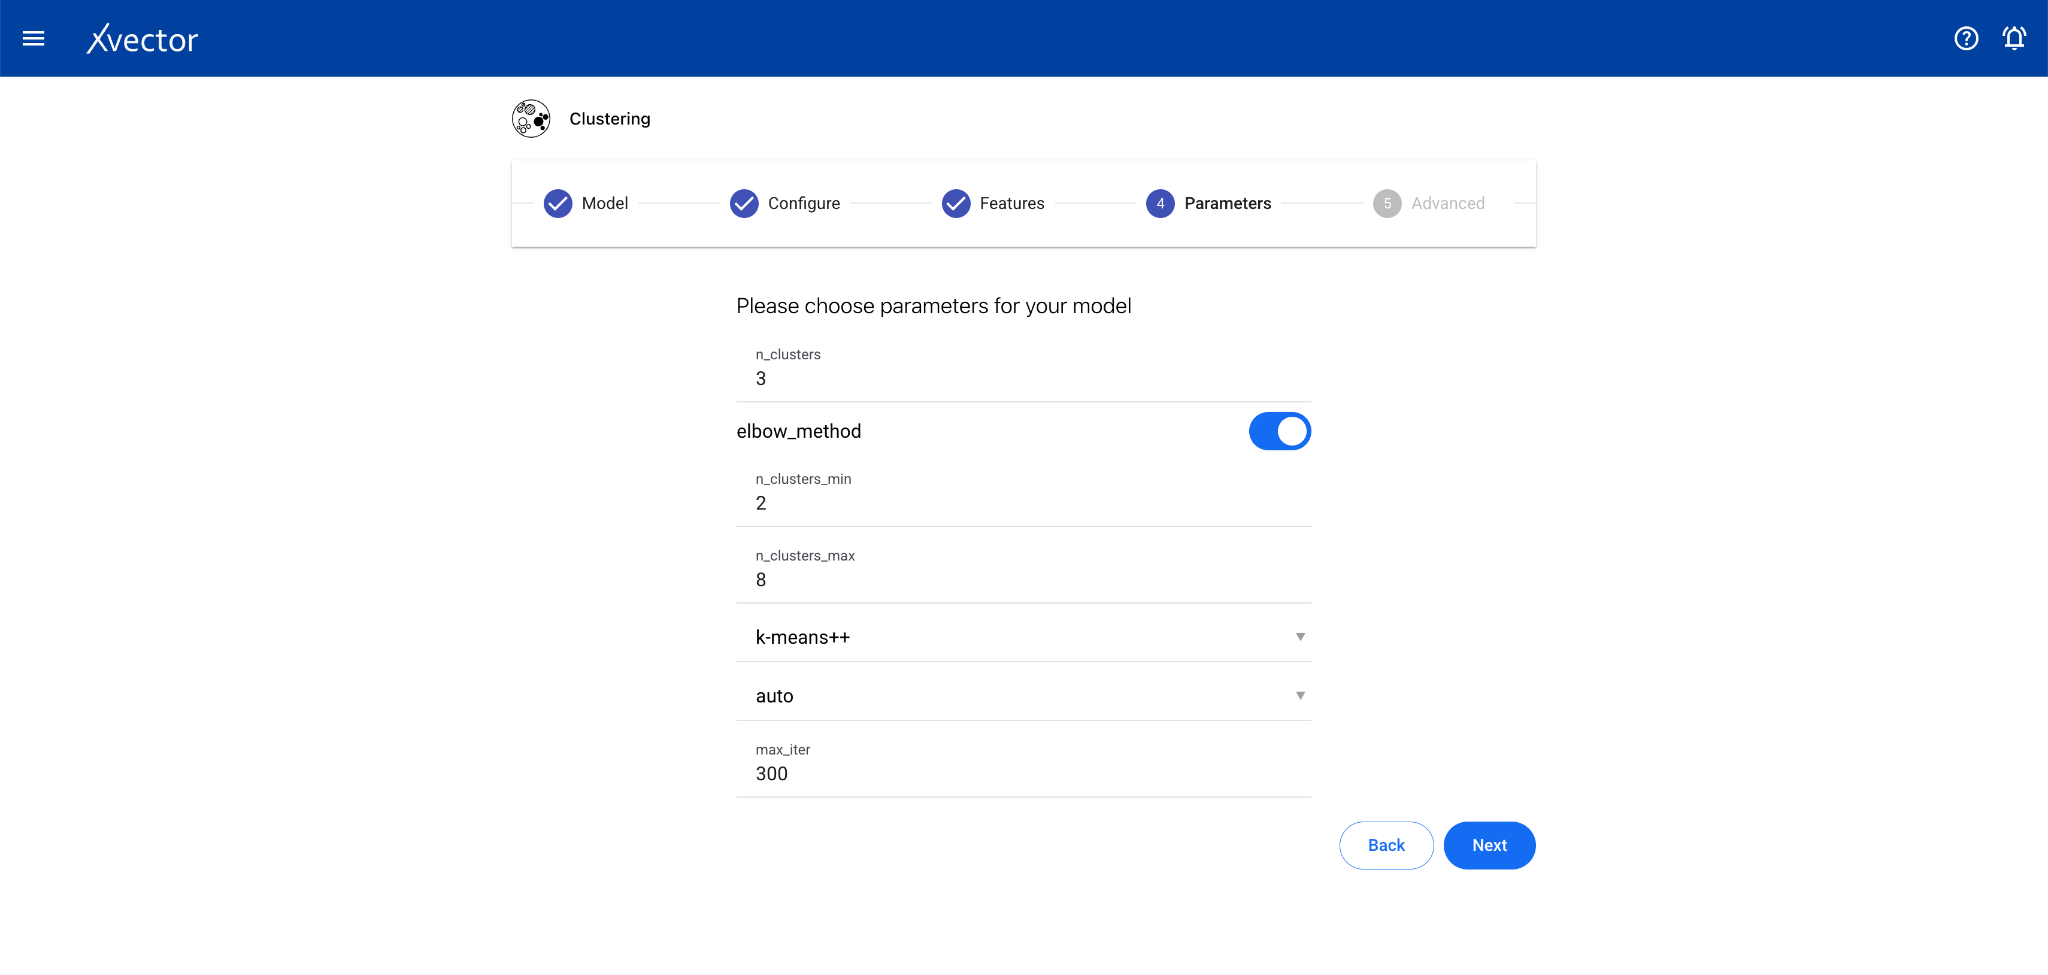
Clustering
Section titled “Clustering”Clustering is an unsupervised learning technique that groups data points based on similarity of attributes. There is no predictor column — the algorithm discovers natural groupings.
Configure steps:
- Model — Provide a name for the model
- Configure — Experiment name, workspace, select dataset, choose a driver
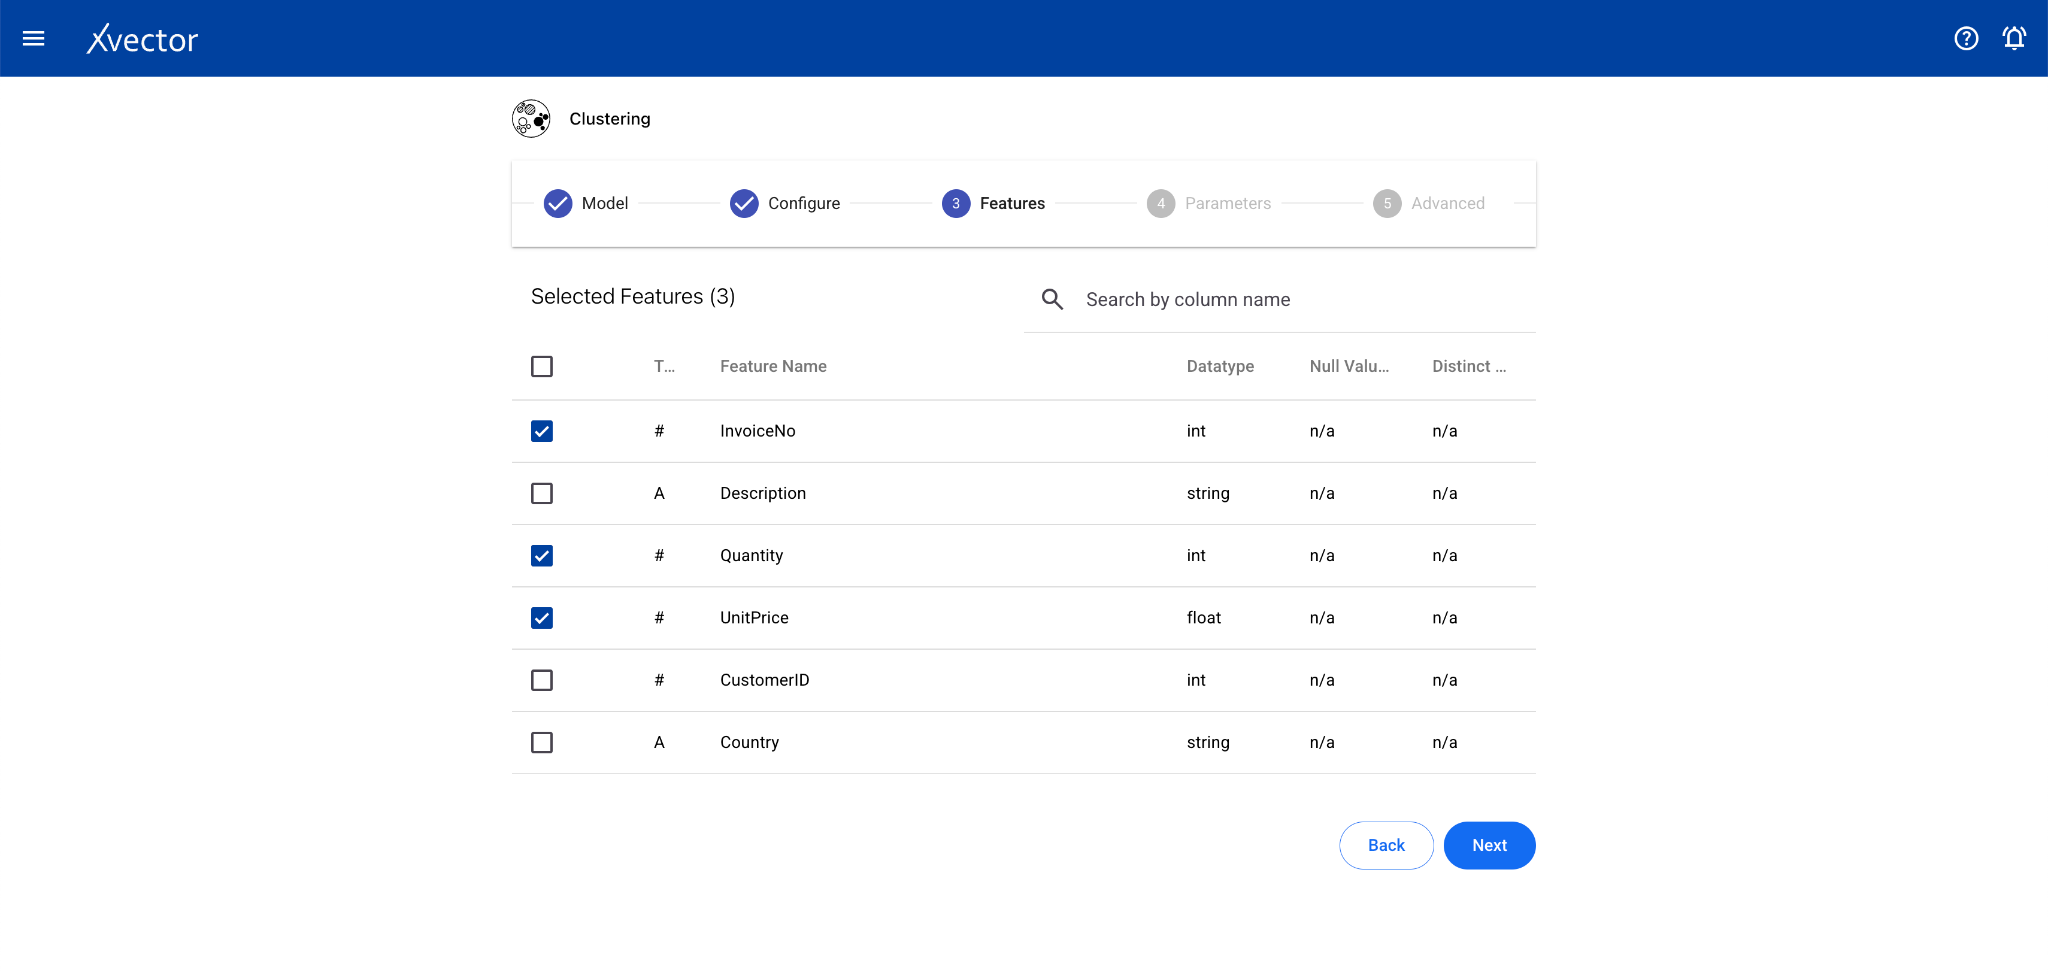
- Features — Select all columns used for clustering


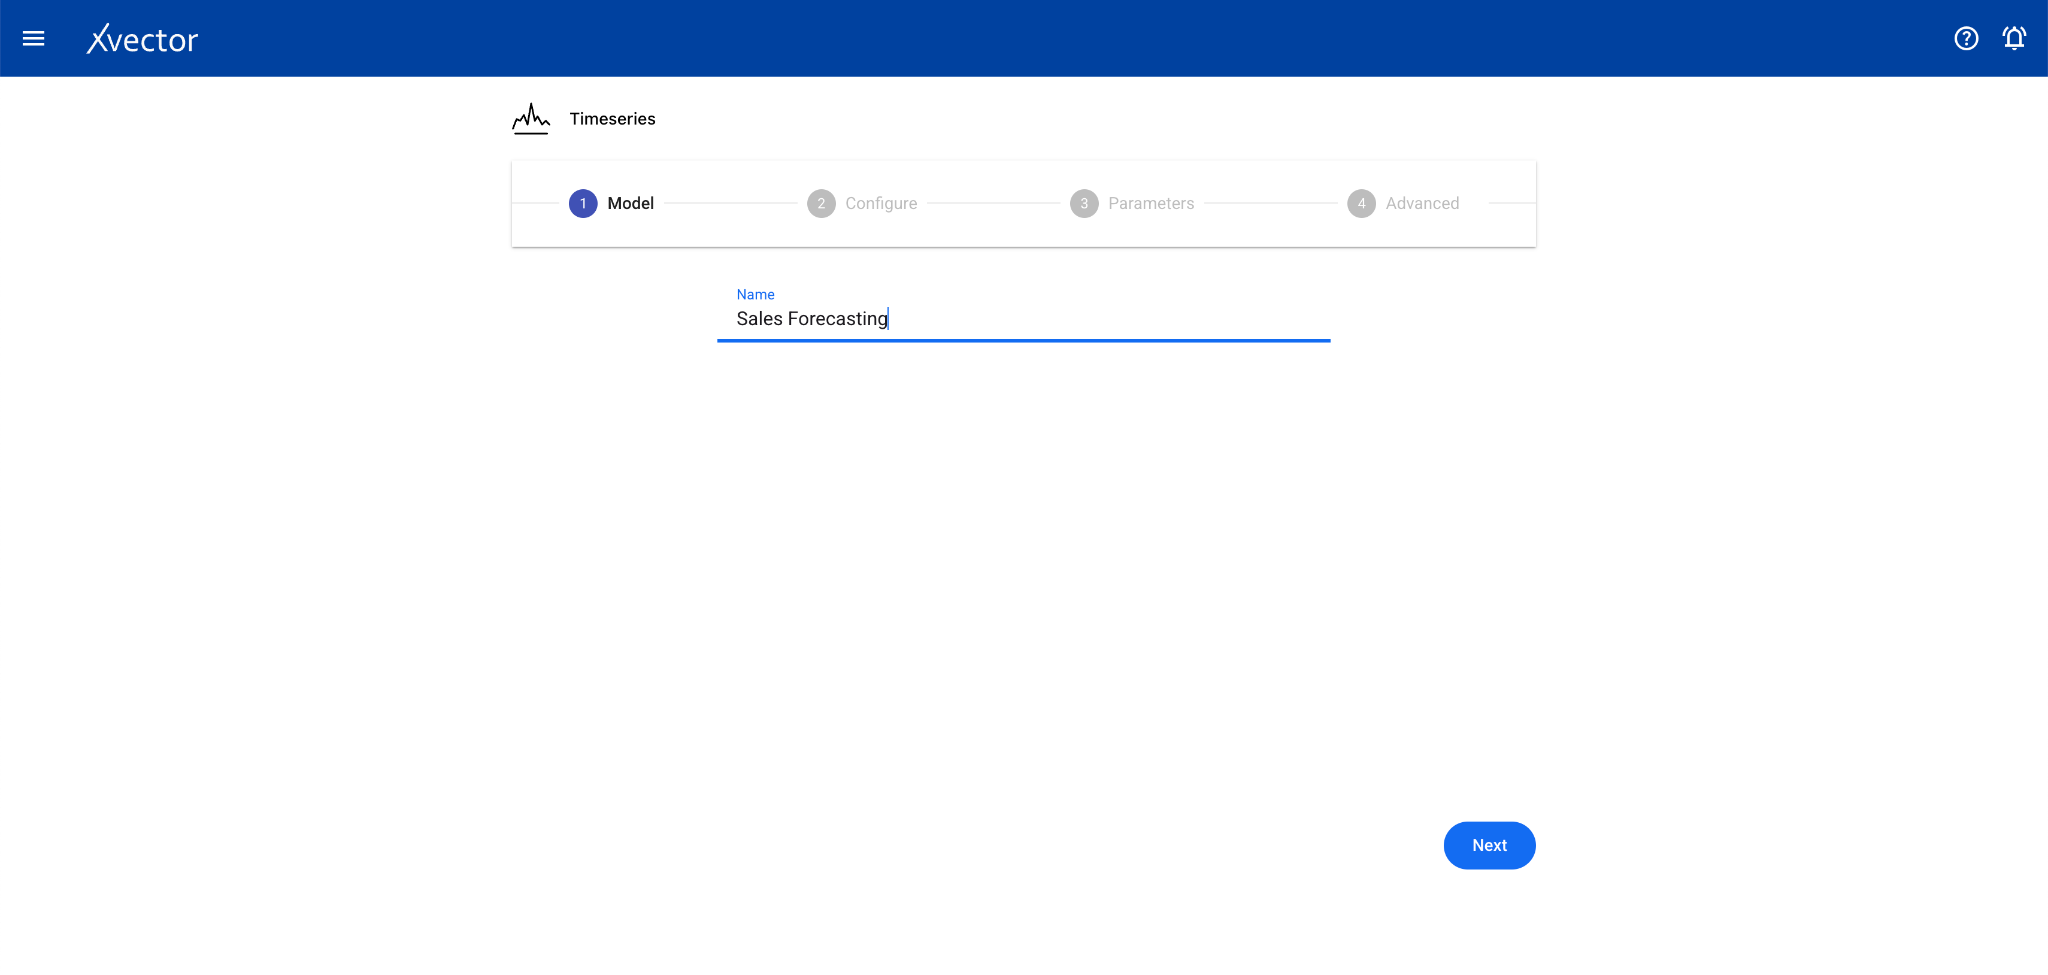
Timeseries
Section titled “Timeseries”Time series analysis allows businesses to forecast time-dependent variables such as sales, helping manage finance and supply chain functions.
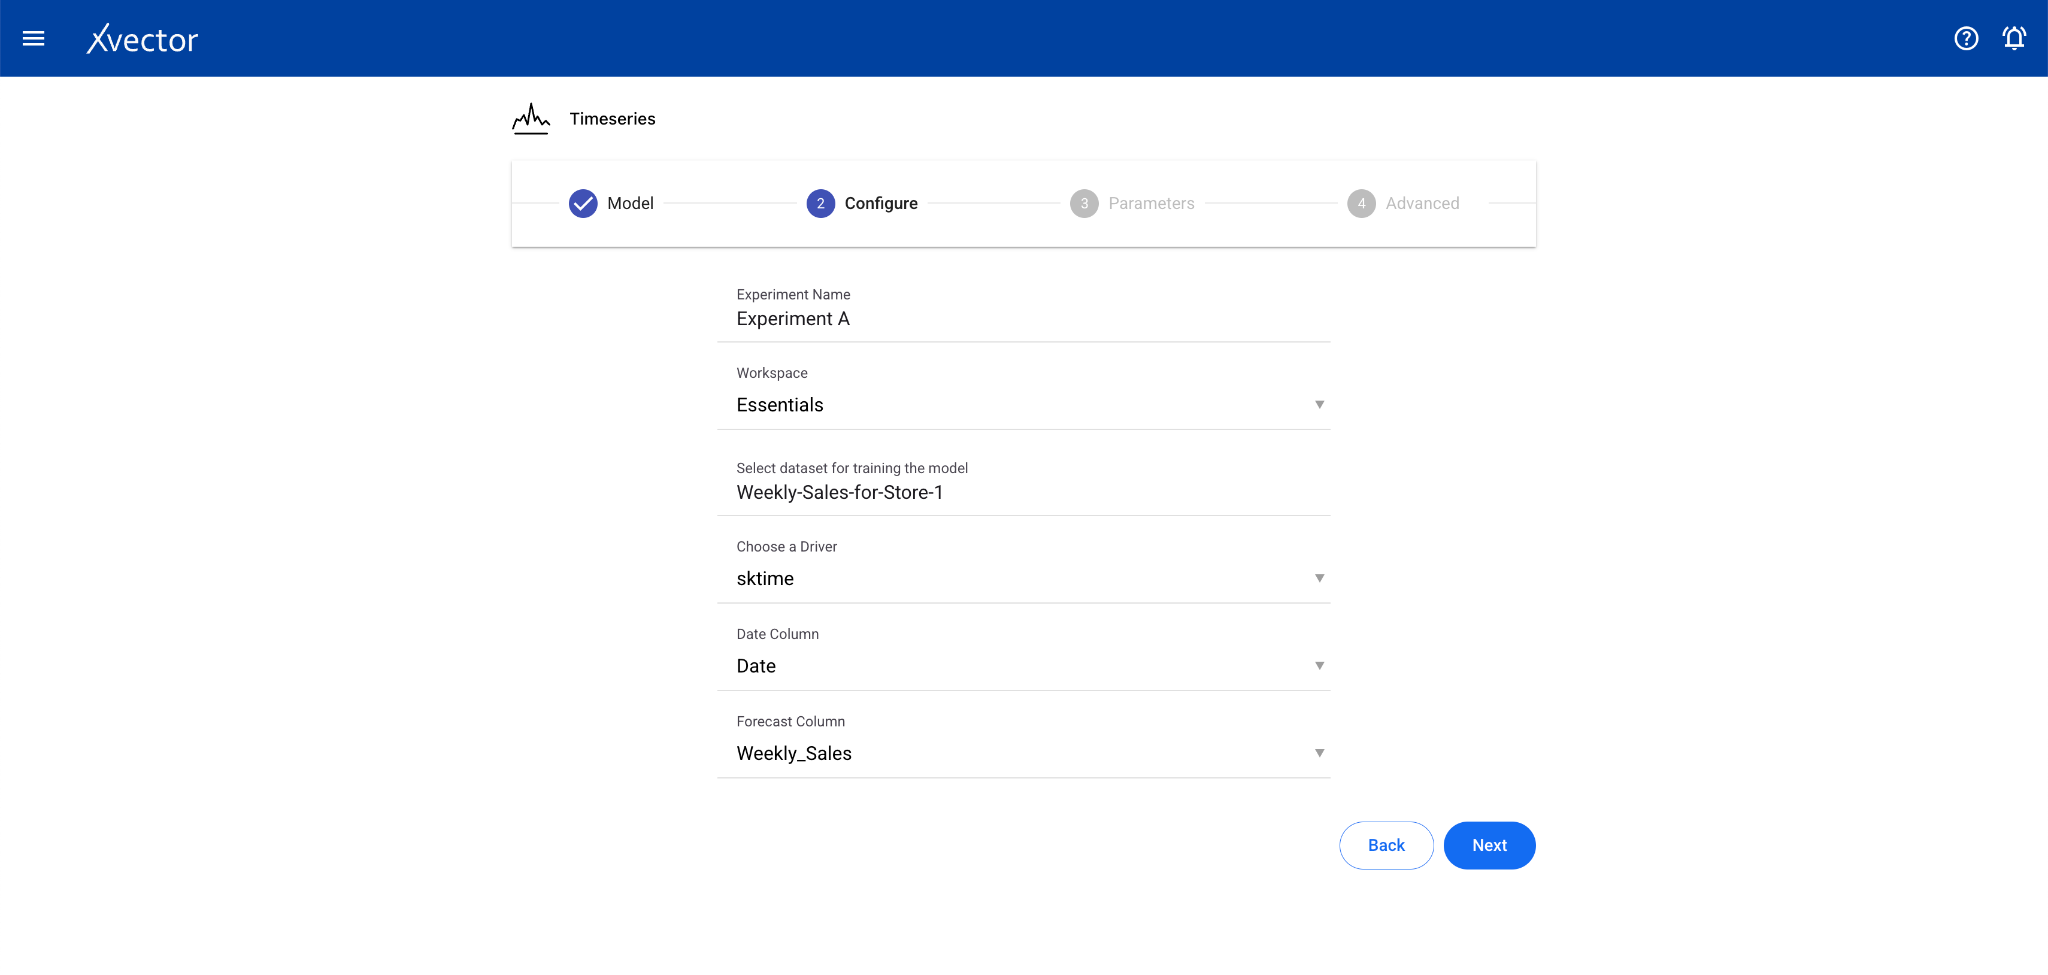
Configure steps:
- Model — Provide a name for the model
- Configure — Experiment name, workspace, select dataset, choose a driver, select the Date Column and the Forecast Column
- Features — Select relevant features (optional depending on driver)
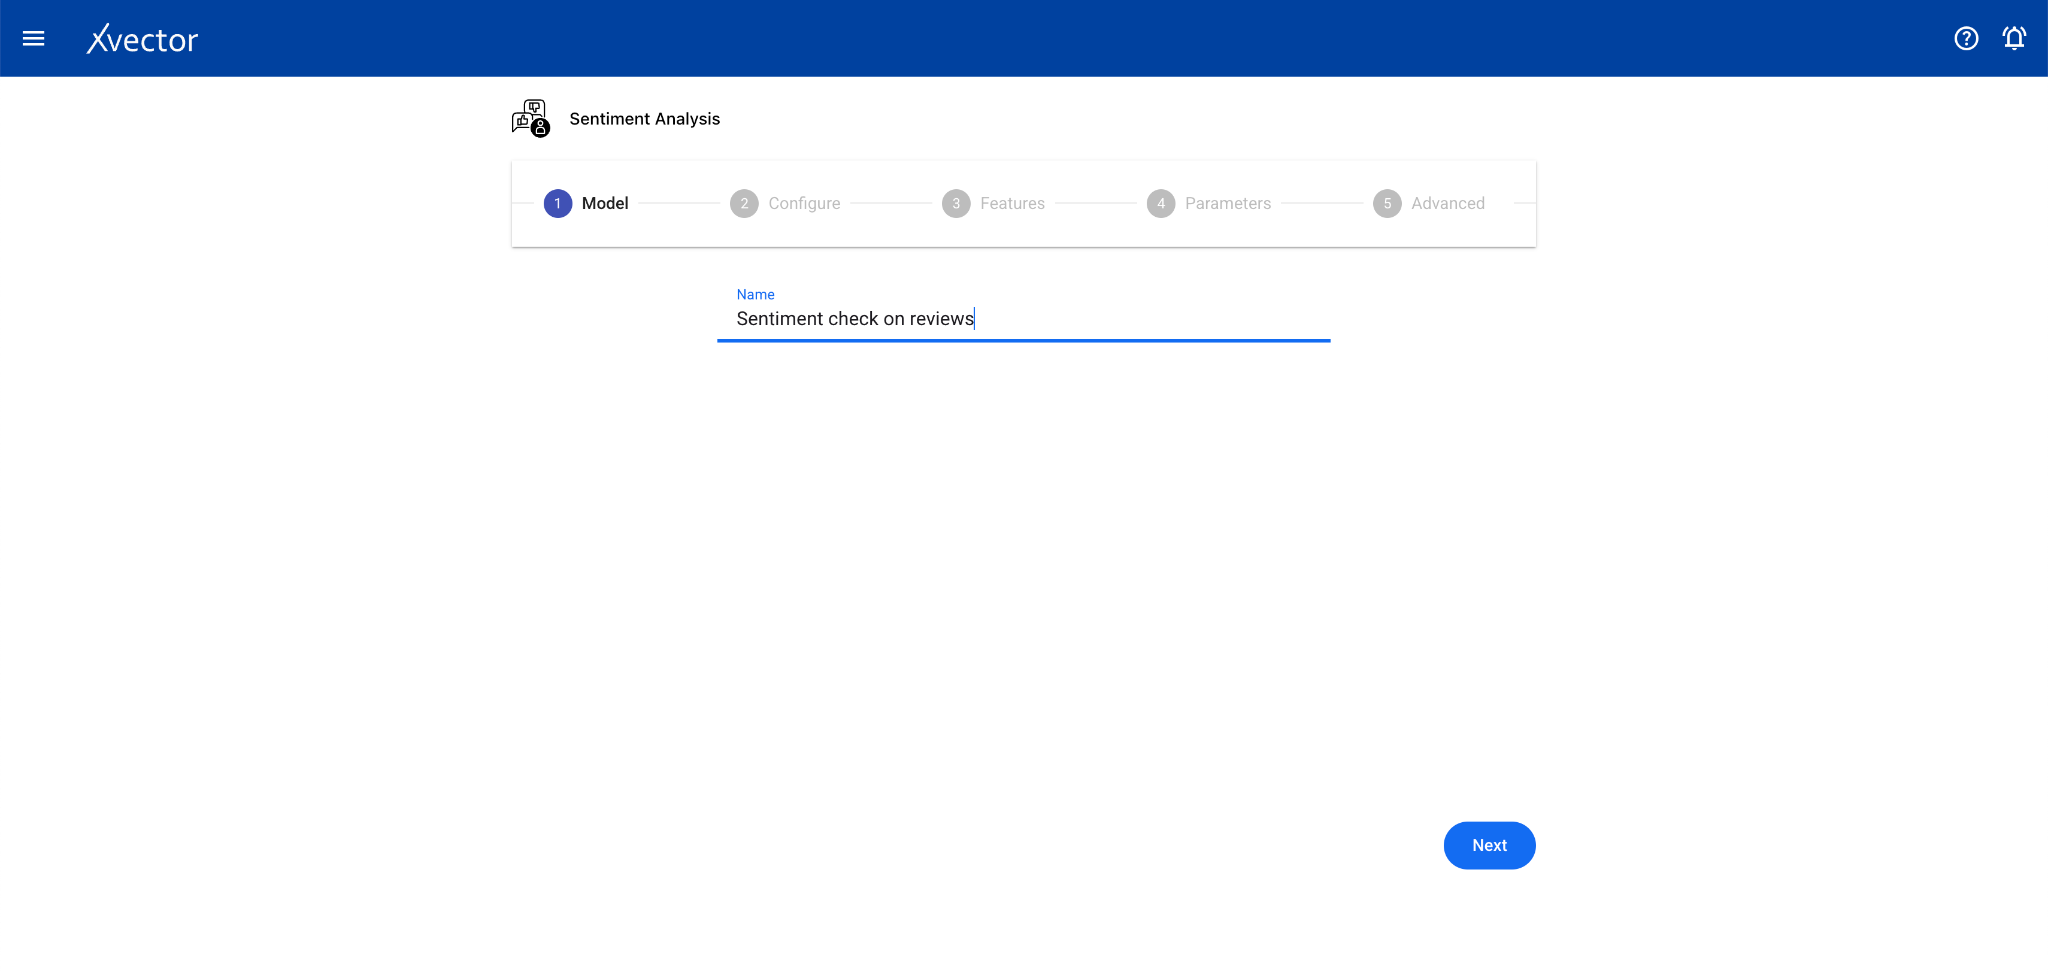
Sentiment Analysis
Section titled “Sentiment Analysis”Sentiment Analysis identifies and classifies the emotional tone of text data. It’s a subfield of NLP used to understand the attitude, opinion, or general feeling expressed in text.
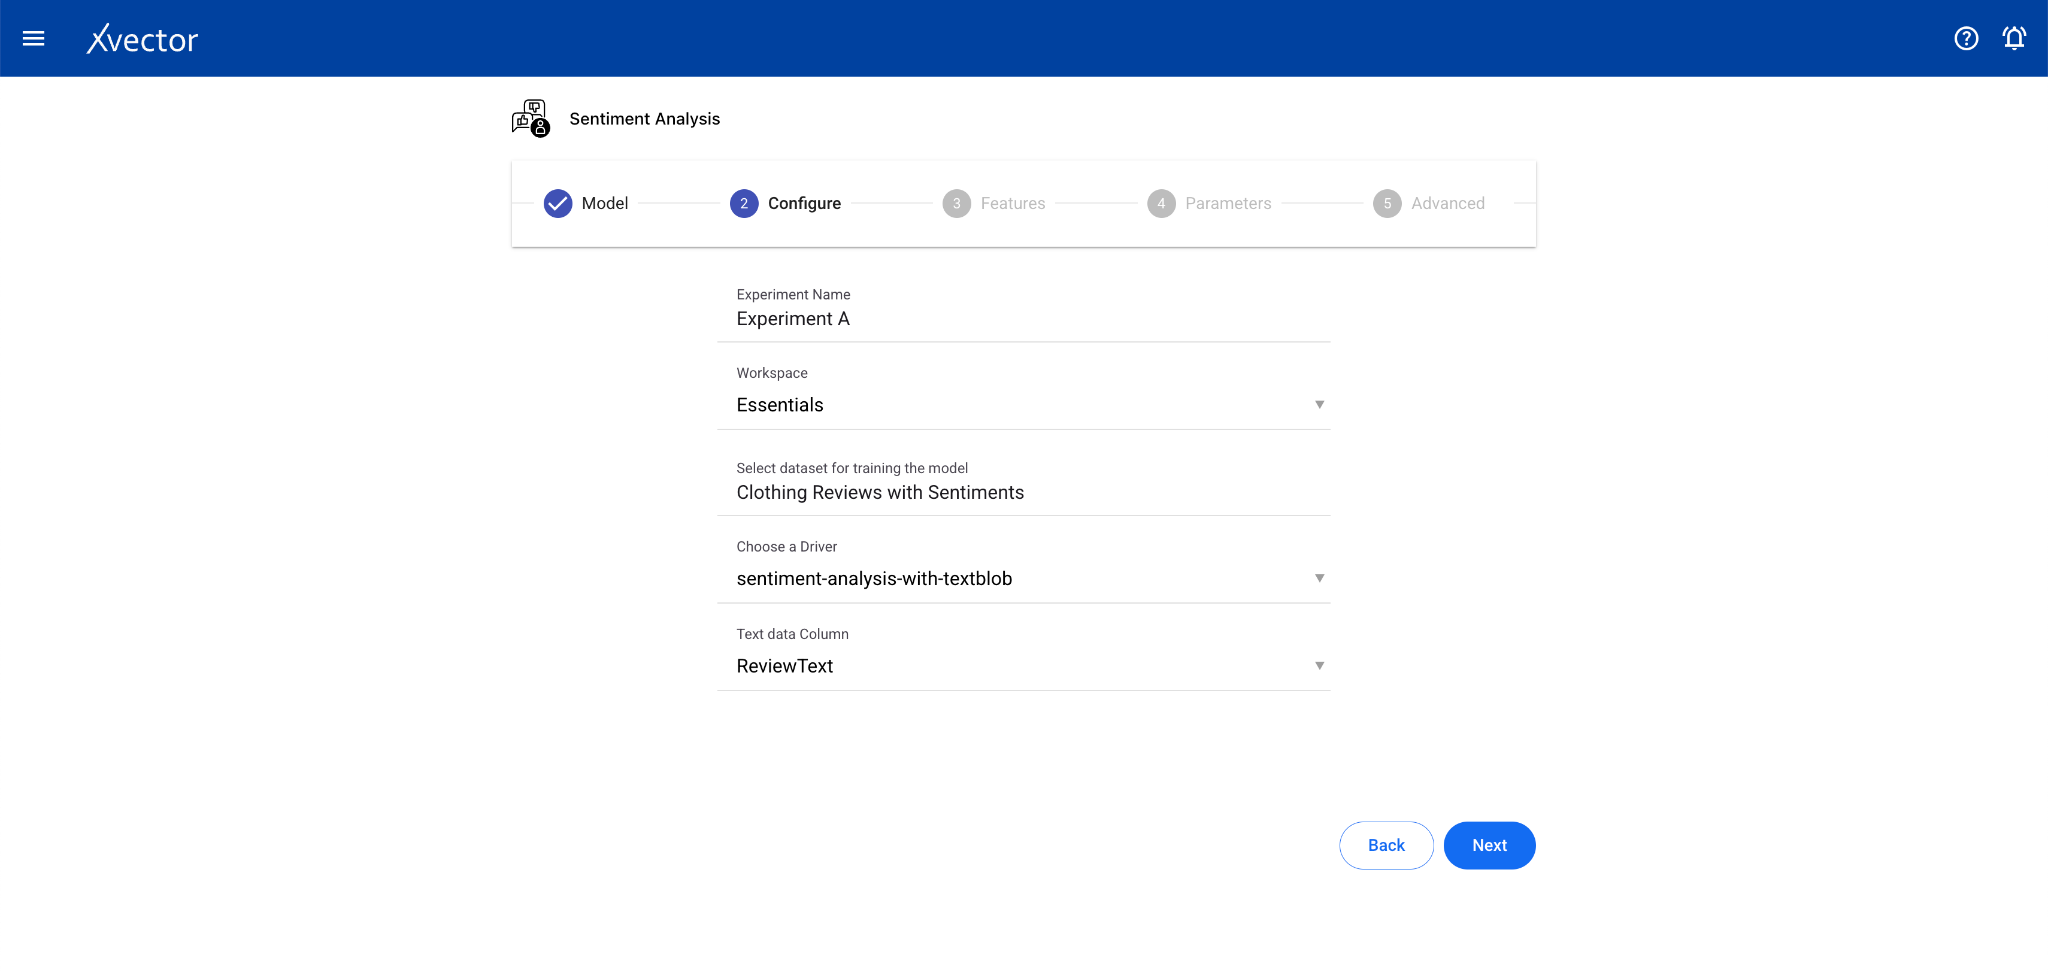
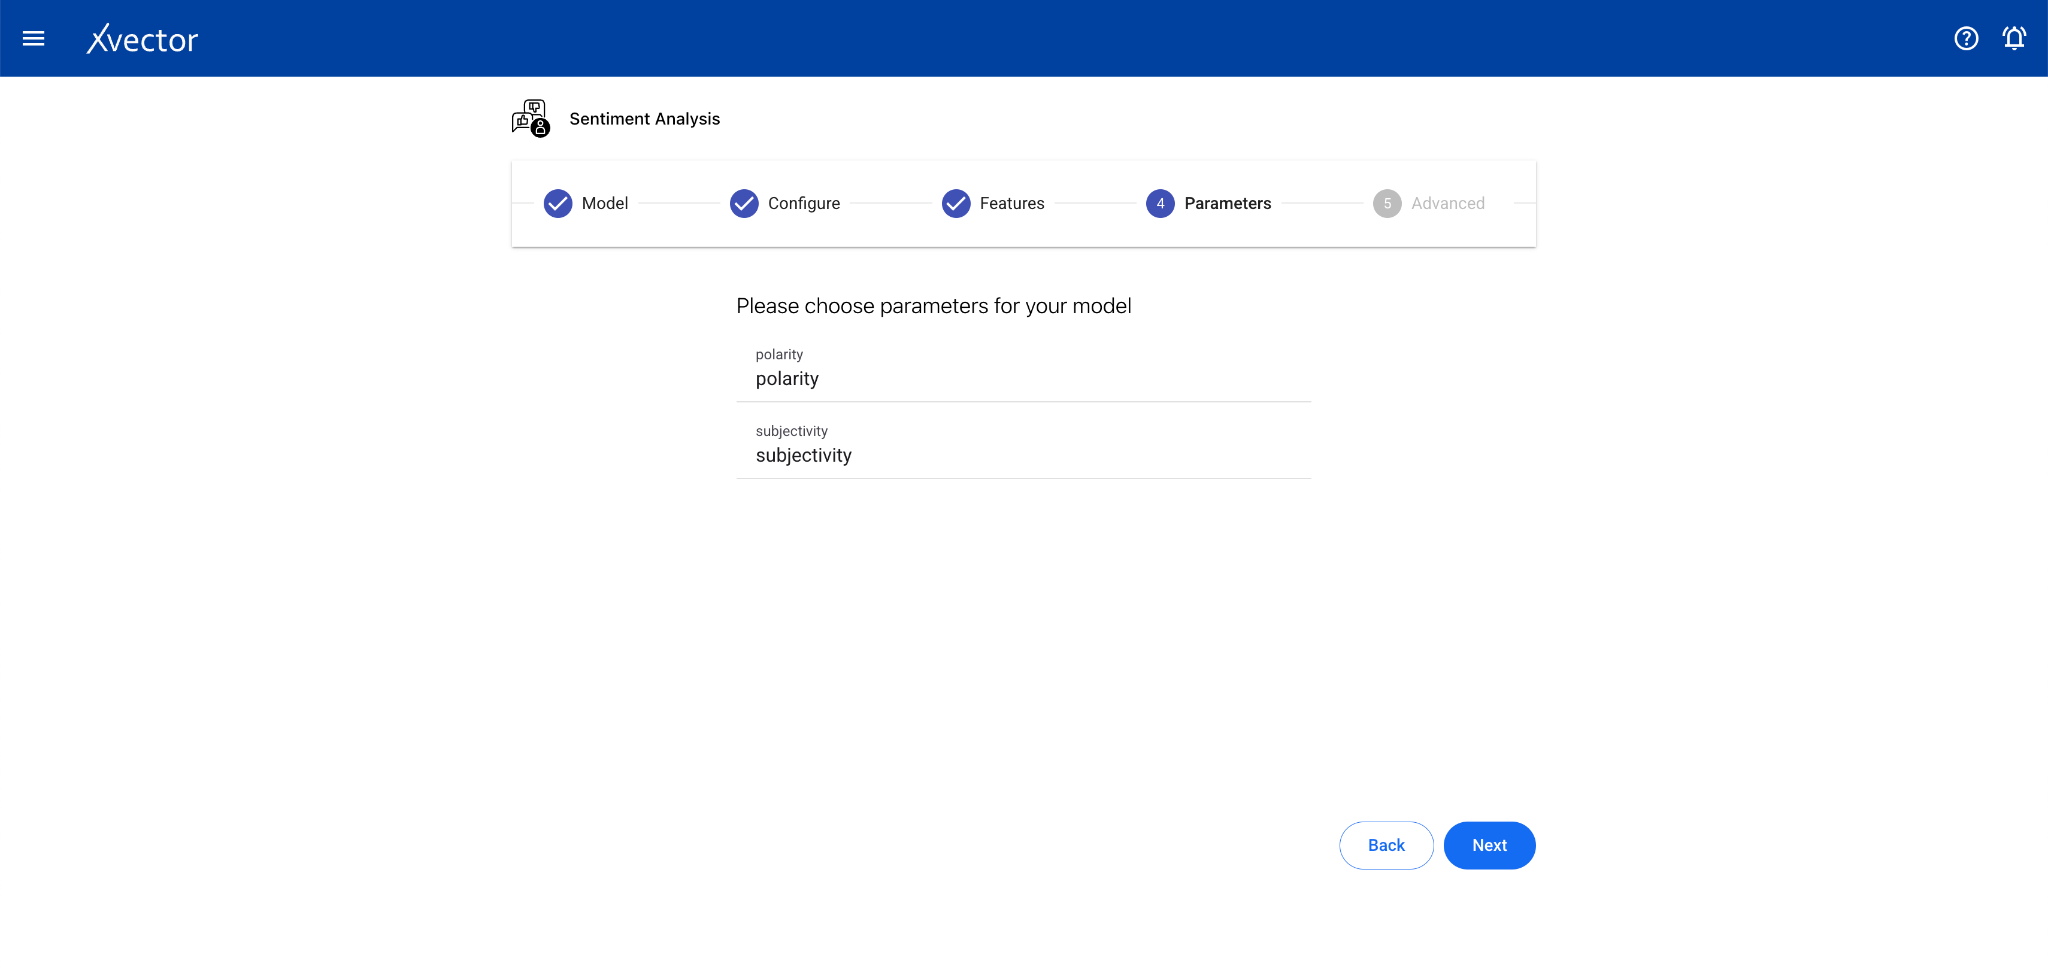
Configure steps:
- Model — Provide a name for the model
- Configure — Experiment name, workspace, select dataset, choose a driver, select the Text Data Column
- Features — This step can be skipped for sentiment analysis drivers (especially pre-trained ones)

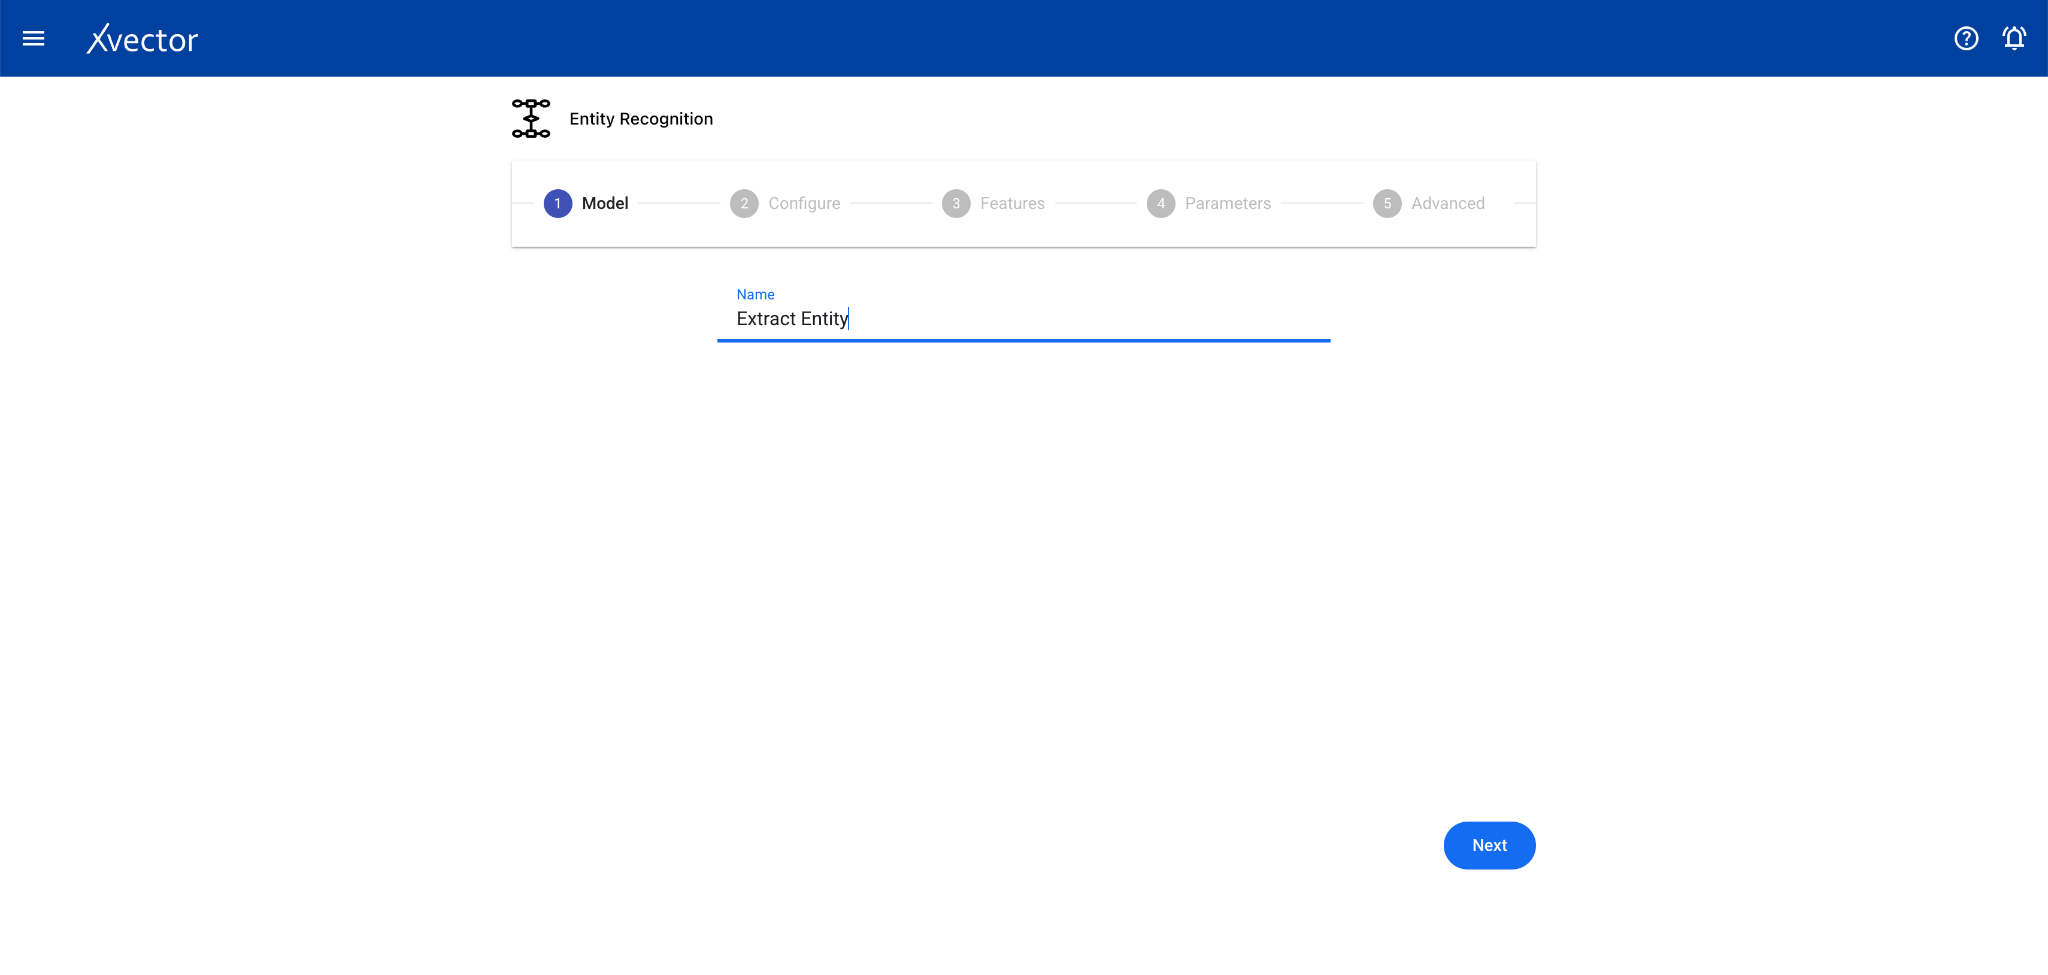
Entity Recognition
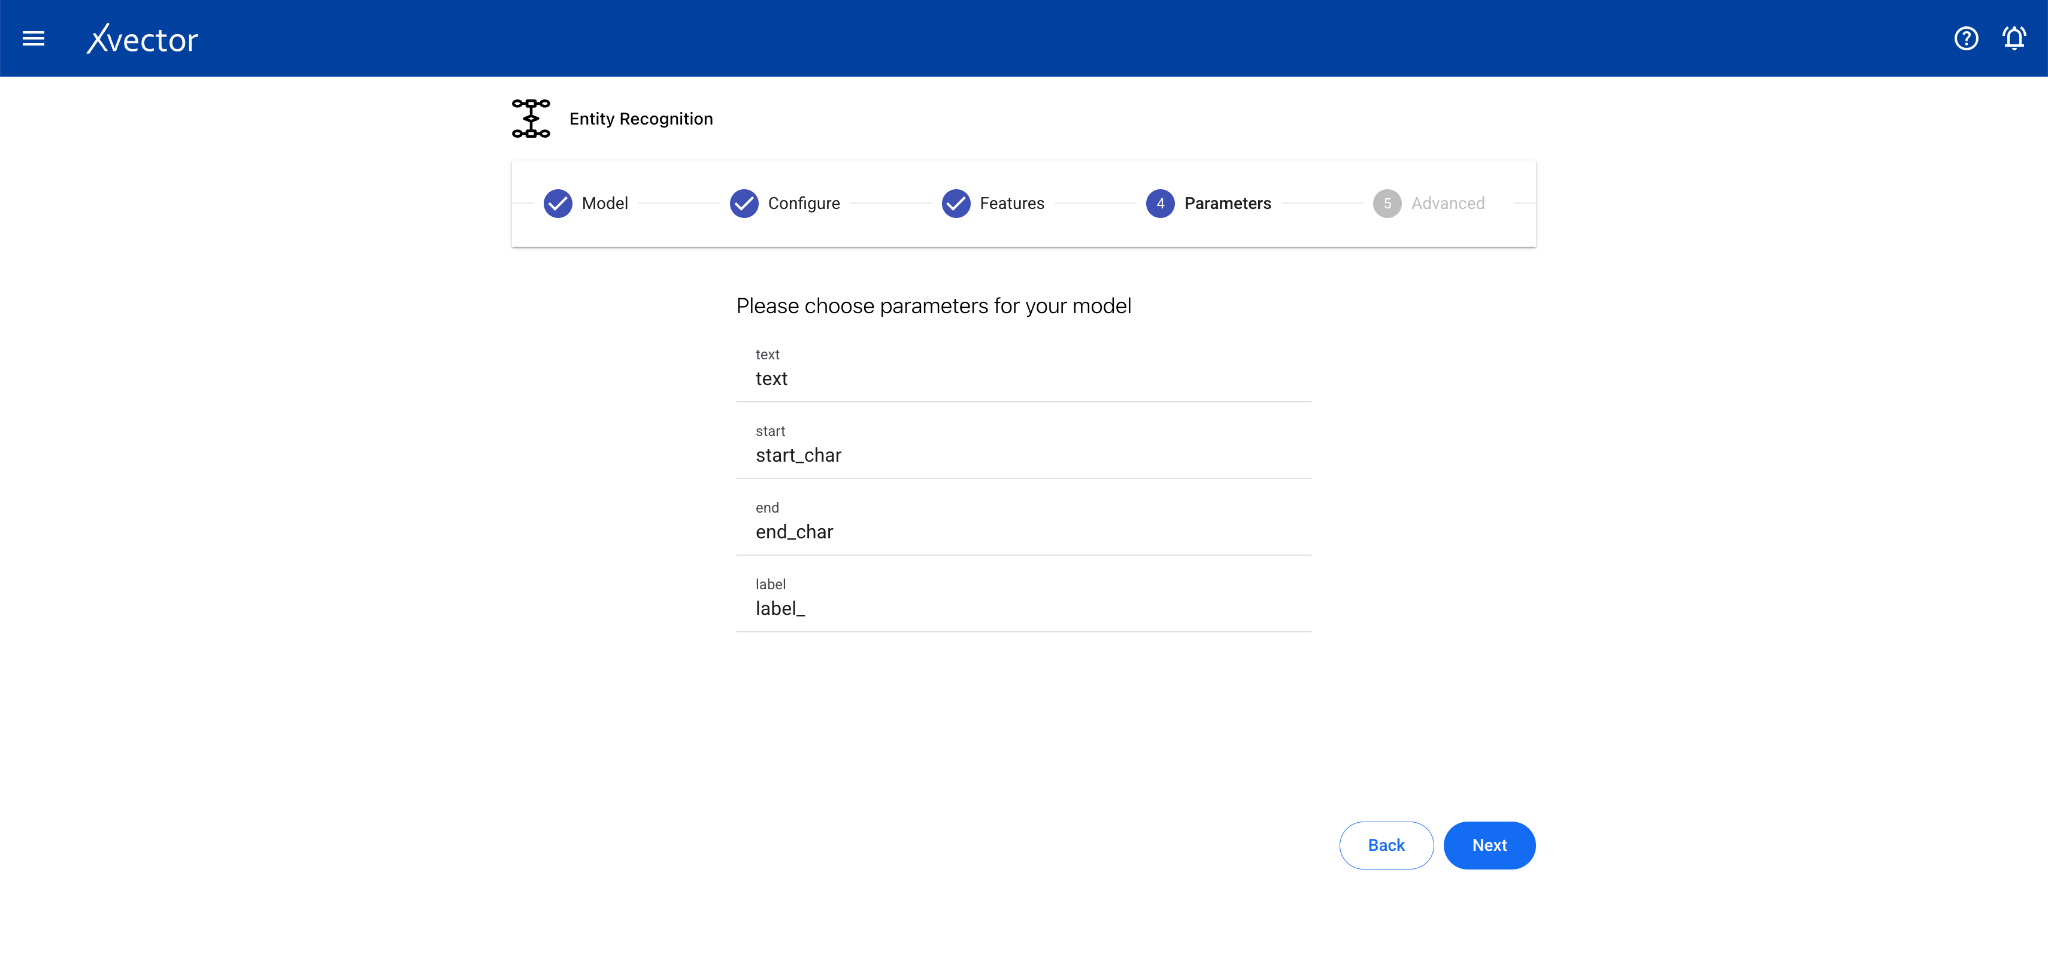
Section titled “Entity Recognition”Entity Recognition (NER) is a subfield of NLP that identifies and classifies essential elements in text data such as names, locations, organizations, dates, and other entities.
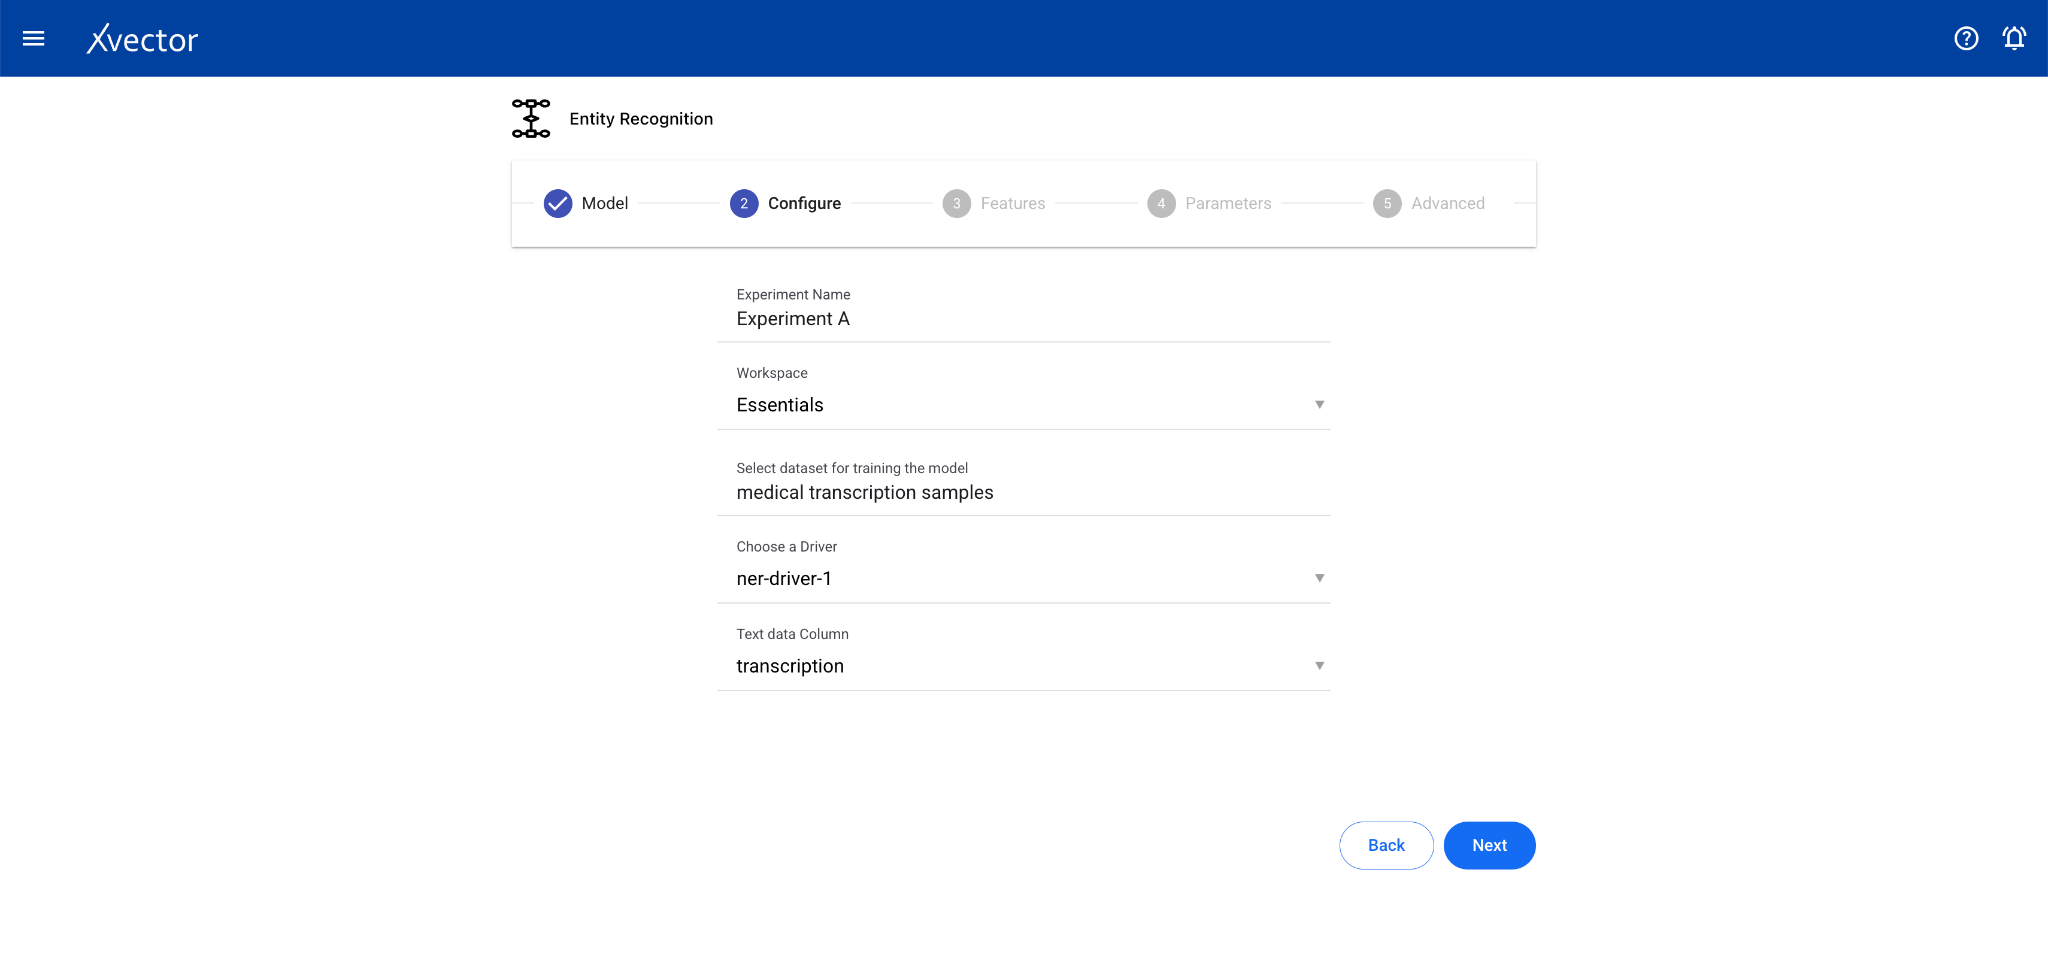
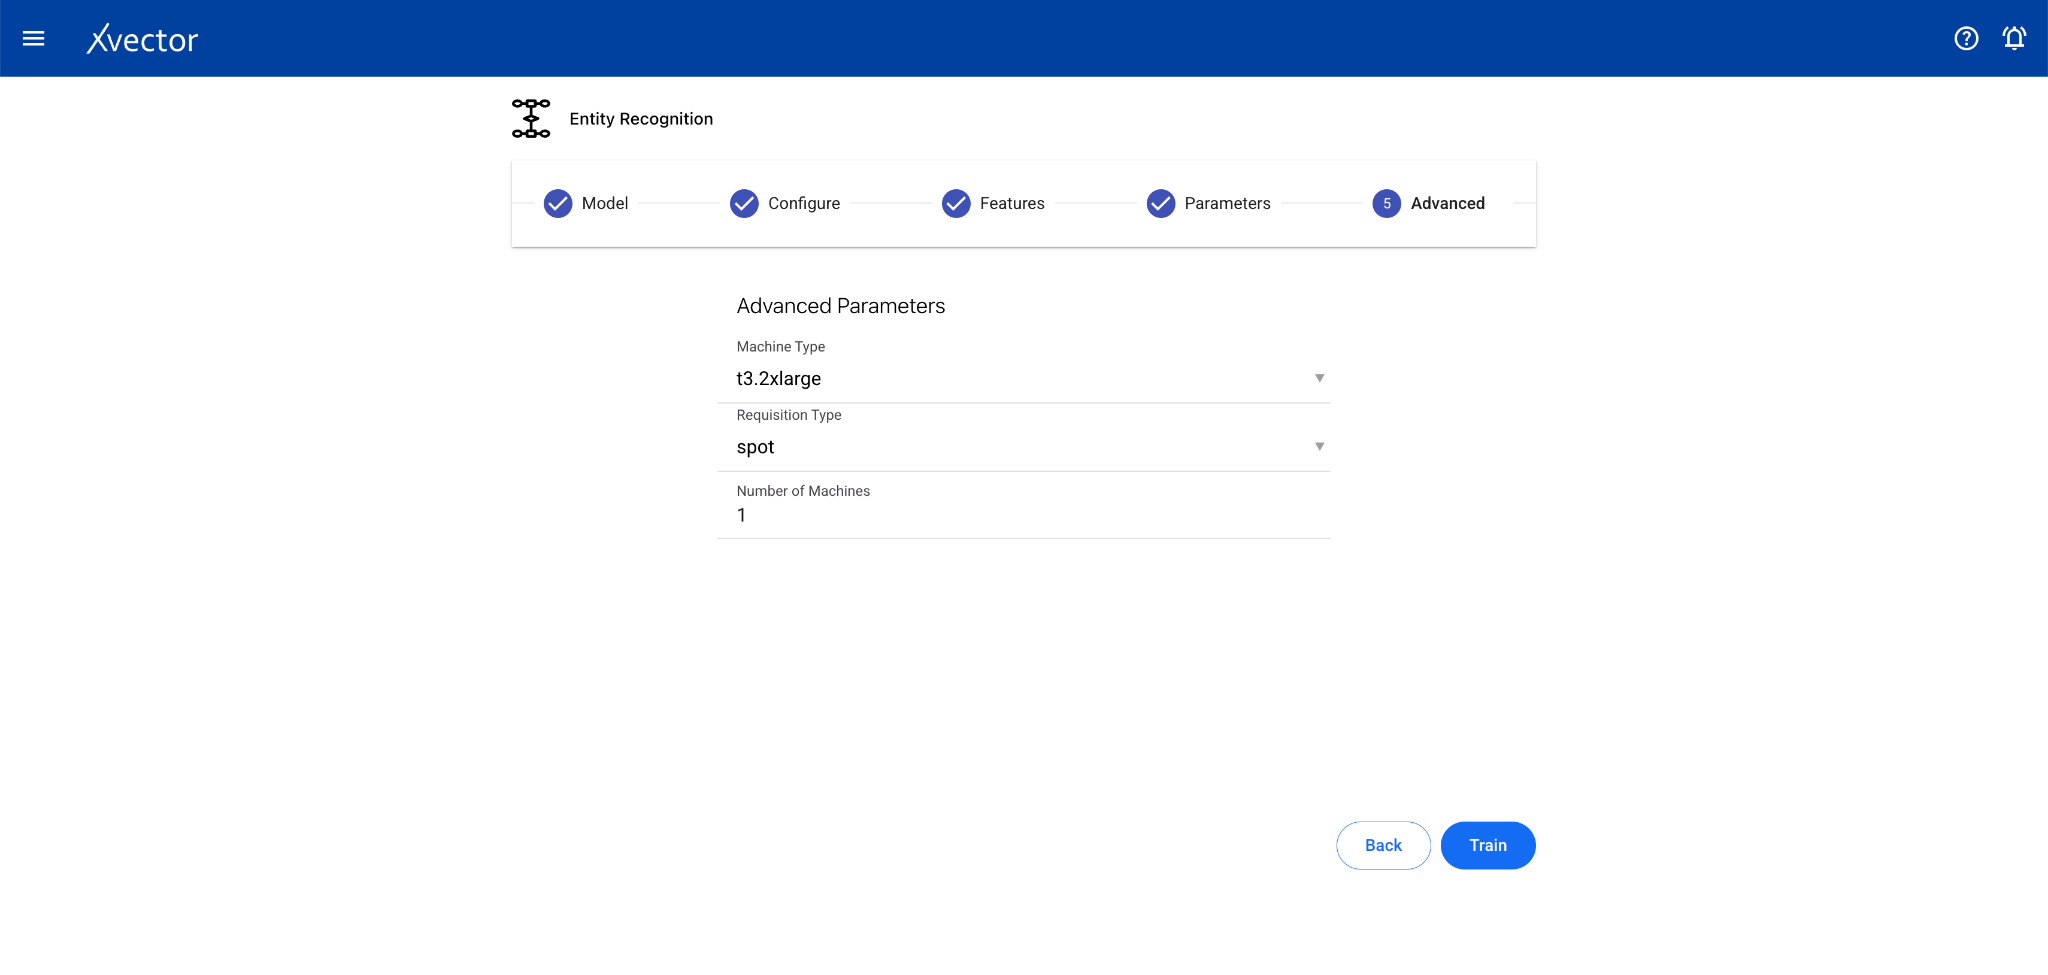
Configure steps:
- Model — Provide a name for the model
- Configure — Experiment name, workspace, select dataset, choose a driver, select the Text Data Column
- Features — This step can be skipped for entity recognition drivers
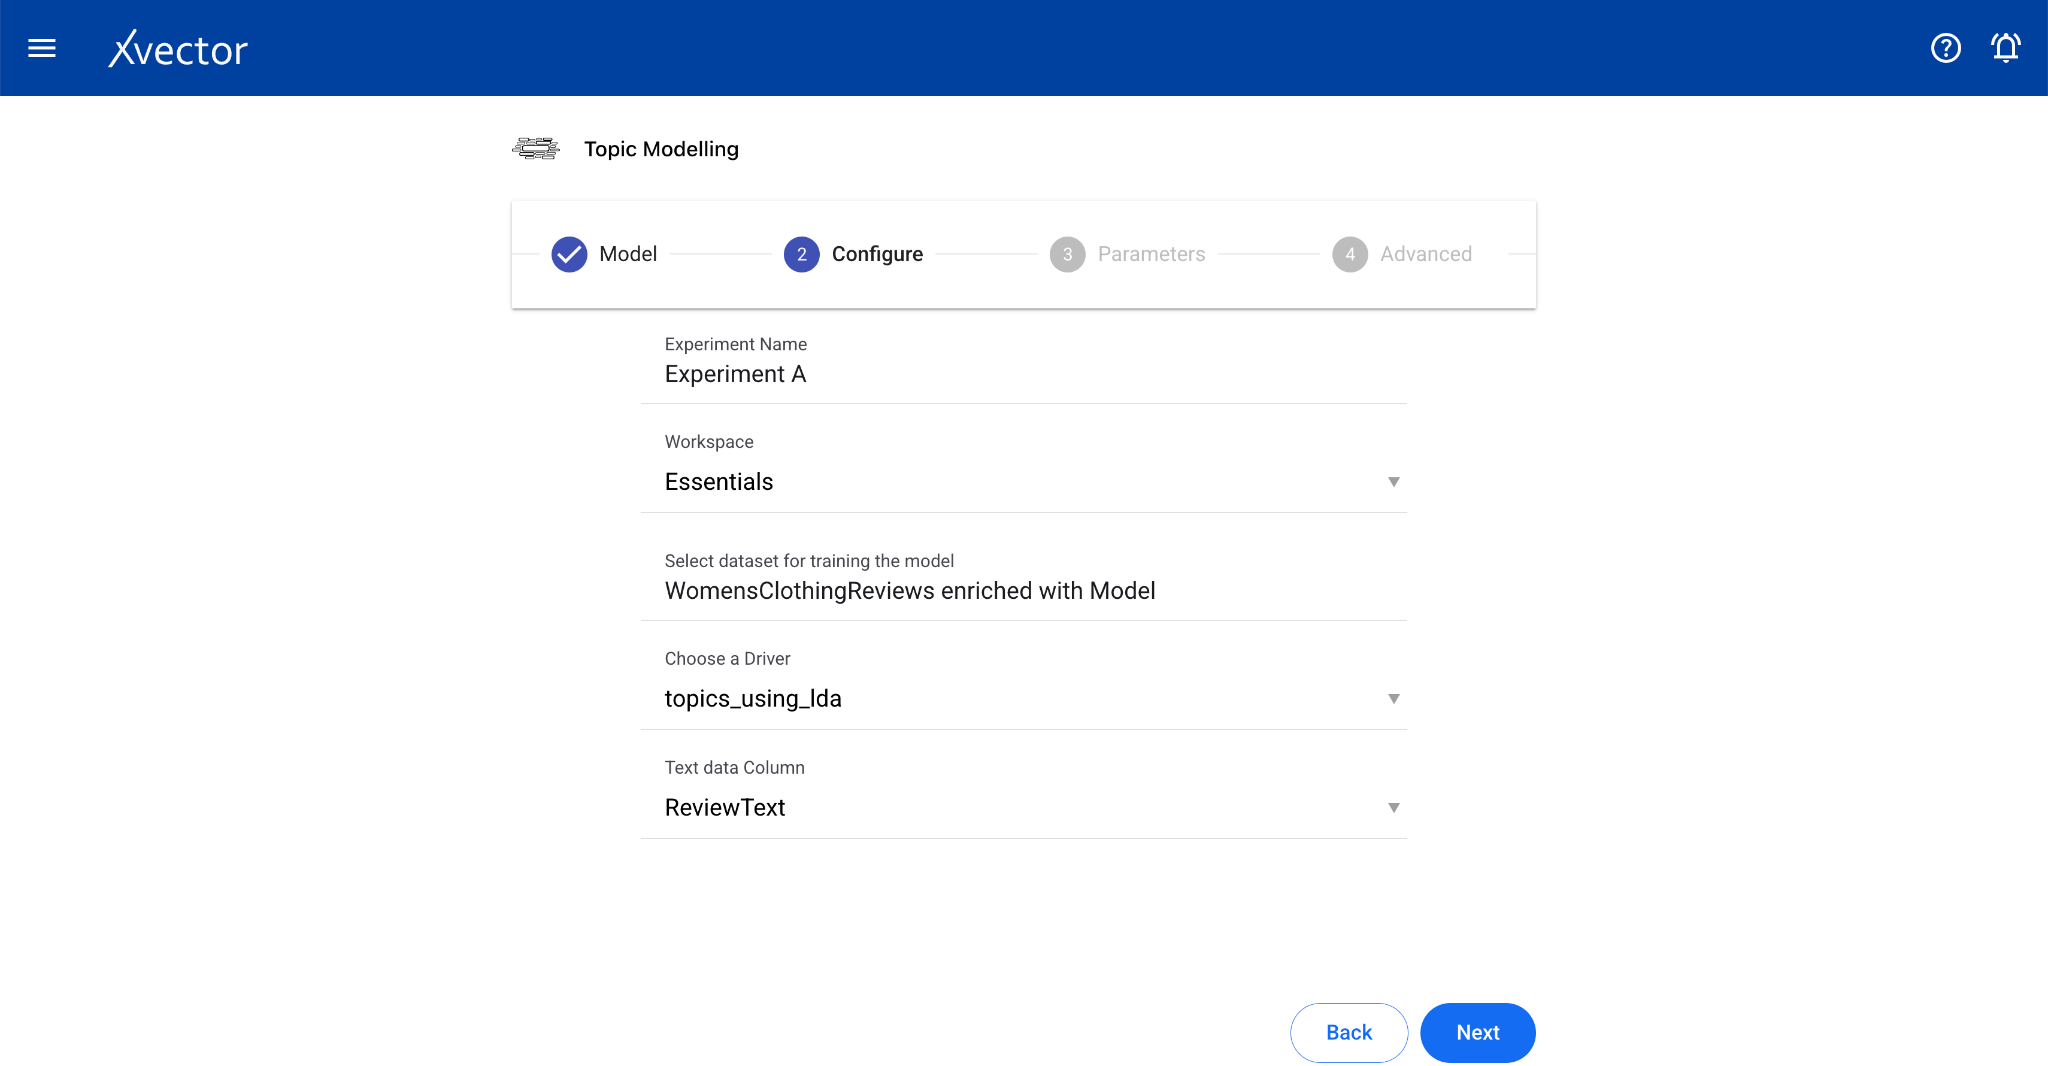
Topic Modeling
Section titled “Topic Modeling”Topic modeling helps analyze extensive collections of text data to discover hidden thematic patterns. The algorithm scans text data, identifying clusters of frequently co-occurring words and grouping them into coherent topics.
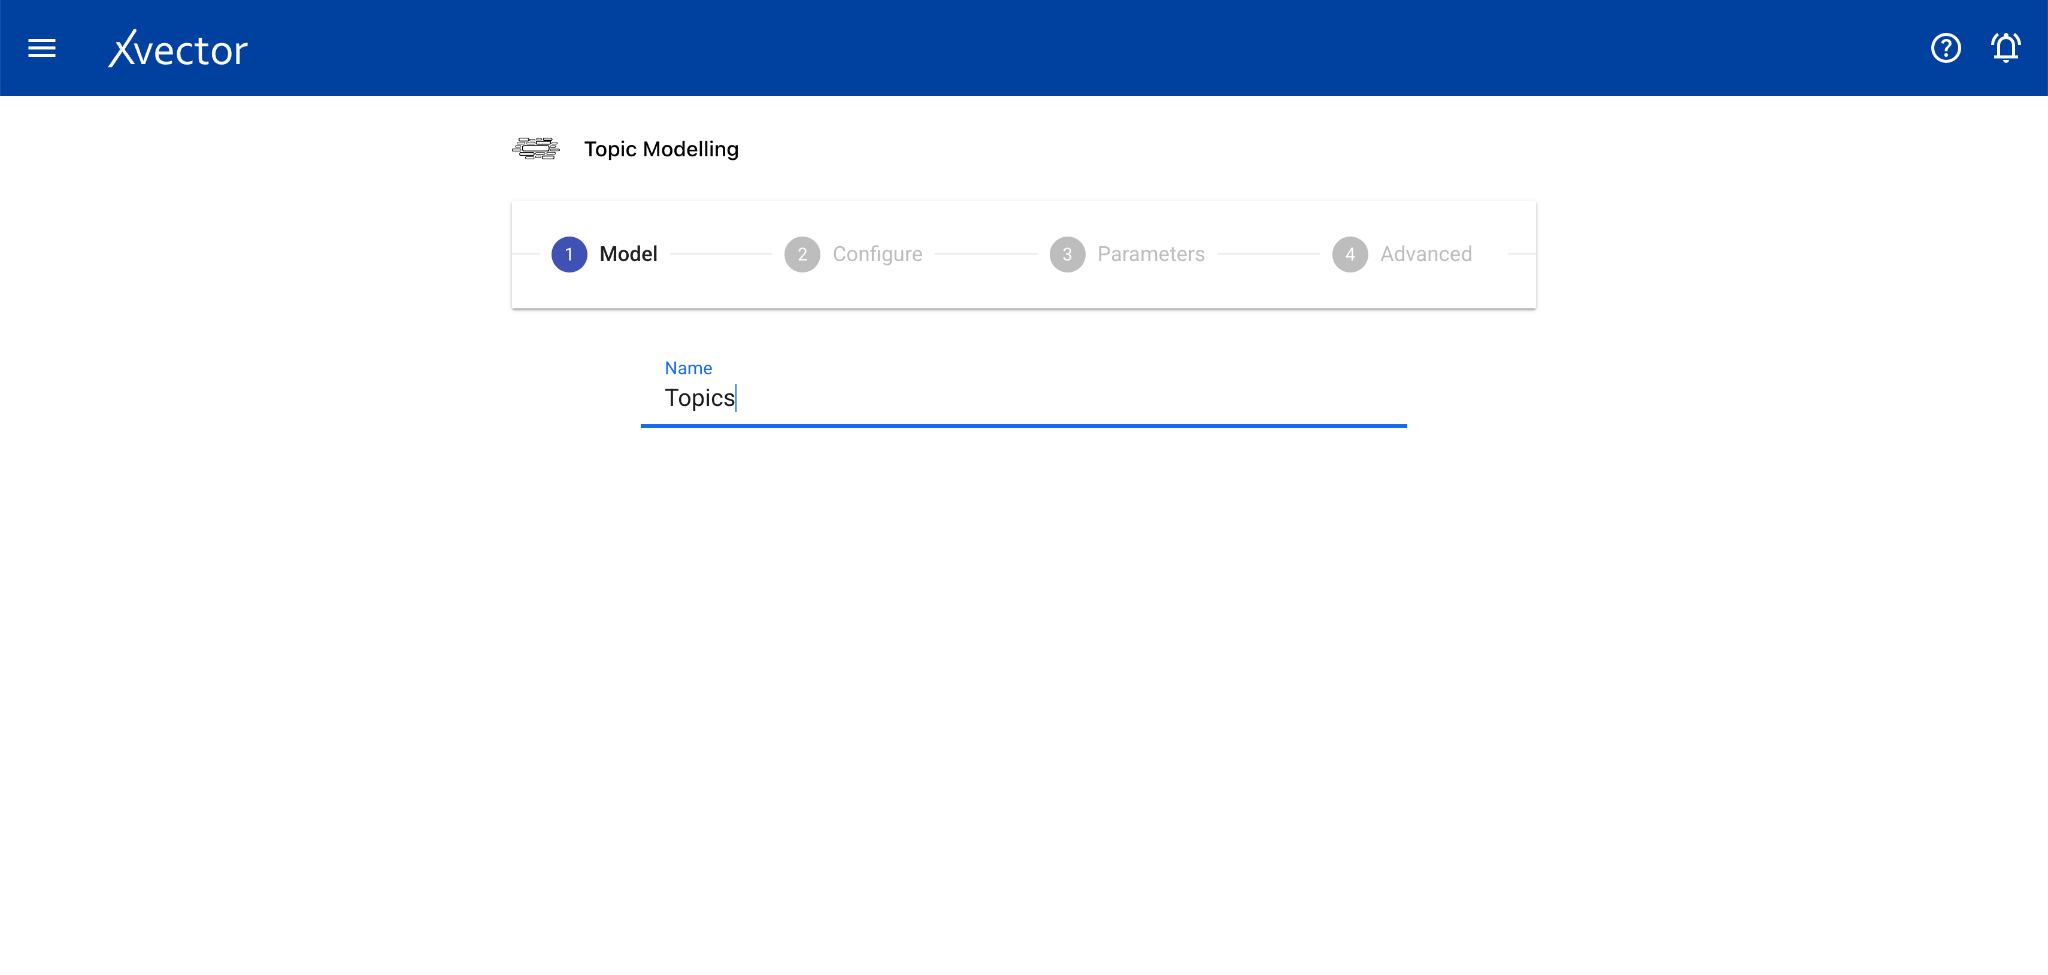
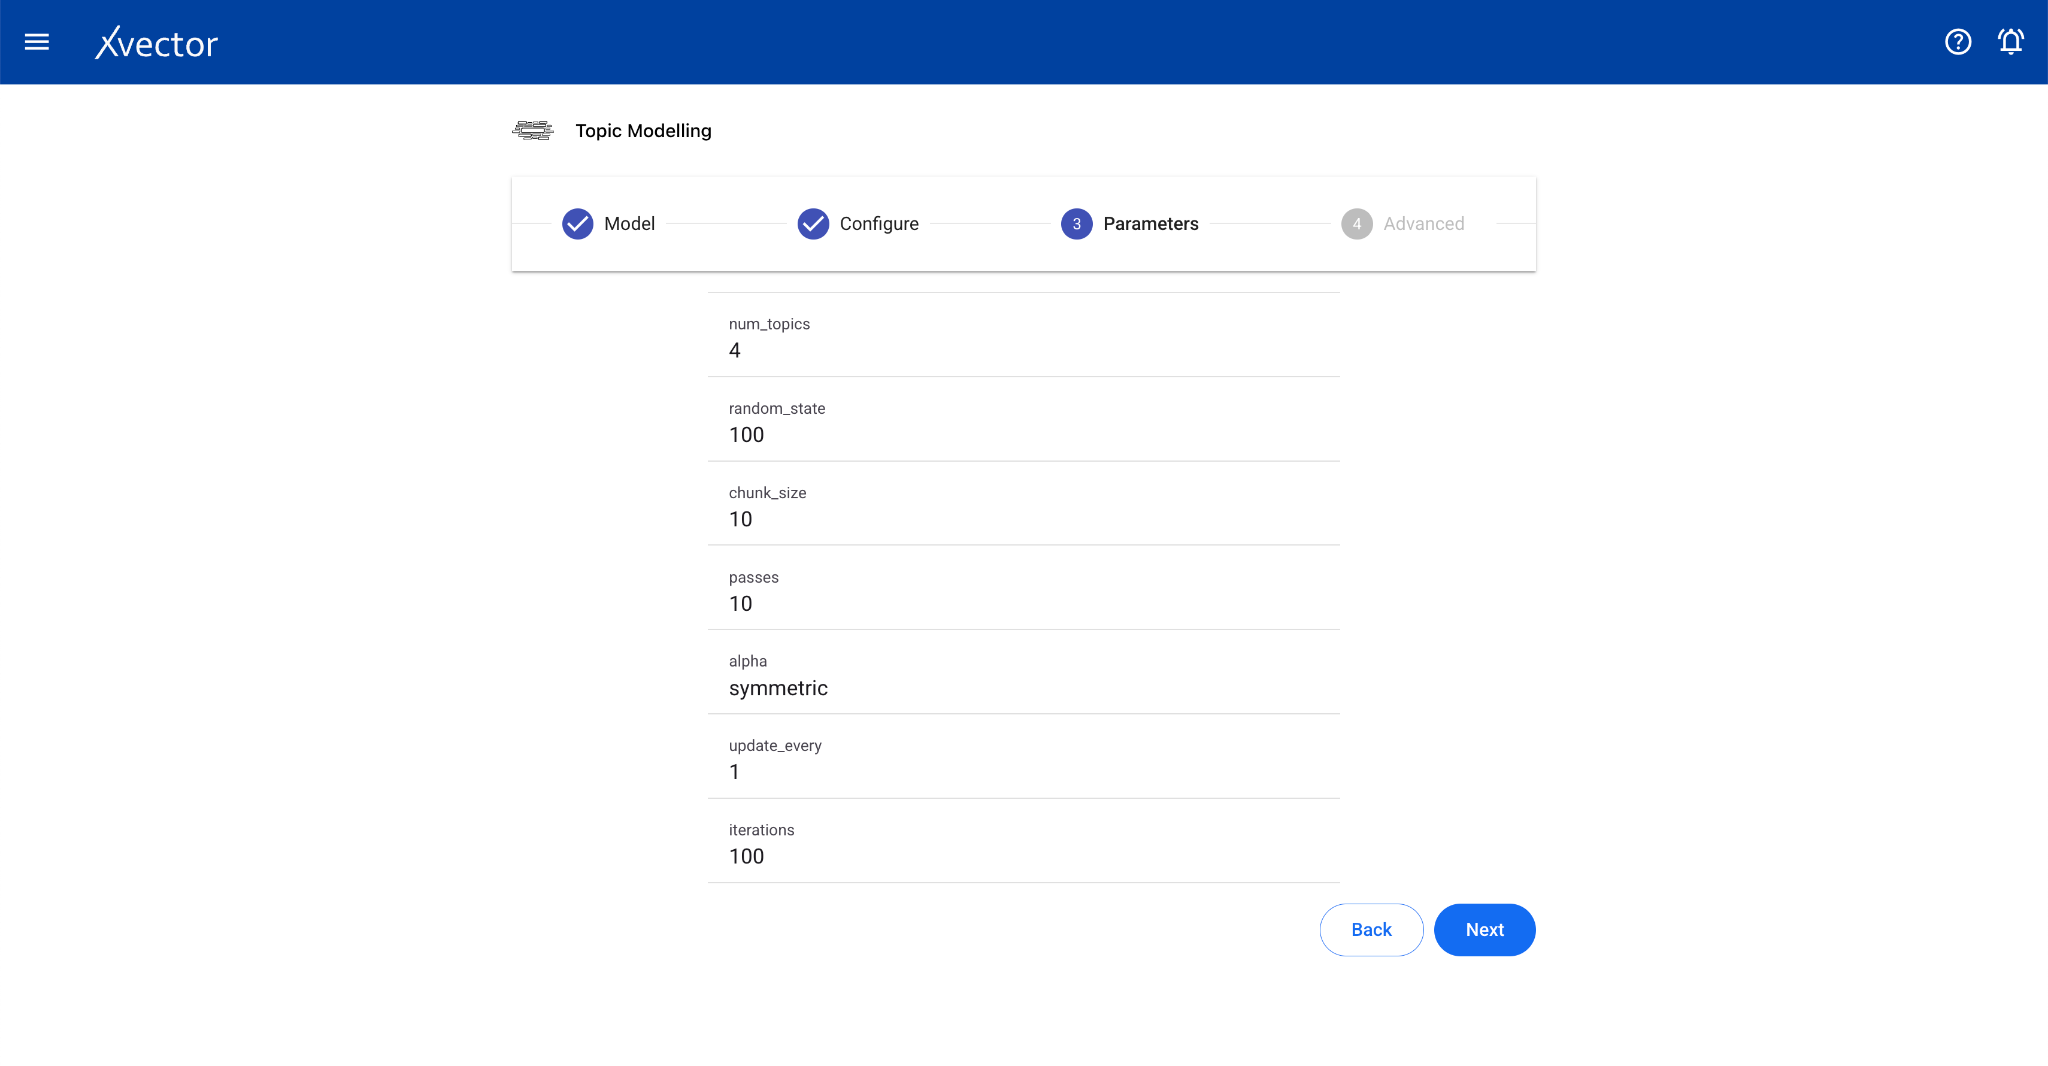
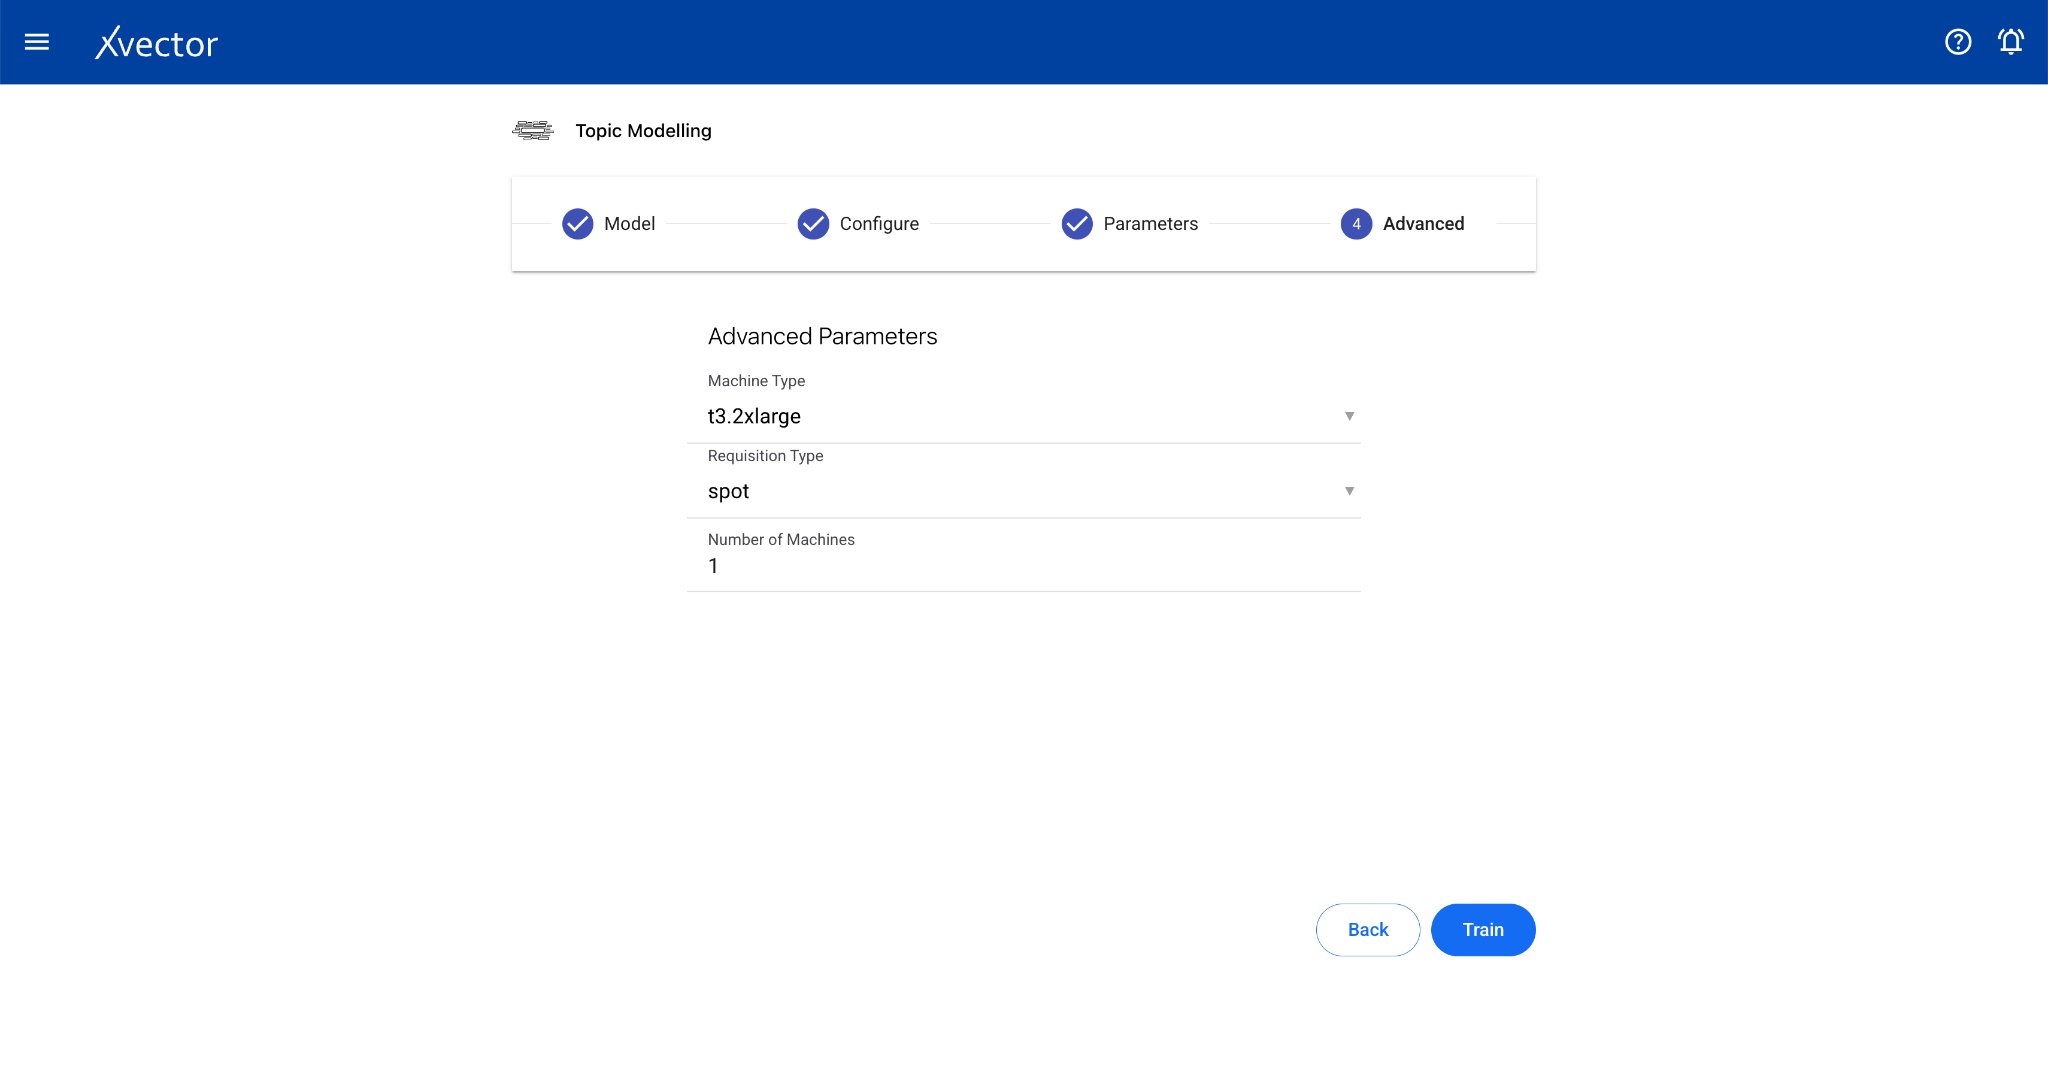
Configure steps:
- Model — Provide a name for the model
- Configure — Experiment name, workspace, select dataset, choose a driver, select the Text Data Column
- Features — Select relevant columns
App (Custom Model Driver)
Section titled “App (Custom Model Driver)”The app type allows users to use a custom model that doesn’t fall into any defined type. Users can define a driver that uses a combination of different algorithms.
Configure steps:
- Model — Provide a name for the model
- Configure — Experiment name, workspace, select dataset, choose a driver, select the Predictor Column
- Features — Select all columns used by the custom driver
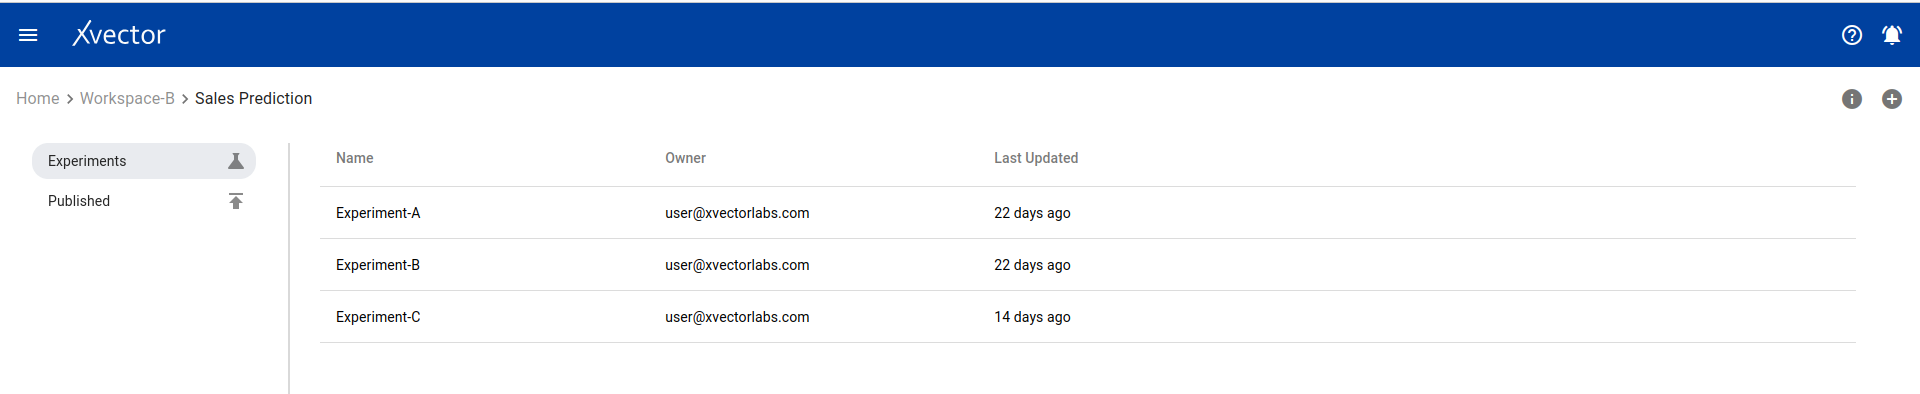
Experiment and Run Management
Section titled “Experiment and Run Management”Experiment View
Section titled “Experiment View”One can view a list of all experiments on the experiment view page. Options include: comments, timeline (action history), and adding new experiments.
Run View
Section titled “Run View”The run view page lists all runs for an experiment. Available options:
- Comments — Comment on runs
- Timeline — View action history
- Add a new run — Click the (+) icon
- View — View the model output report
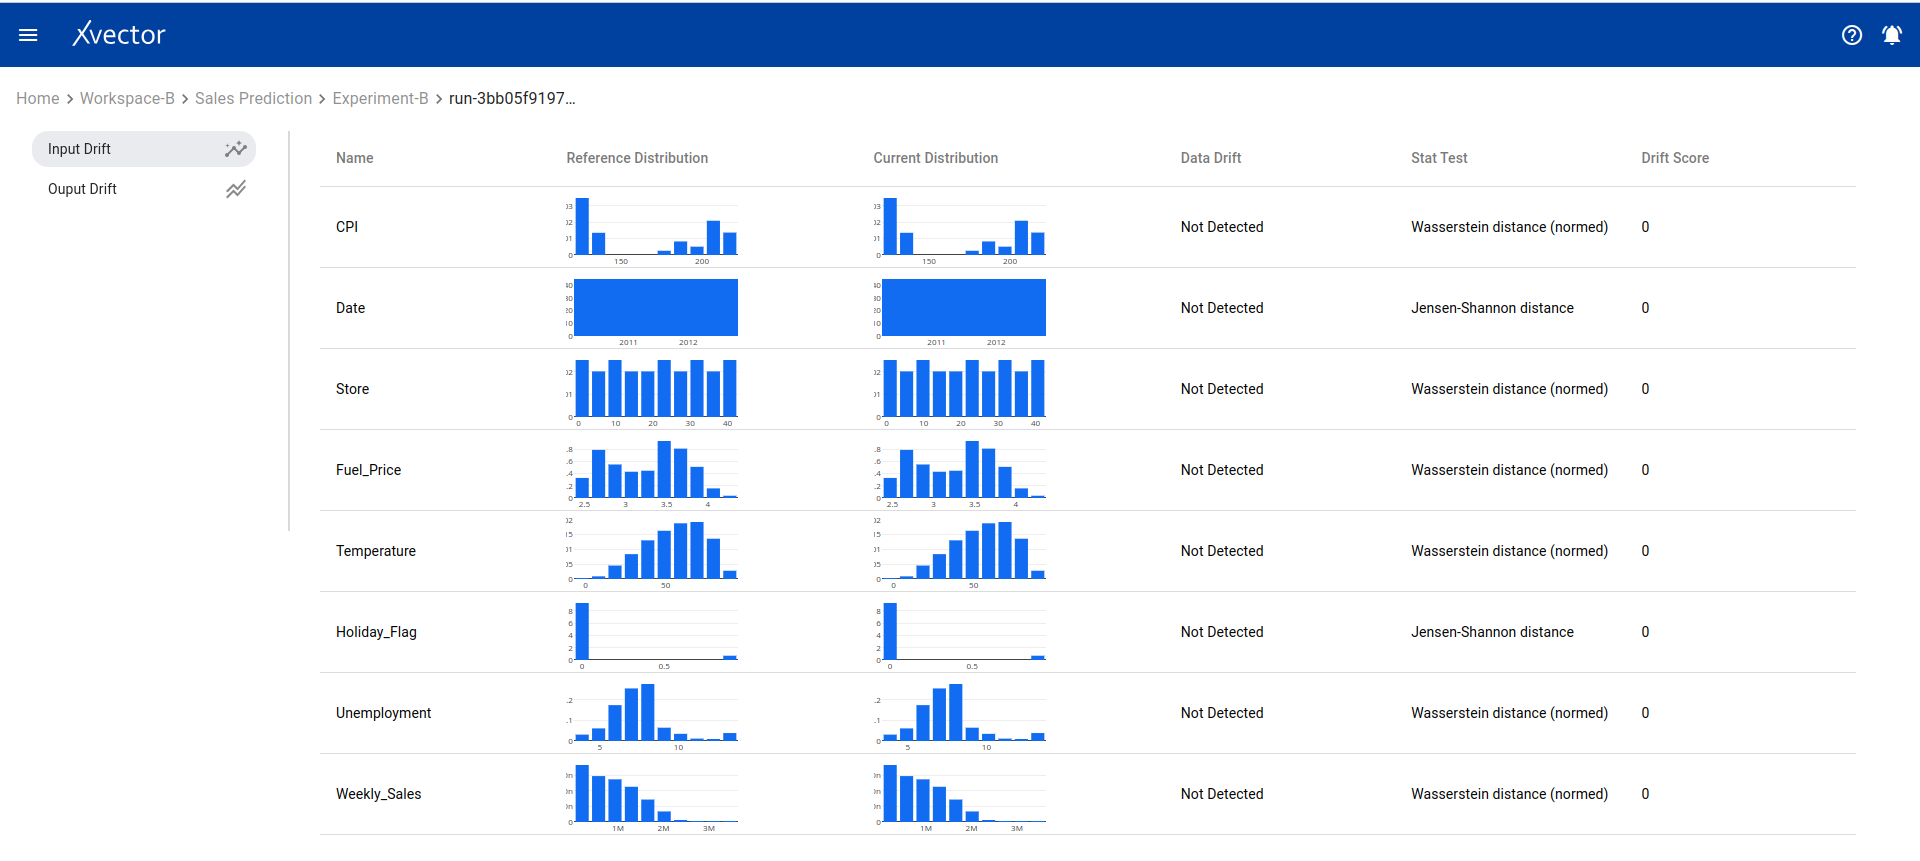
- Drifts — Display drift report of input data
- Build + Deploy — Build and deploy the model run, creating a prediction endpoint
- Delete — Delete the run
- Predict — Test the prediction endpoint with sample data
- Copy URL — Copy the model prediction URL
- Shutdown — Shut down deployed model
- Token — Authentication token for the model predict API
View — Model output report:
Drifts — Data drift analysis:
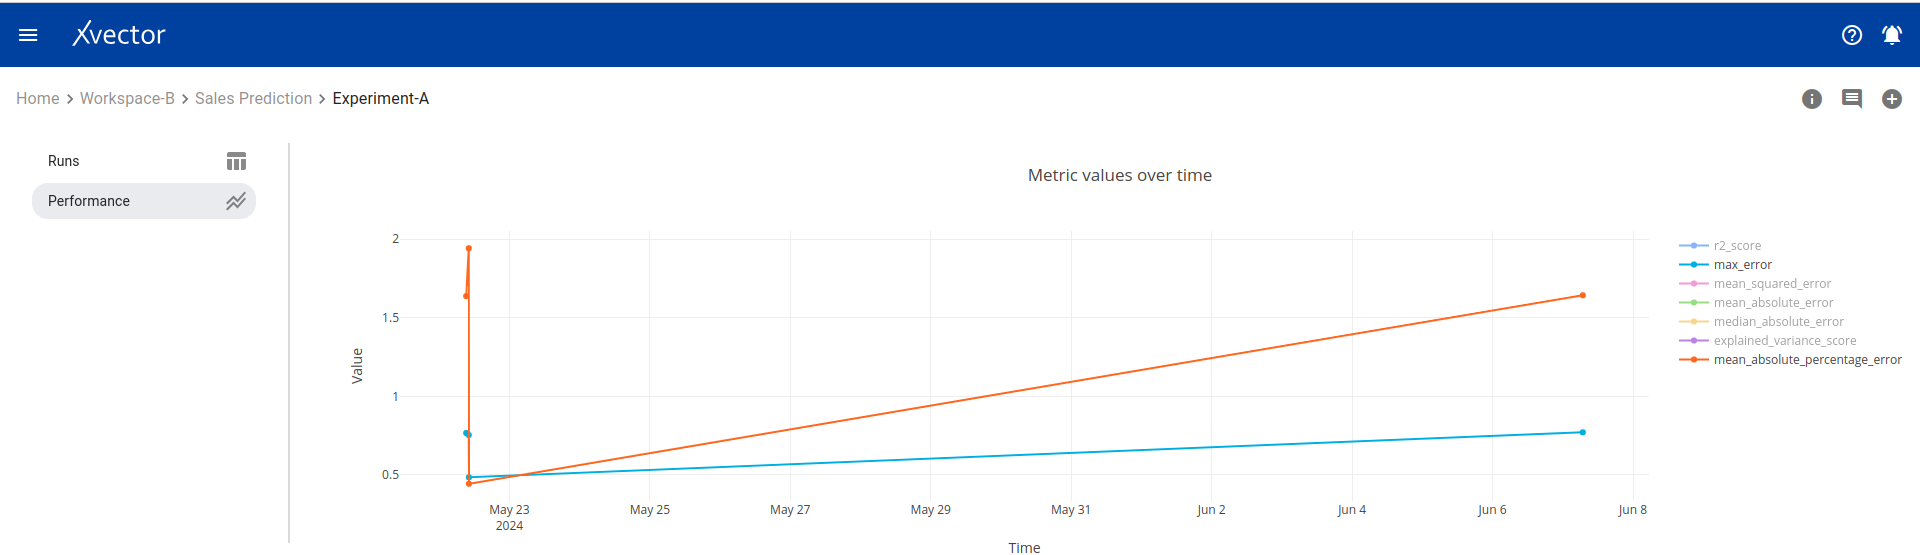
Performance — Model performance metrics:
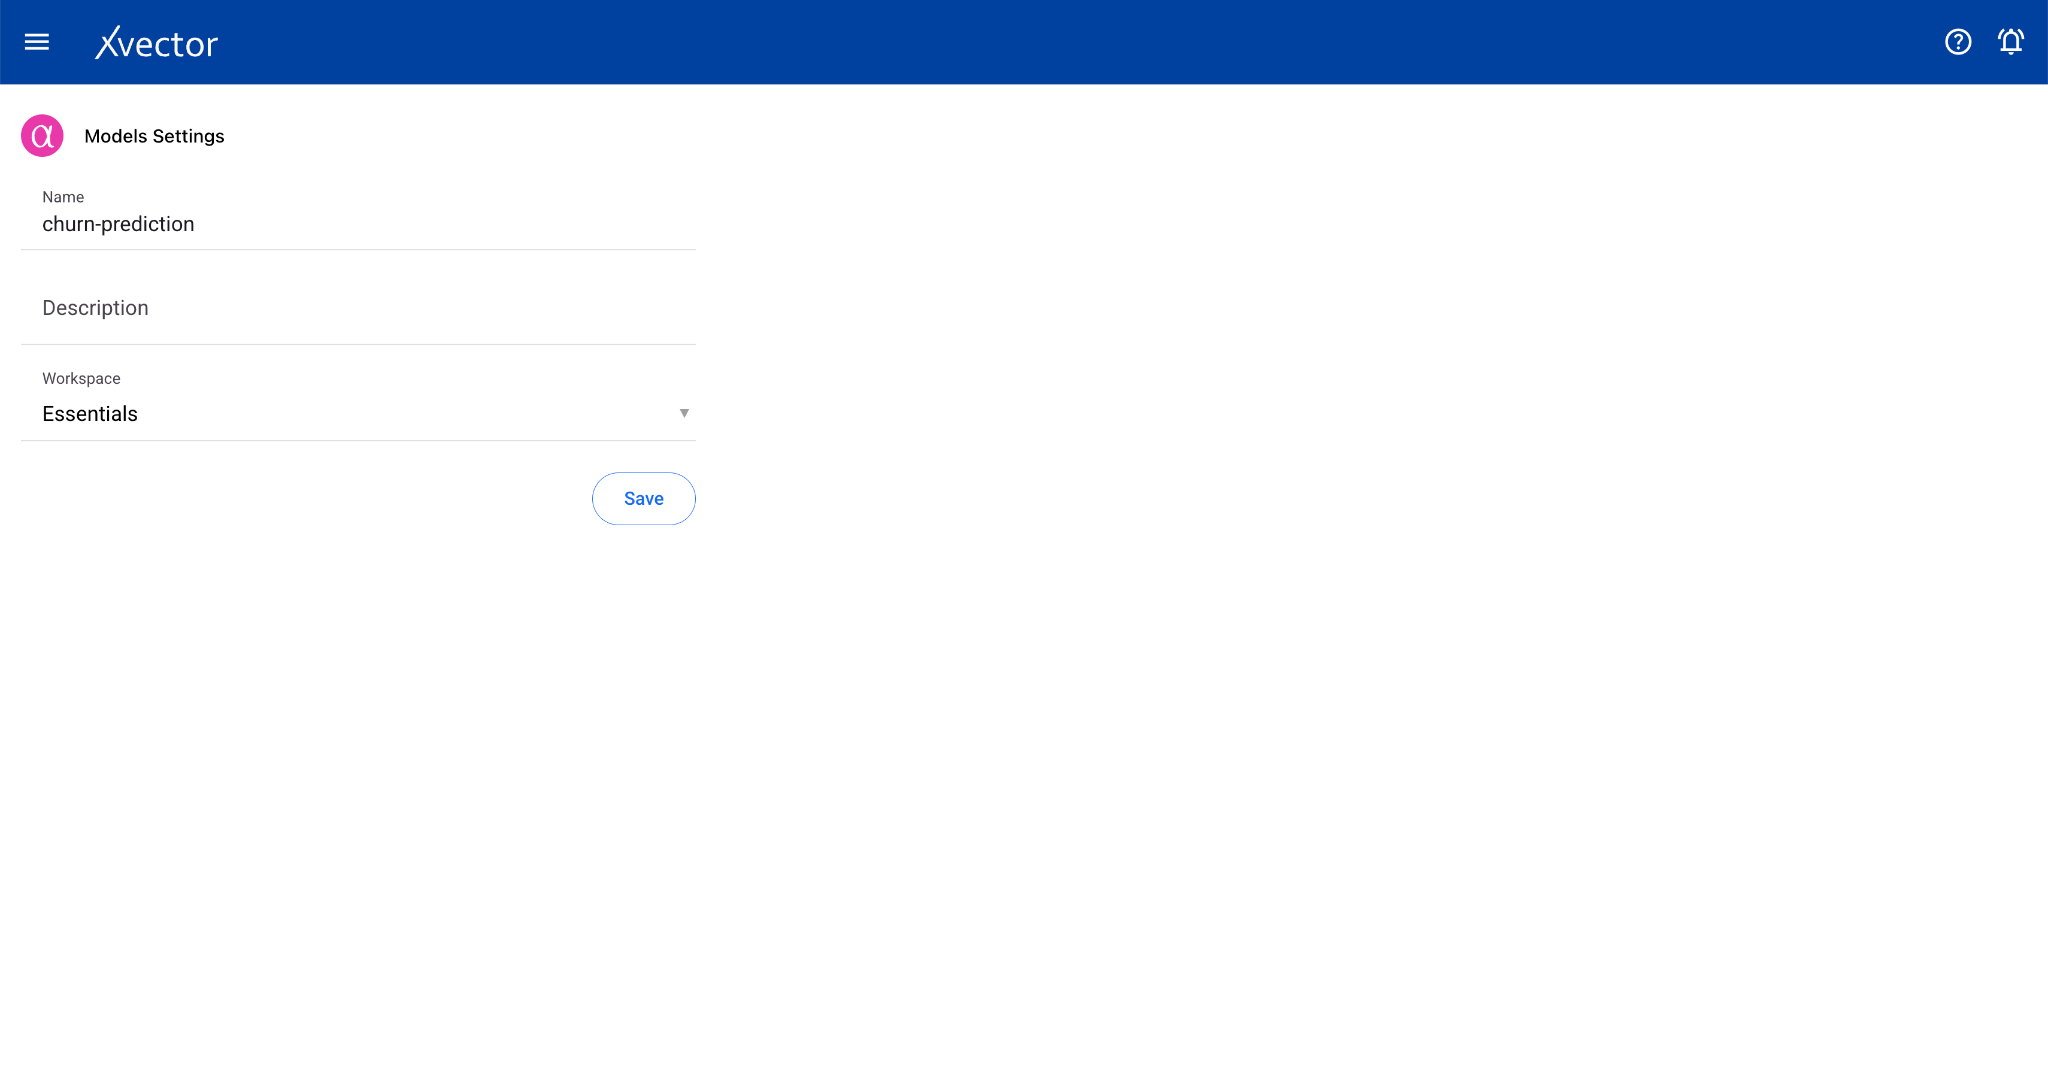
Updating a Model
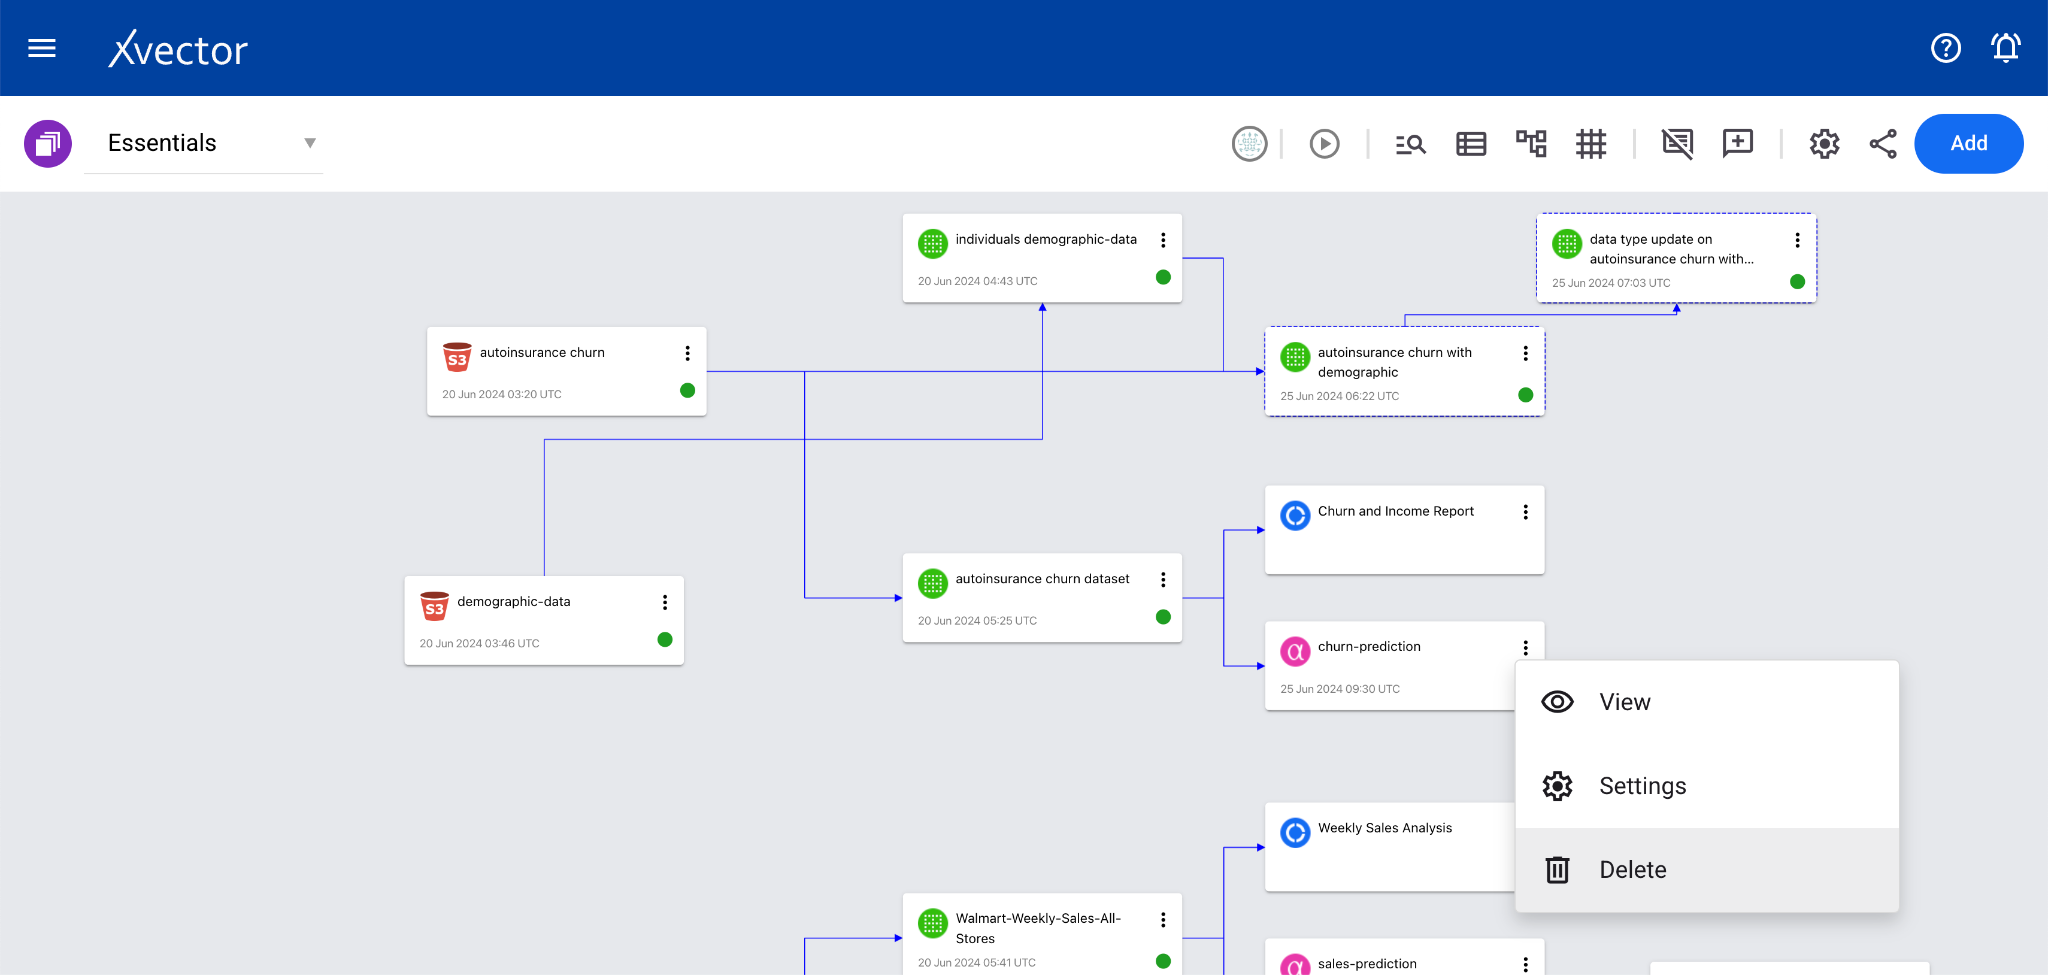
Section titled “Updating a Model”To update model details, open the settings pane by selecting Settings from the menu options of model cards in the workspace. Modify the data and click Save.
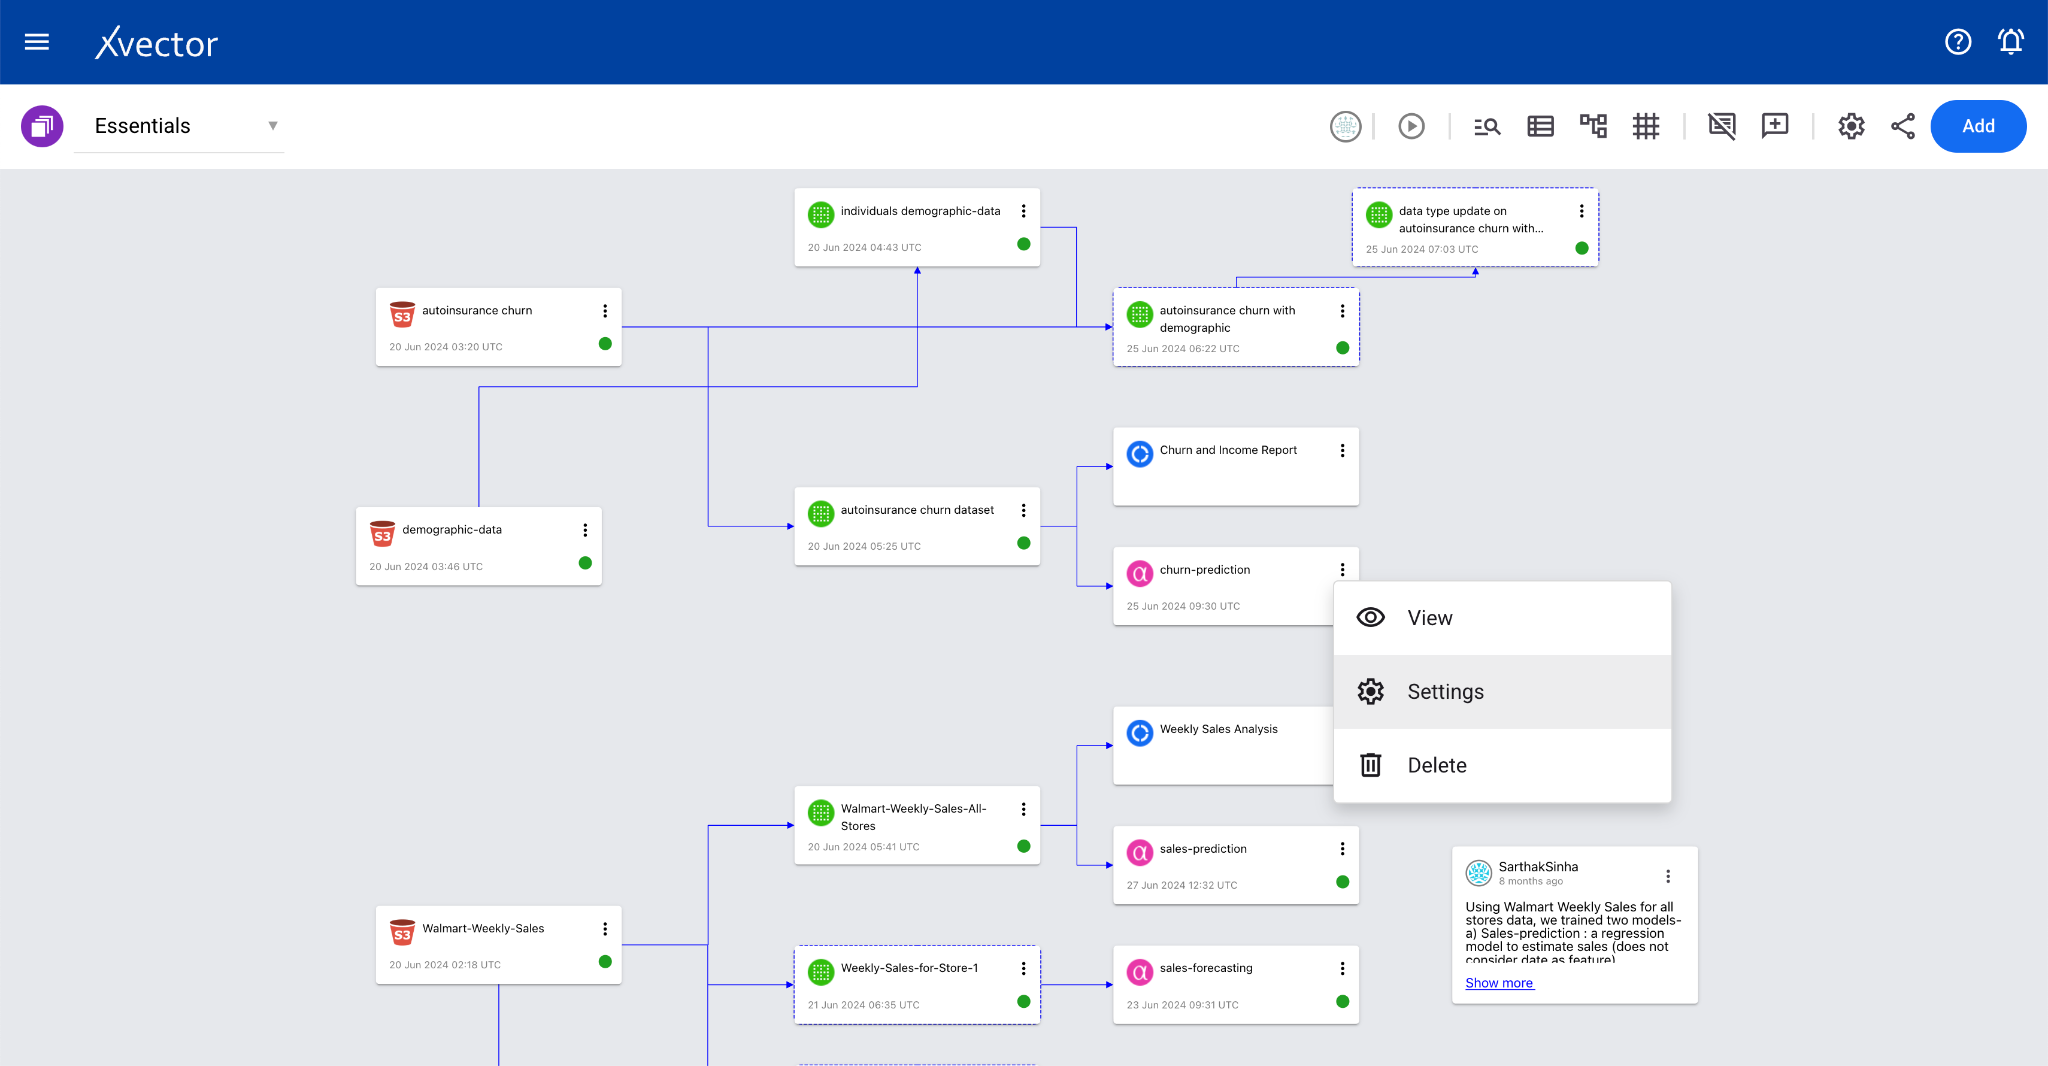
Deleting a Model
Section titled “Deleting a Model”A model can be deleted by clicking on Delete in the menu options of model cards in the workspace.