The Job to Be Done
A dental chain operating 300 centers needed reliable short-term revenue forecasts, but standard planning tools could not account for the seasonality, day-of-week patterns, and center-specific nuances that drive their business.
Three problems were unsolved:
- Revenue forecasts for the next few weeks were unreliable, making staffing and marketing decisions reactive rather than planned.
- Newly opened centers had no historical baseline, so there was no principled way to set realistic revenue targets.
- When a center underperformed, teams could not isolate whether day-of-week effects, geography, or seasonal patterns were driving the issue.
Without a reliable forecast, underperforming centers were often detected only after month-end close.
Results
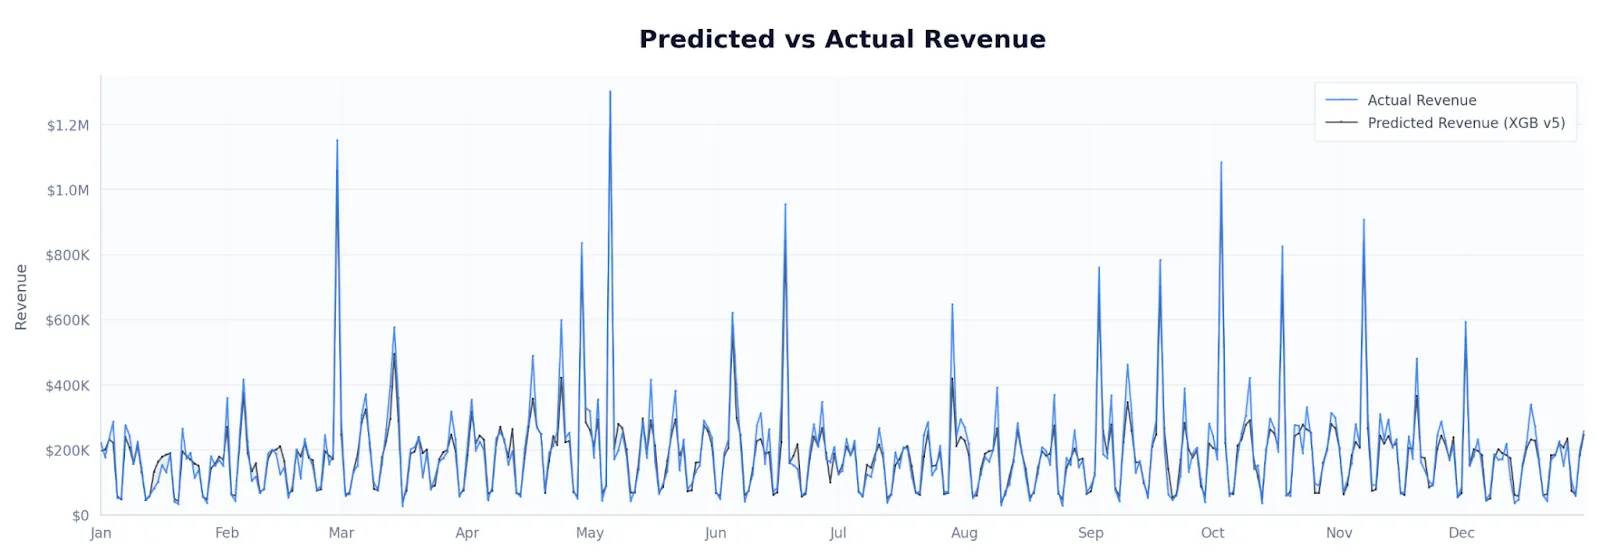
xVector built a revenue forecast app that trains time series and gradient boosting models on historical invoice data. Revenue managers can select any zone or center and generate a next-week forecast in seconds, with model accuracy tracked continuously through MAPE (Mean Absolute Percentage Error).
Key insights:
- The model learned to predict revenue based on center age, enabling realistic targets for newly launched locations.
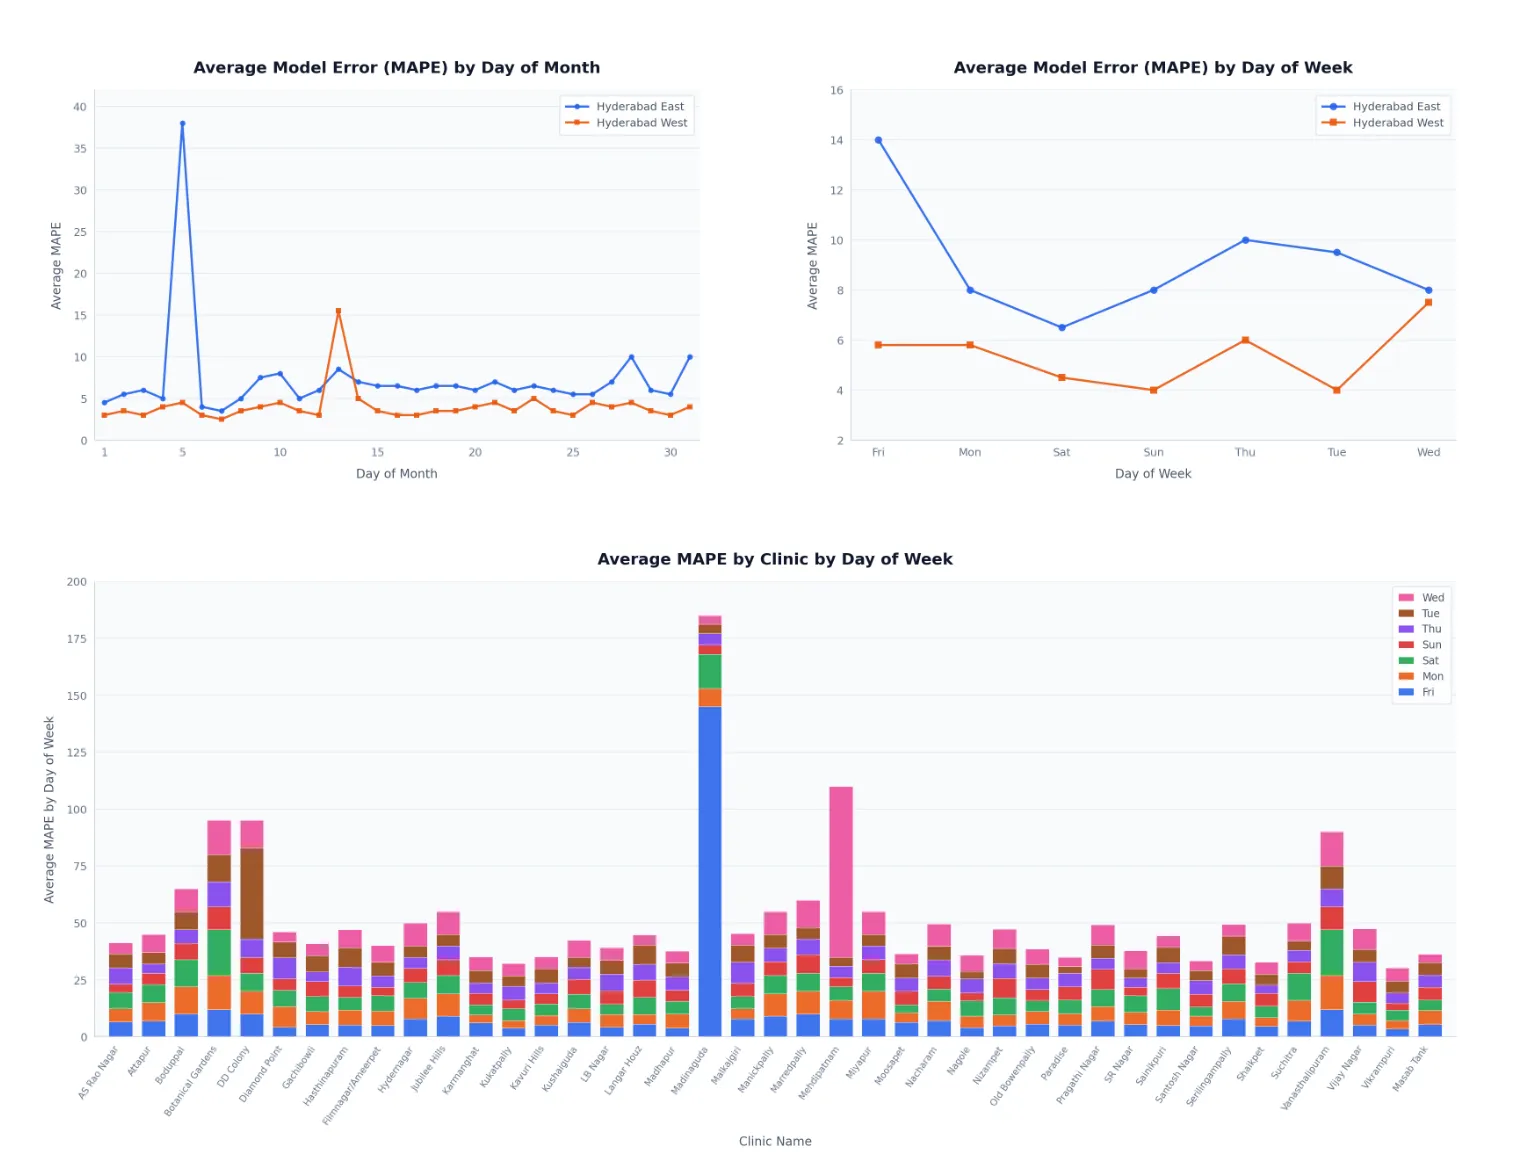
- Several centers were identified as outliers in specific months and days of week, tied to local geography.
- Models are continuously retrained to reflect changing conditions, improving forecast quality over time.
xVector Platform Capabilities Applied
Data Layer
- Invoice data unified across all 300 centers with center metadata including age, zone, and geography.
- Day-of-week and month-of-year features engineered automatically.
- Pre-computed forecast outputs refreshed on a weekly schedule.
Forecasting Models
- Time series models on historical invoice data to capture seasonality and trend.
- Gradient boosting (XGBoost) models for center-specific nonlinear drivers.
- Automatic model selection per center based on held-out MAPE performance.
- Continuous retraining on incoming data.
Insights Layer
- Interactive dashboard with zone and center selectors and date-range controls.
- Predicted vs Actual Revenue overlay for in-production monitoring.
- MAPE error analysis by clinic, day of week, and day of month.
- Outlier flagging for centers deviating from expected performance.
Action Layer
- Proactive surfacing of underperforming centers for intervention.
- Programmatic revenue target setting for new centers based on age-model behavior.