The Job to Be Done
A specialty pharma company launched an antibiotic into 175 accounts across 10 Key Account Managers’ (KAM) territories. Standard reporting couldn’t reconcile the multi-layered supply chain or give field teams the account-level intelligence they needed. Three problems went unsolved:
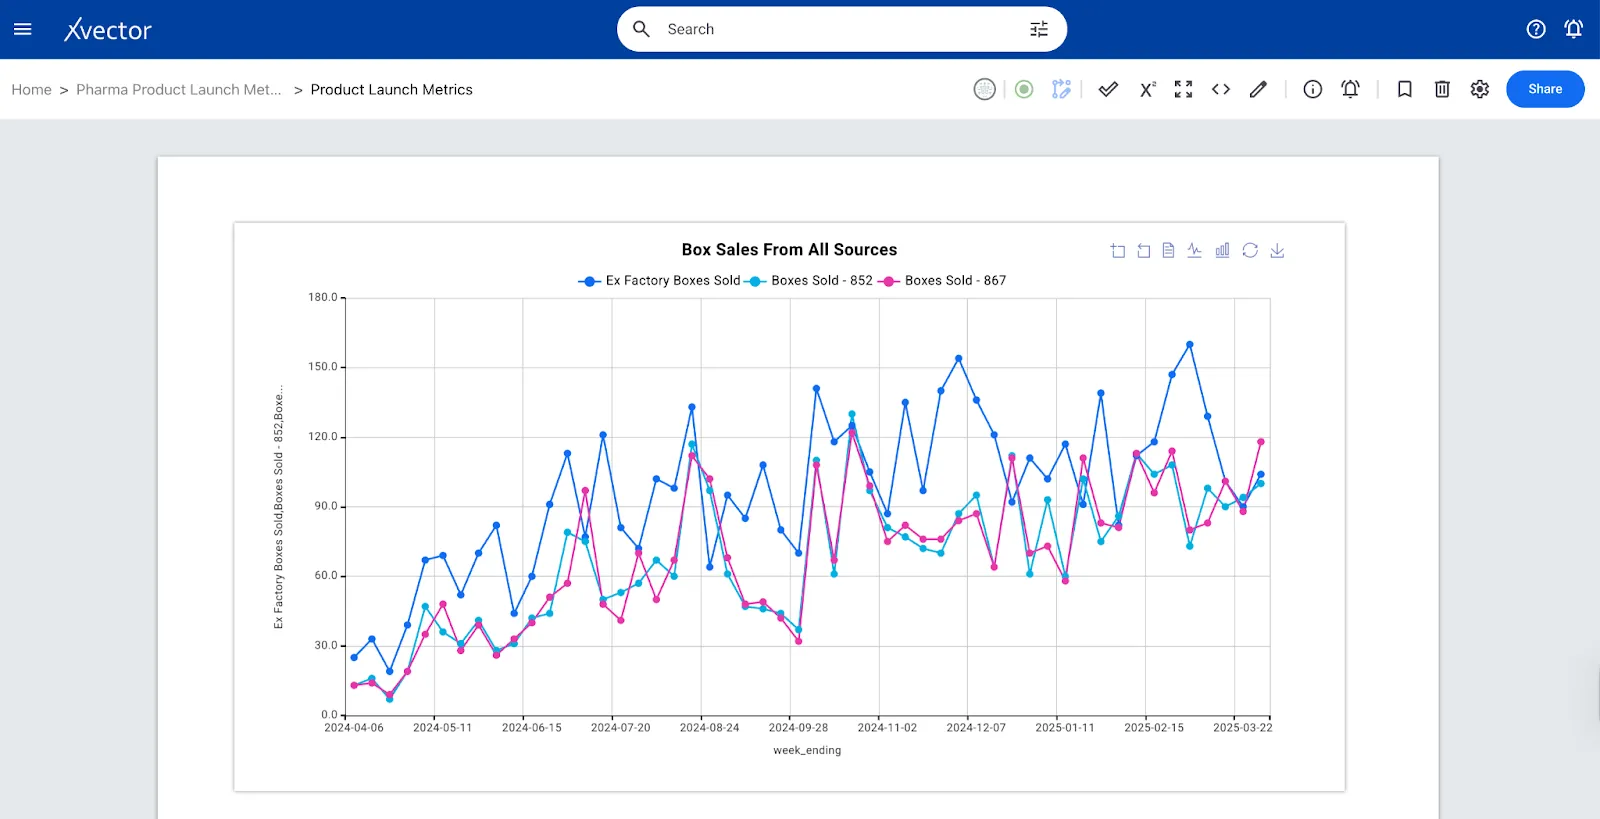
- Supply chain visibility was fragmented across Ex-Factory, 852, and 867 EDI transactions — early distributor shipments masked whether inventory was converting to actual hospital demand.
- Territory reporting was aggregate-only. KAMs couldn’t distinguish target vs. non-target hospital ordering or track re-ordering and PDOT at the account level.
- Budget vs. actual tracking relied on quarterly snapshots with no way to compare Gross-to-Net waterfall components or benchmark the drug’s launch trajectory against branded competitors.
Without end-to-end traceability, underperforming territories and stalling accounts went undetected until the quarter had closed.
Results
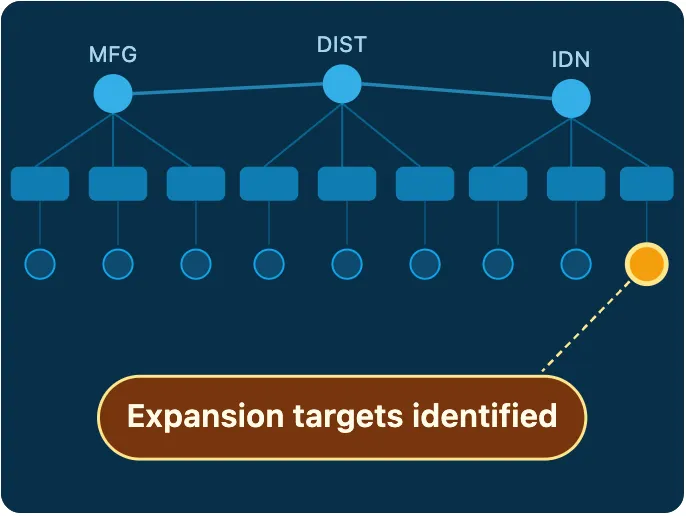
xVector built a pharma launch analytics platform that unifies Ex-Factory, 852, and 867 EDI data with account master records, IDN affiliations, and territory hierarchies. Commercial leaders can now trace every unit from manufacturing through five distributors to 175 accounts, with full inventory timing and class-of-trade reconciliation.
Key insight: Volume flow reconciliation revealed 867 deliveries consistently ran 15–22% below 852 shipments, a gap previously misattributed to distributor leakage that was actually in-transit inventory.
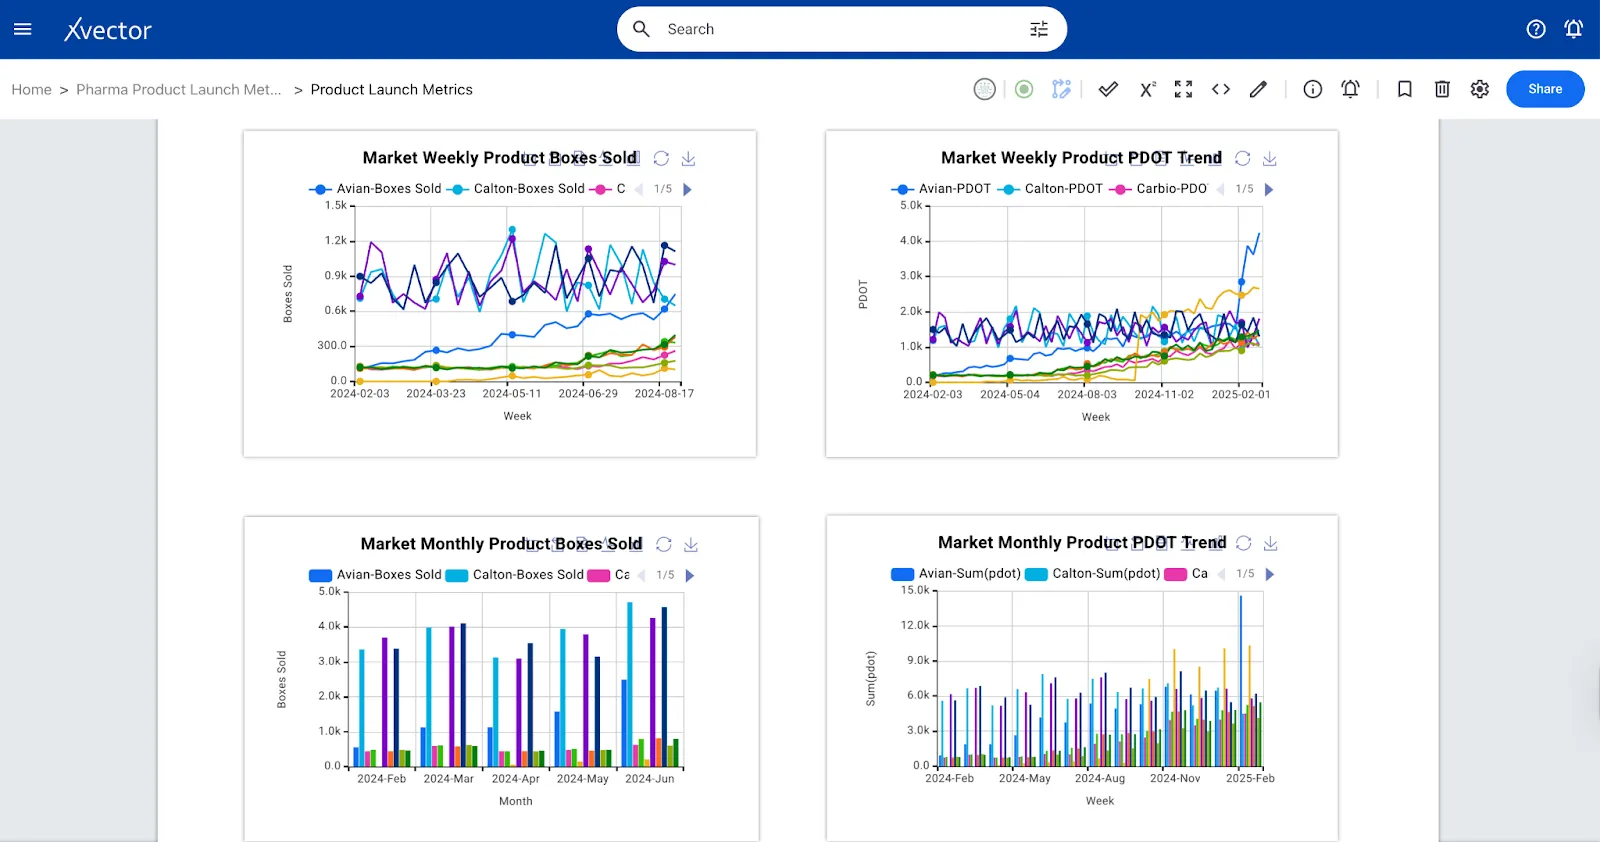
Key insight: Reordering hospitals (70% of the ordering base) accounted for 74% of total hospital volume. Uncovered white-space targets accounted for a disproportionate 10% share and had higher average Patient Days on Therapy (PDOT), flagging an expansion opportunity.
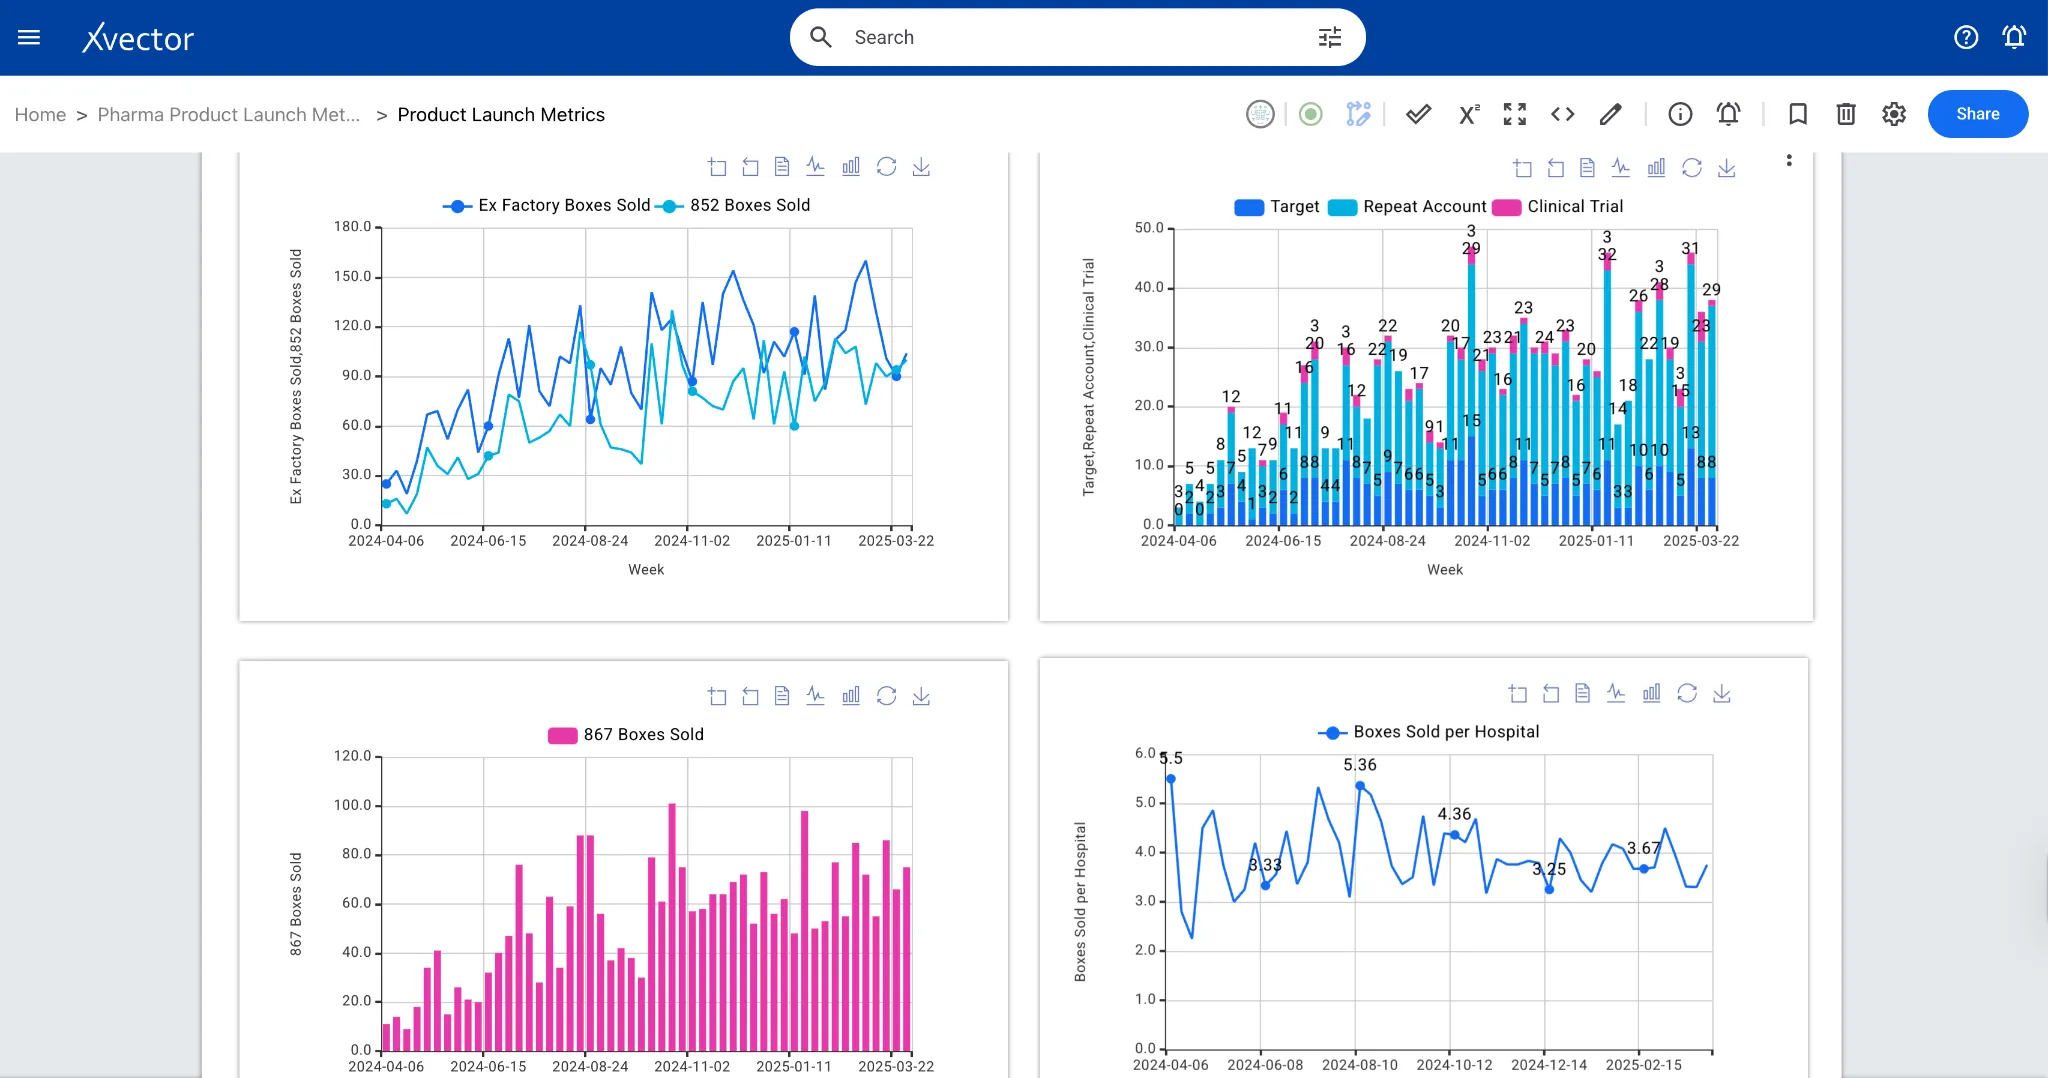
Key insight: Launch-aligned PDOT benchmarking showed the drug outpacing four of five recently launched branded competitors through Week 26, identifying specific months of competitor prescribing surges to inform counter-detailing.
xVector Platform Capabilities Applied
Data Layer
- 11 interconnected source files with enforced referential integrity: accounts, IDNs, distributors, territories, EDI transactions, budget/forecast, and market sales
- Normalized master data design with accounts.csv as single source of truth; transactional files joined on demand to prevent duplication
- Supply chain volume hierarchy: Ex-Factory ≥ 852 ≥ 867
Analytics Engine
- DAG-based pipeline across five value streams: Supply Chain, Territory & Field Force, Strategic Accounts, Planning & Finance, Market & Competitive
- 23 named analyses producing 8 output views: volume reconciliation, class-of-trade, hospital segmentation, territory trending, budget vs. actual, and competitive benchmarking
- PDOT normalization across variable dosage regimens with automatic patient-equivalent conversion for cross-product comparison
Insights Layer
- Interactive territory dashboards: KAM-level weekly trending with target/non-target splits, new vs. repeat ordering, and cumulative hospital penetration
- Hospital segmentation matrix: 12 overlapping segments with PDOT, business share, and target list penetration metrics
- Competitive intelligence: market PDOT trends, branded competitor launch curves, and empiric antibiotics dollar sales with WAC/day pricing context
Action Layer
- Top 10 growing and declining hospital alerts surfaced weekly; 4-week rolling comparison with growth %, LTD PDOT, and territory attribution
- Regional account manager roll-up for IDN account management: target vs. non-target ordering, network penetration, and cross-territory performance for QBRs
- Budget vs. October LE variance at monthly/quarterly grain; net sales, box volume, and GTN waterfall with dual-axis views for finance alignment