Data Engineering Handbook
Overview
Objective
A Data Engineer is responsible for designing, building, and maintaining scalable data pipelines and infrastructure that enable organizations to collect, store, process, and analyze data efficiently. Their work ensures that data is available, reliable, and optimized for analytics, machine learning, business intelligence, and agentic applications.
The Data Engineering Handbook is a comprehensive guide to optimizing data pipelines for integrity, availability, and performance. It covers essential topics such as data quality, enrichment, indexing, storage strategies, reliability metrics, and compliance. Through the lens of the xVector Platform, the handbook illustrates these principles with real-world examples from a SaaS enterprise and a Pharmaceutical Company, offering practical insights into building scalable, efficient data systems.
Applying Data Engineering Principles to Use Cases
In this handbook, we examine SaaS Enterprise and Pharma use cases to understand Data Engineering principles.
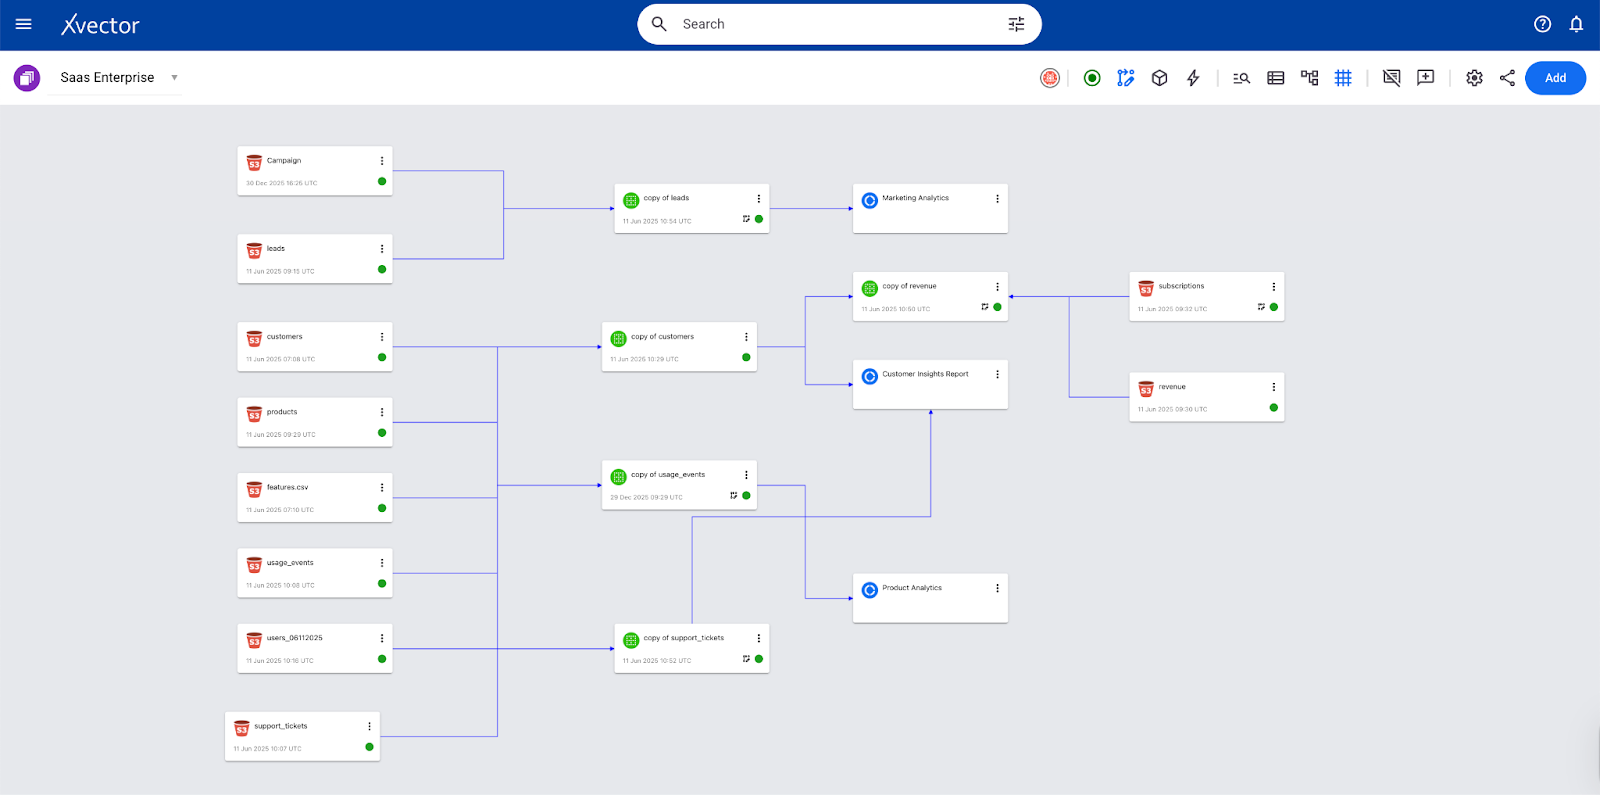
The SaaS Enterprise App demonstrates a comprehensive end-to-end analytics framework for subscription-based businesses, modeling the complete customer lifecycle from acquisition through renewal and expansion. It covers marketing, sales, product, customer success, and financial analytics, showing how these domains interconnect through shared entities such as users, accounts, and subscriptions.
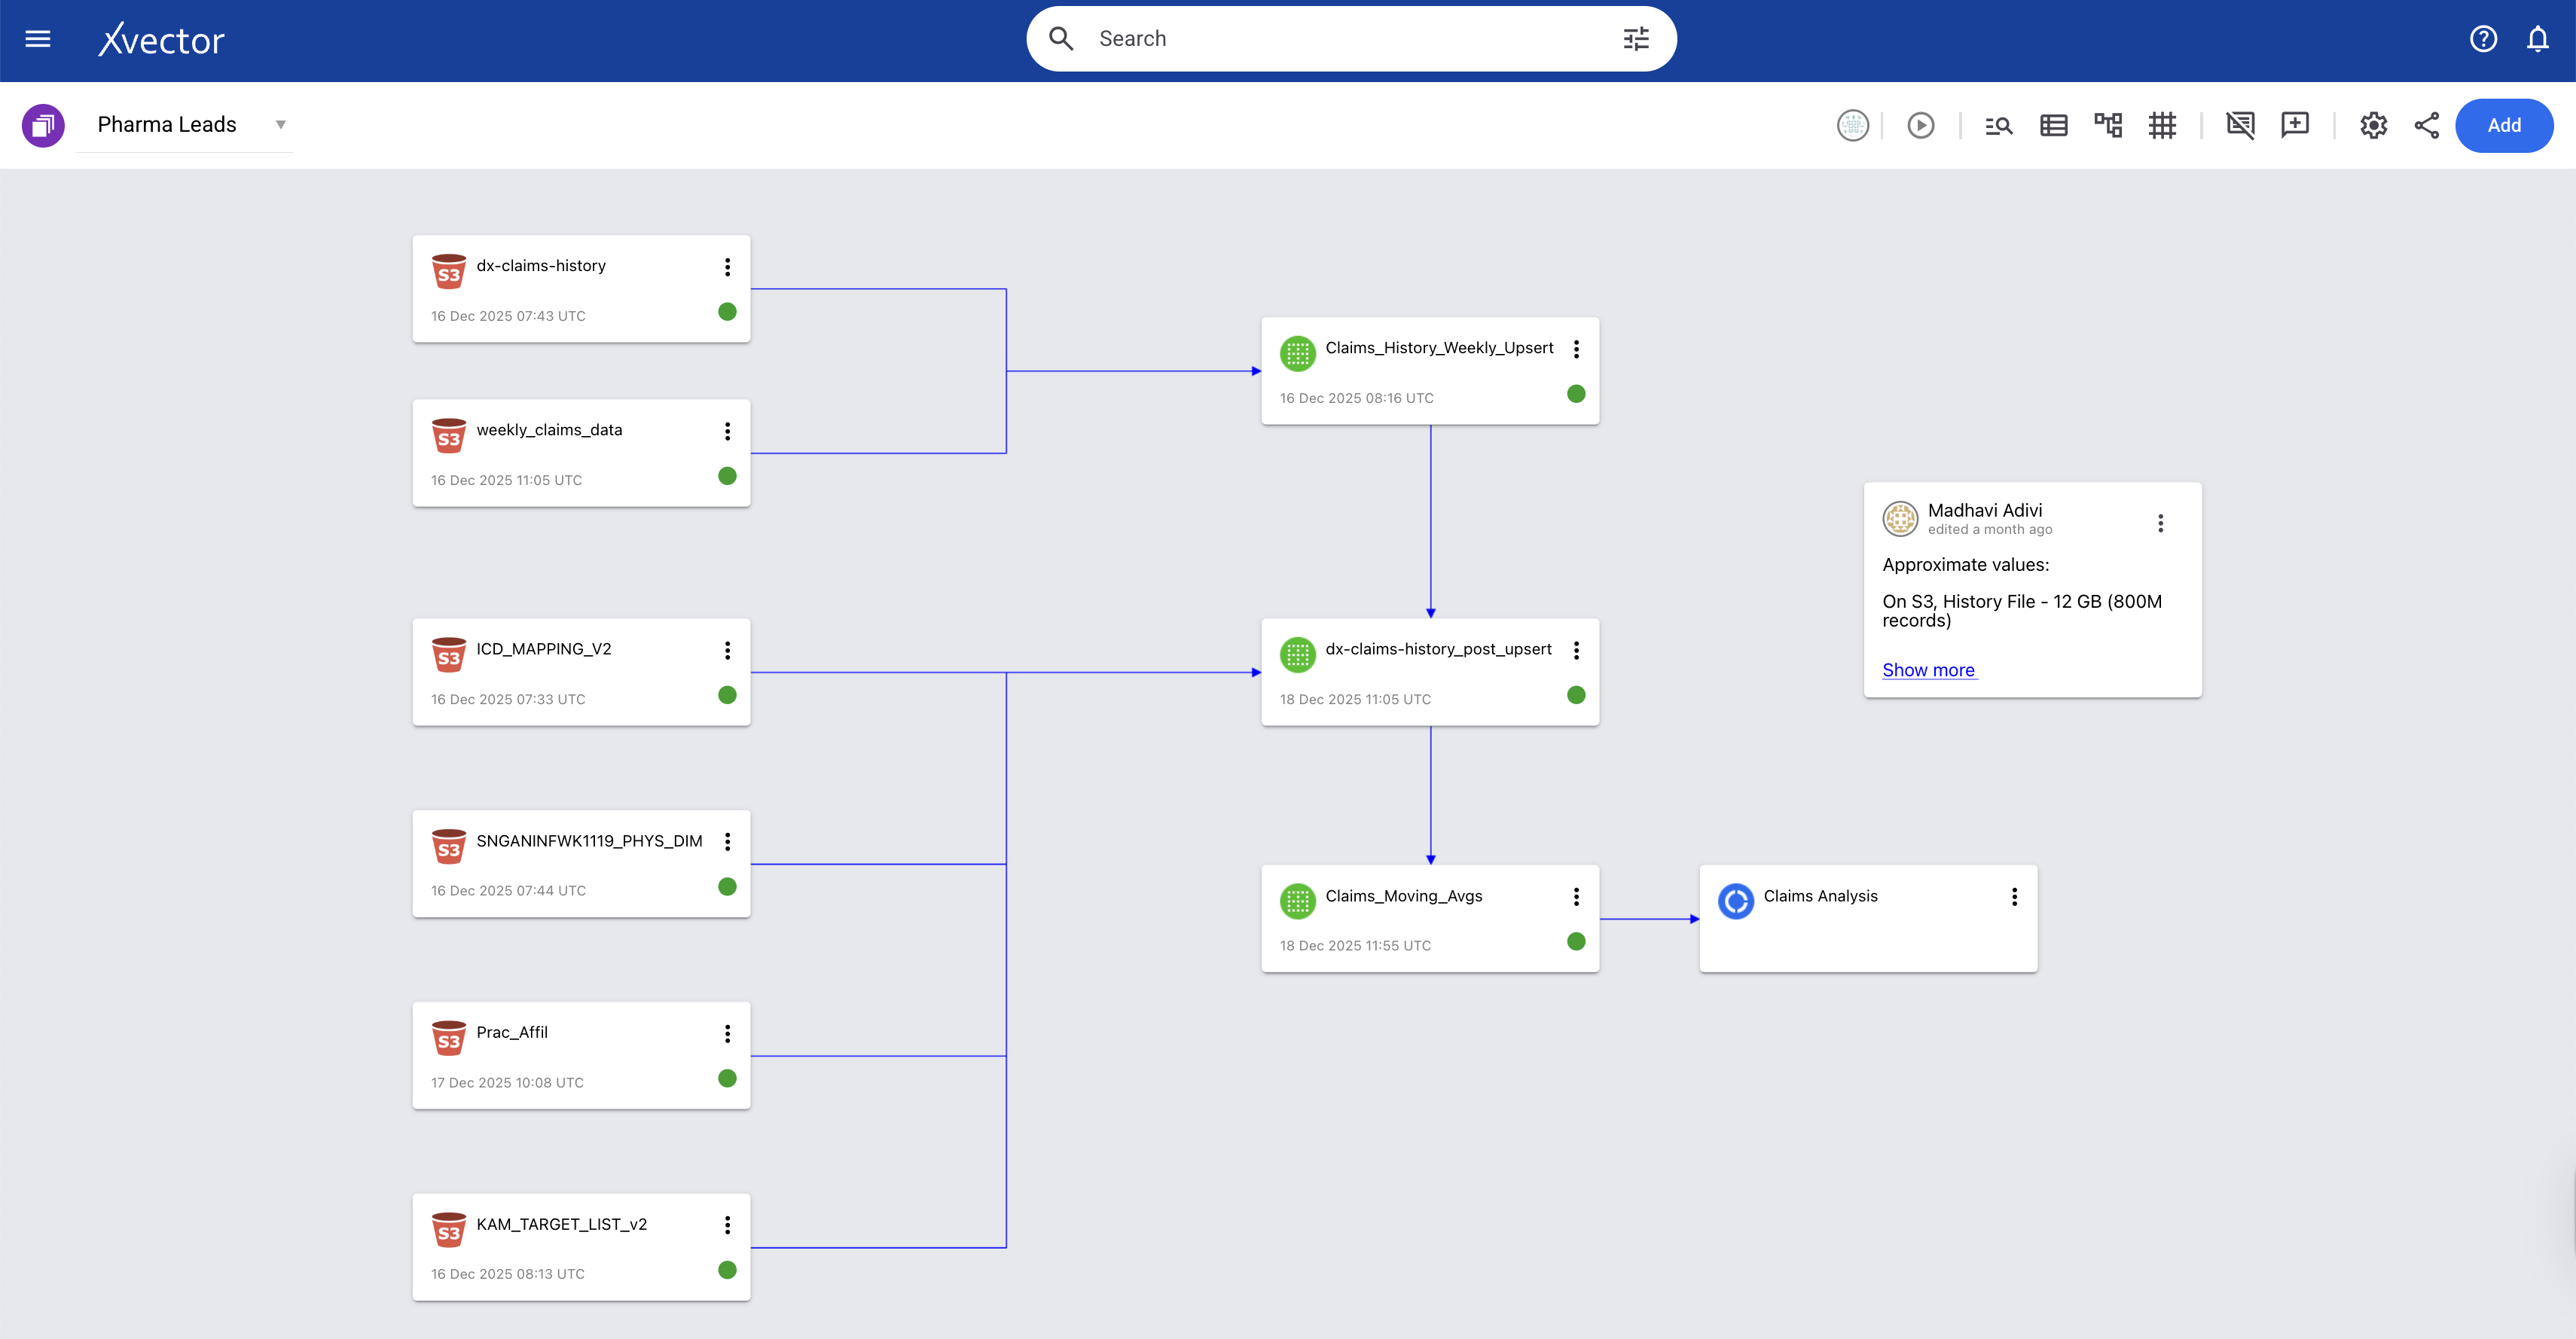
A Pharma company mines approximately 800 million claims records (both historical and ongoing) and provides insights to help sales representatives be more impactful. They would like to identify unusual activity by analyzing the claims data and alert the sales team by defining thresholds. The system can alert the appropriate sales representatives, who can then act accordingly. The data comprises multiple tables that store claims for diagnostic, procedural, and surgical services, along with other information such as patients, providers, and drugs.
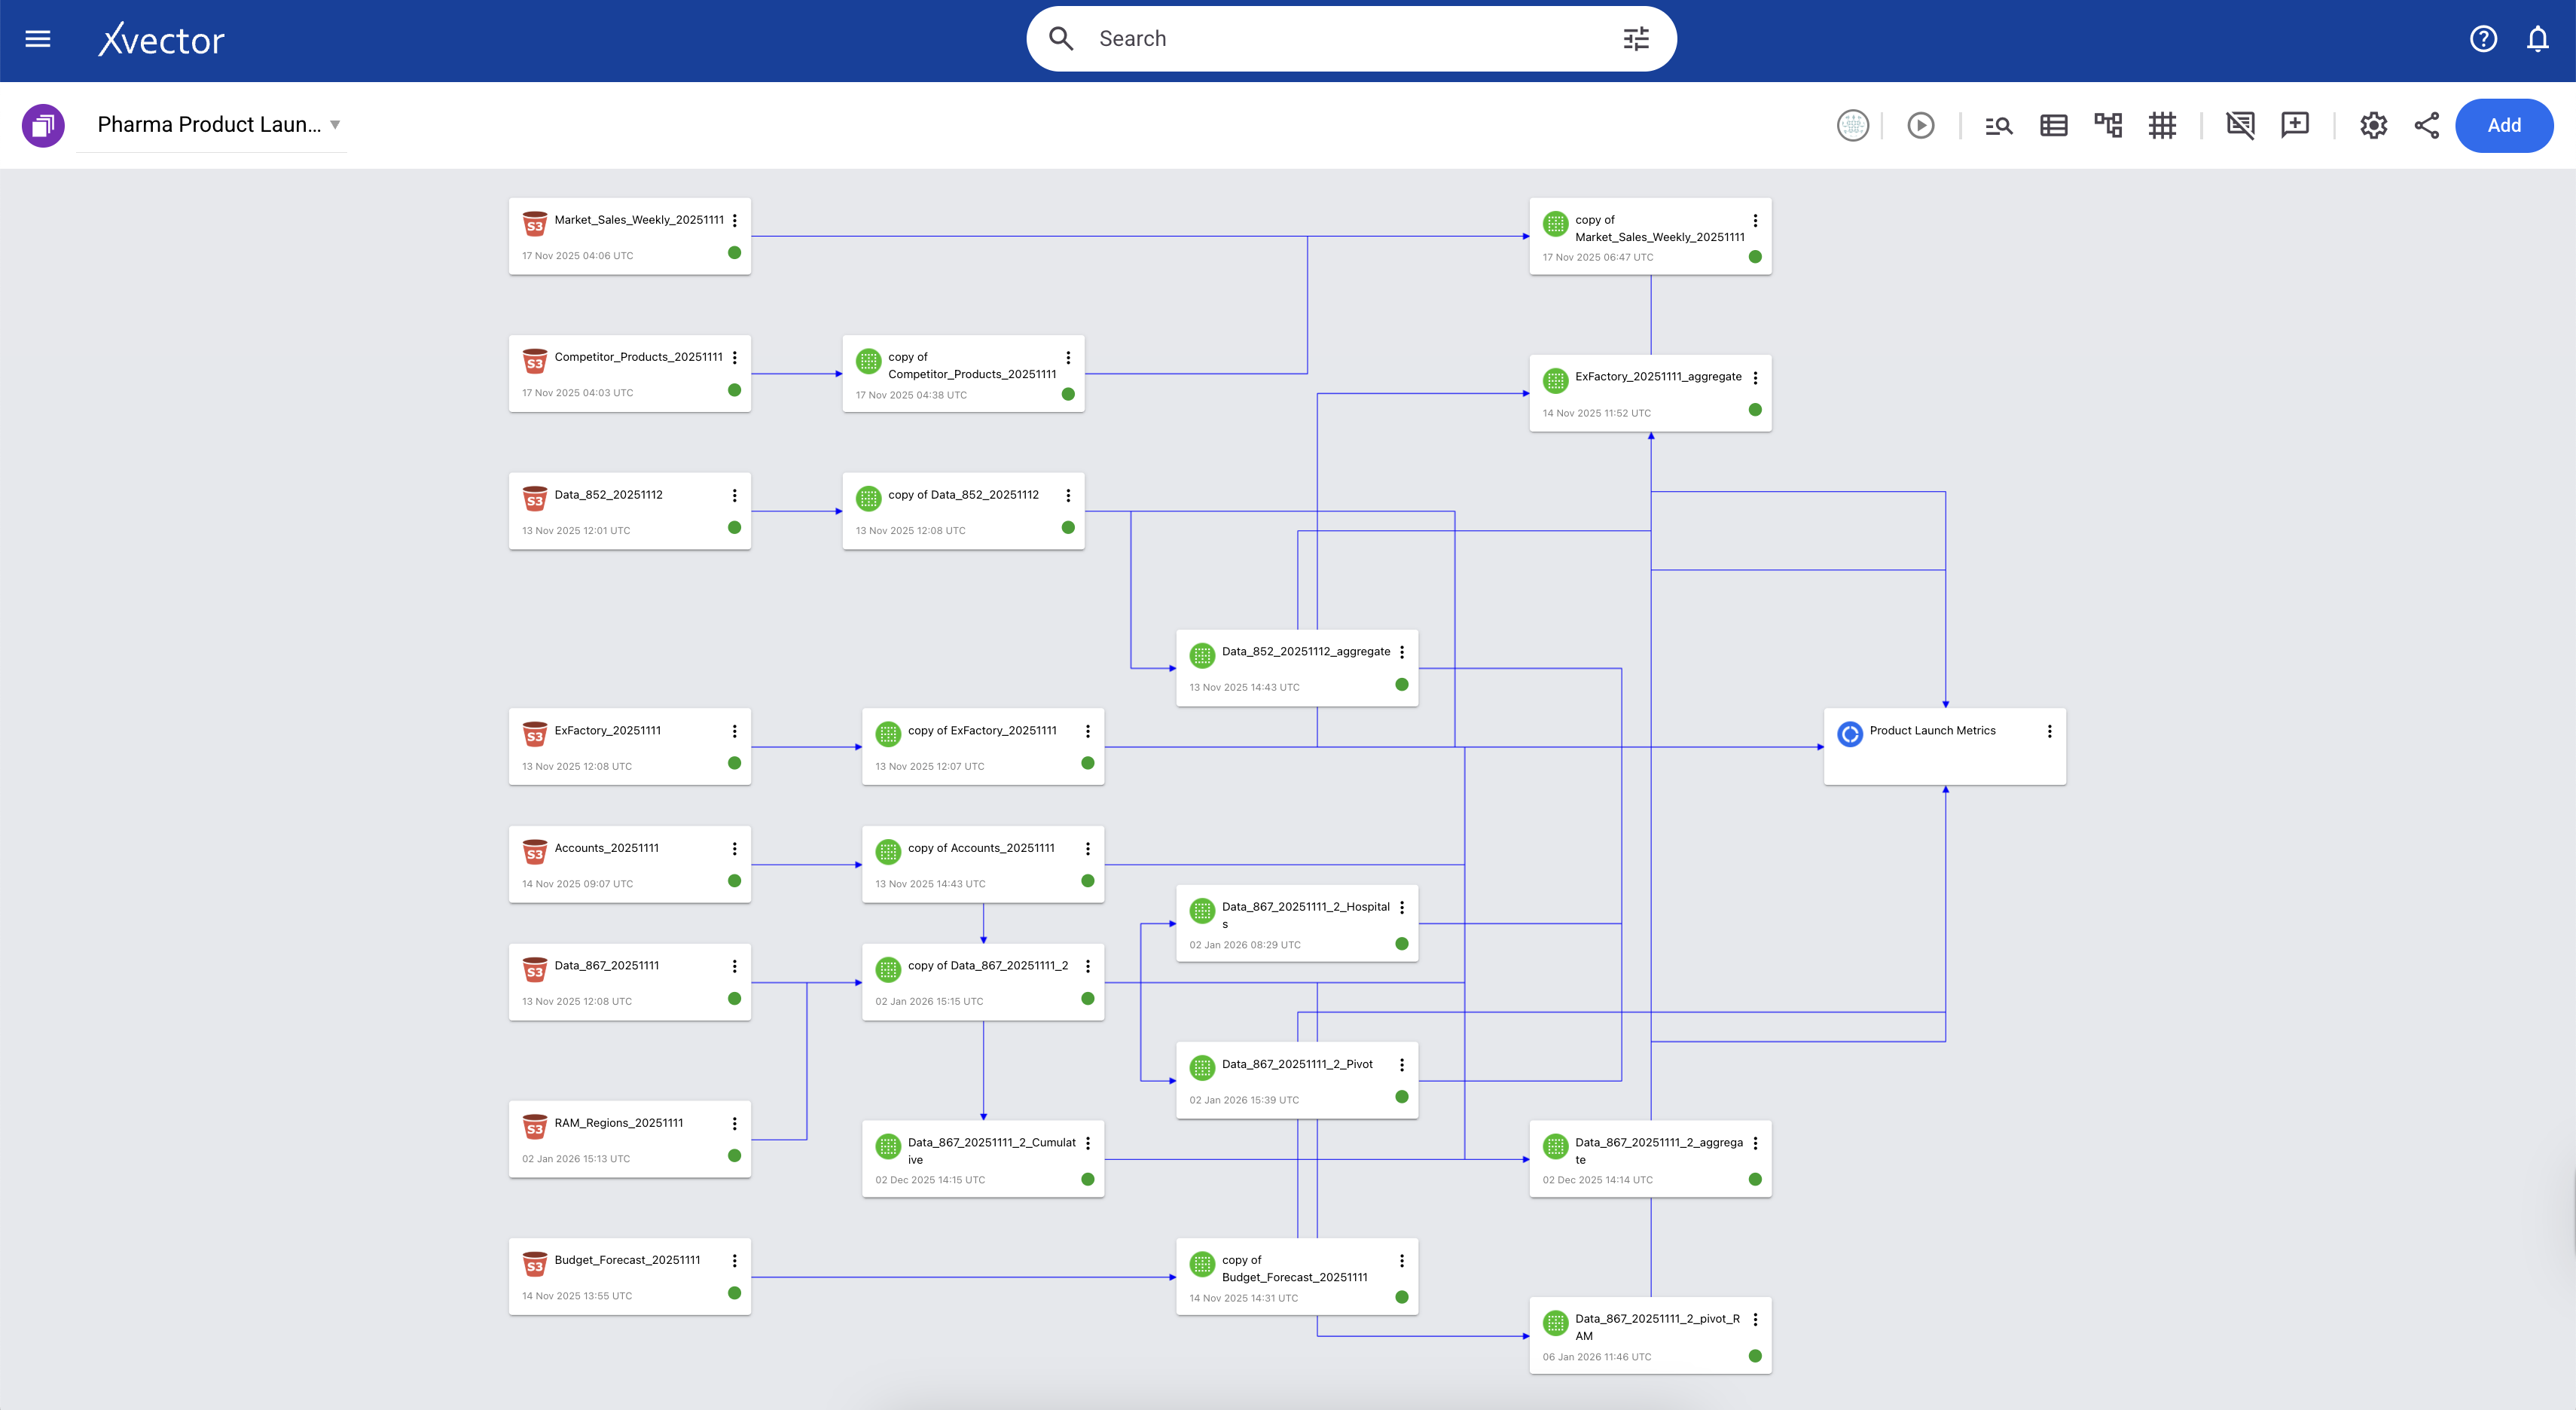
The Sales and Product Metrics App tracks comprehensive market and operational performance for the Pharma Company's drug across multiple dimensions. It measures patient-level utilization through PDOT (Patient Days of Therapy) and market penetration via Launch-to-Date metrics, while monitoring the complete supply chain from Ex-Factory manufacturer shipments through distributor inventory (852) to final account deliveries (867). The app integrates competitive intelligence to enable market-share analysis against competing therapies. Additionally, it tracks financial forecasting accuracy by comparing budgeted and quarterly latest-estimate forecasts against actual sales, while providing visibility into performance across the sales organization, segmented by RAM (Regional Account Managers) targeting IDNs and KAM (Key Account Managers) focused on hospitals.
Below is the xVector pipeline for generating the various metrics and visualizations.
Three Layered Data Architecture
Overview
At xVector, we adopt a three-layer enterprise data architecture, with distinct goals and techniques to ensure availability, integrity, and performance for each layer.
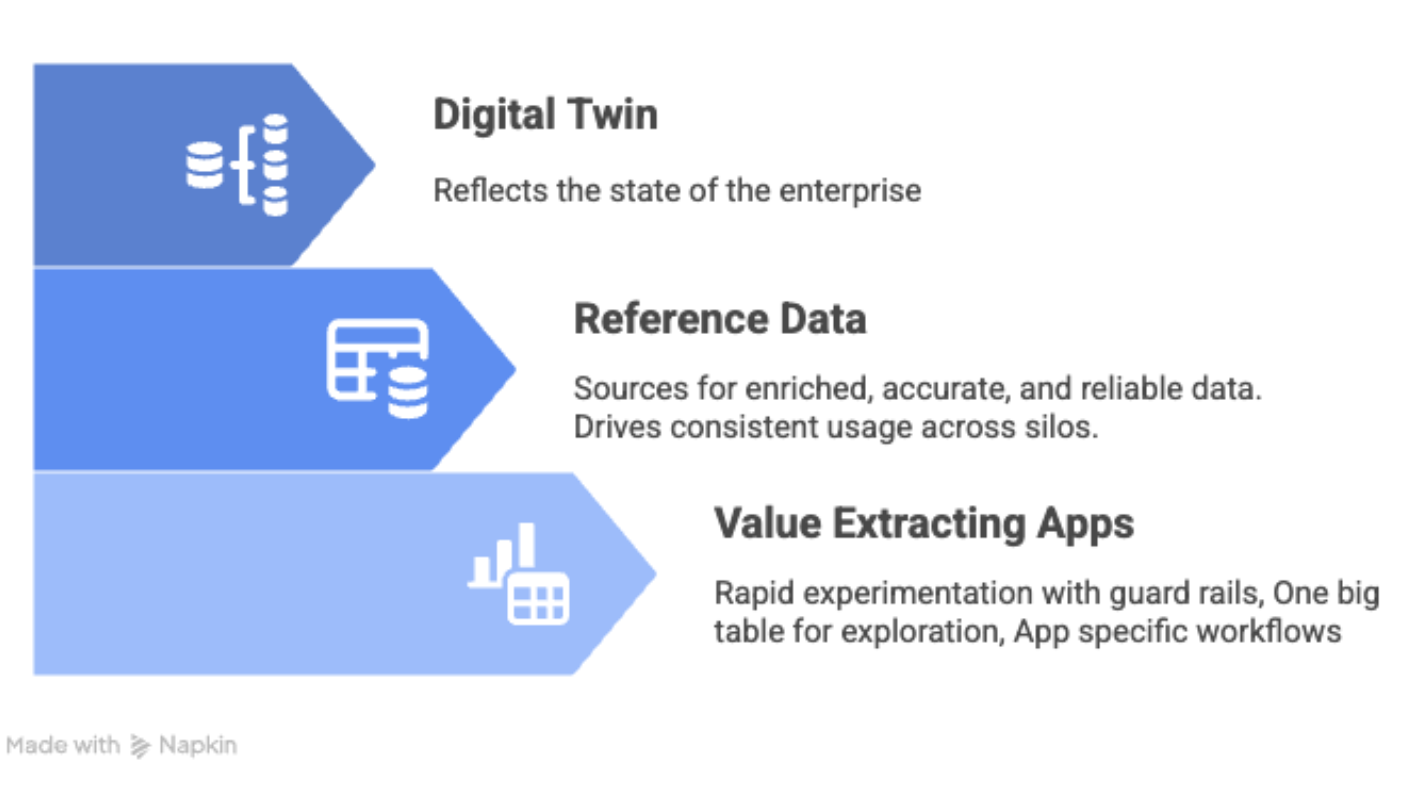
Digital Twin Layer
Overview
This layer provides a near-real-time view of the enterprise, capturing its structure, interactions, and operational state. It starts by ingesting data from various sources in an Enterprise.
Key Capabilities of this layer are:
- Integrates with batch data to maintain a consistent enterprise view.
- Supports seamless changes to data structures without disrupting analytics.
- Interoperates with existing systems
Let us understand this layer via the Pharma Leads App use case. The goal of this App is to generate alerts for Sales representatives whenever there is unusual claims activity in their region. Below is the data pipeline built in the xVector Platform, using the principles explained.
Connecting to Data Sources: Ensuring Availability & Schema Evolution
A reliable data system starts with its ability to connect and transform data seamlessly. Establishing strong connections enables data to flow efficiently between sources, processing pipelines, and destinations. This ensures that data remains complete, traceable, adaptable, and high-quality, which is essential for driving analytics, machine learning, and operational applications.
At xVector, we ingest data from various datasources via connectors.
In the case of the Pharma Company Leads App, we ingest 800 million records of historical claims data spanning 4 years, along with weekly claims data that are either updates to existing claims or new claims. These sources are gzip-compressed files on S3, totaling 15.2 GB across 49 objects. This results in 22.32 GB of uncompressed data in the workspace, stored as Parquet files on S3.
Since there are 49 files with the same schema, we can select the folder containing them and ingest them into the xVector Platform in a single operation.
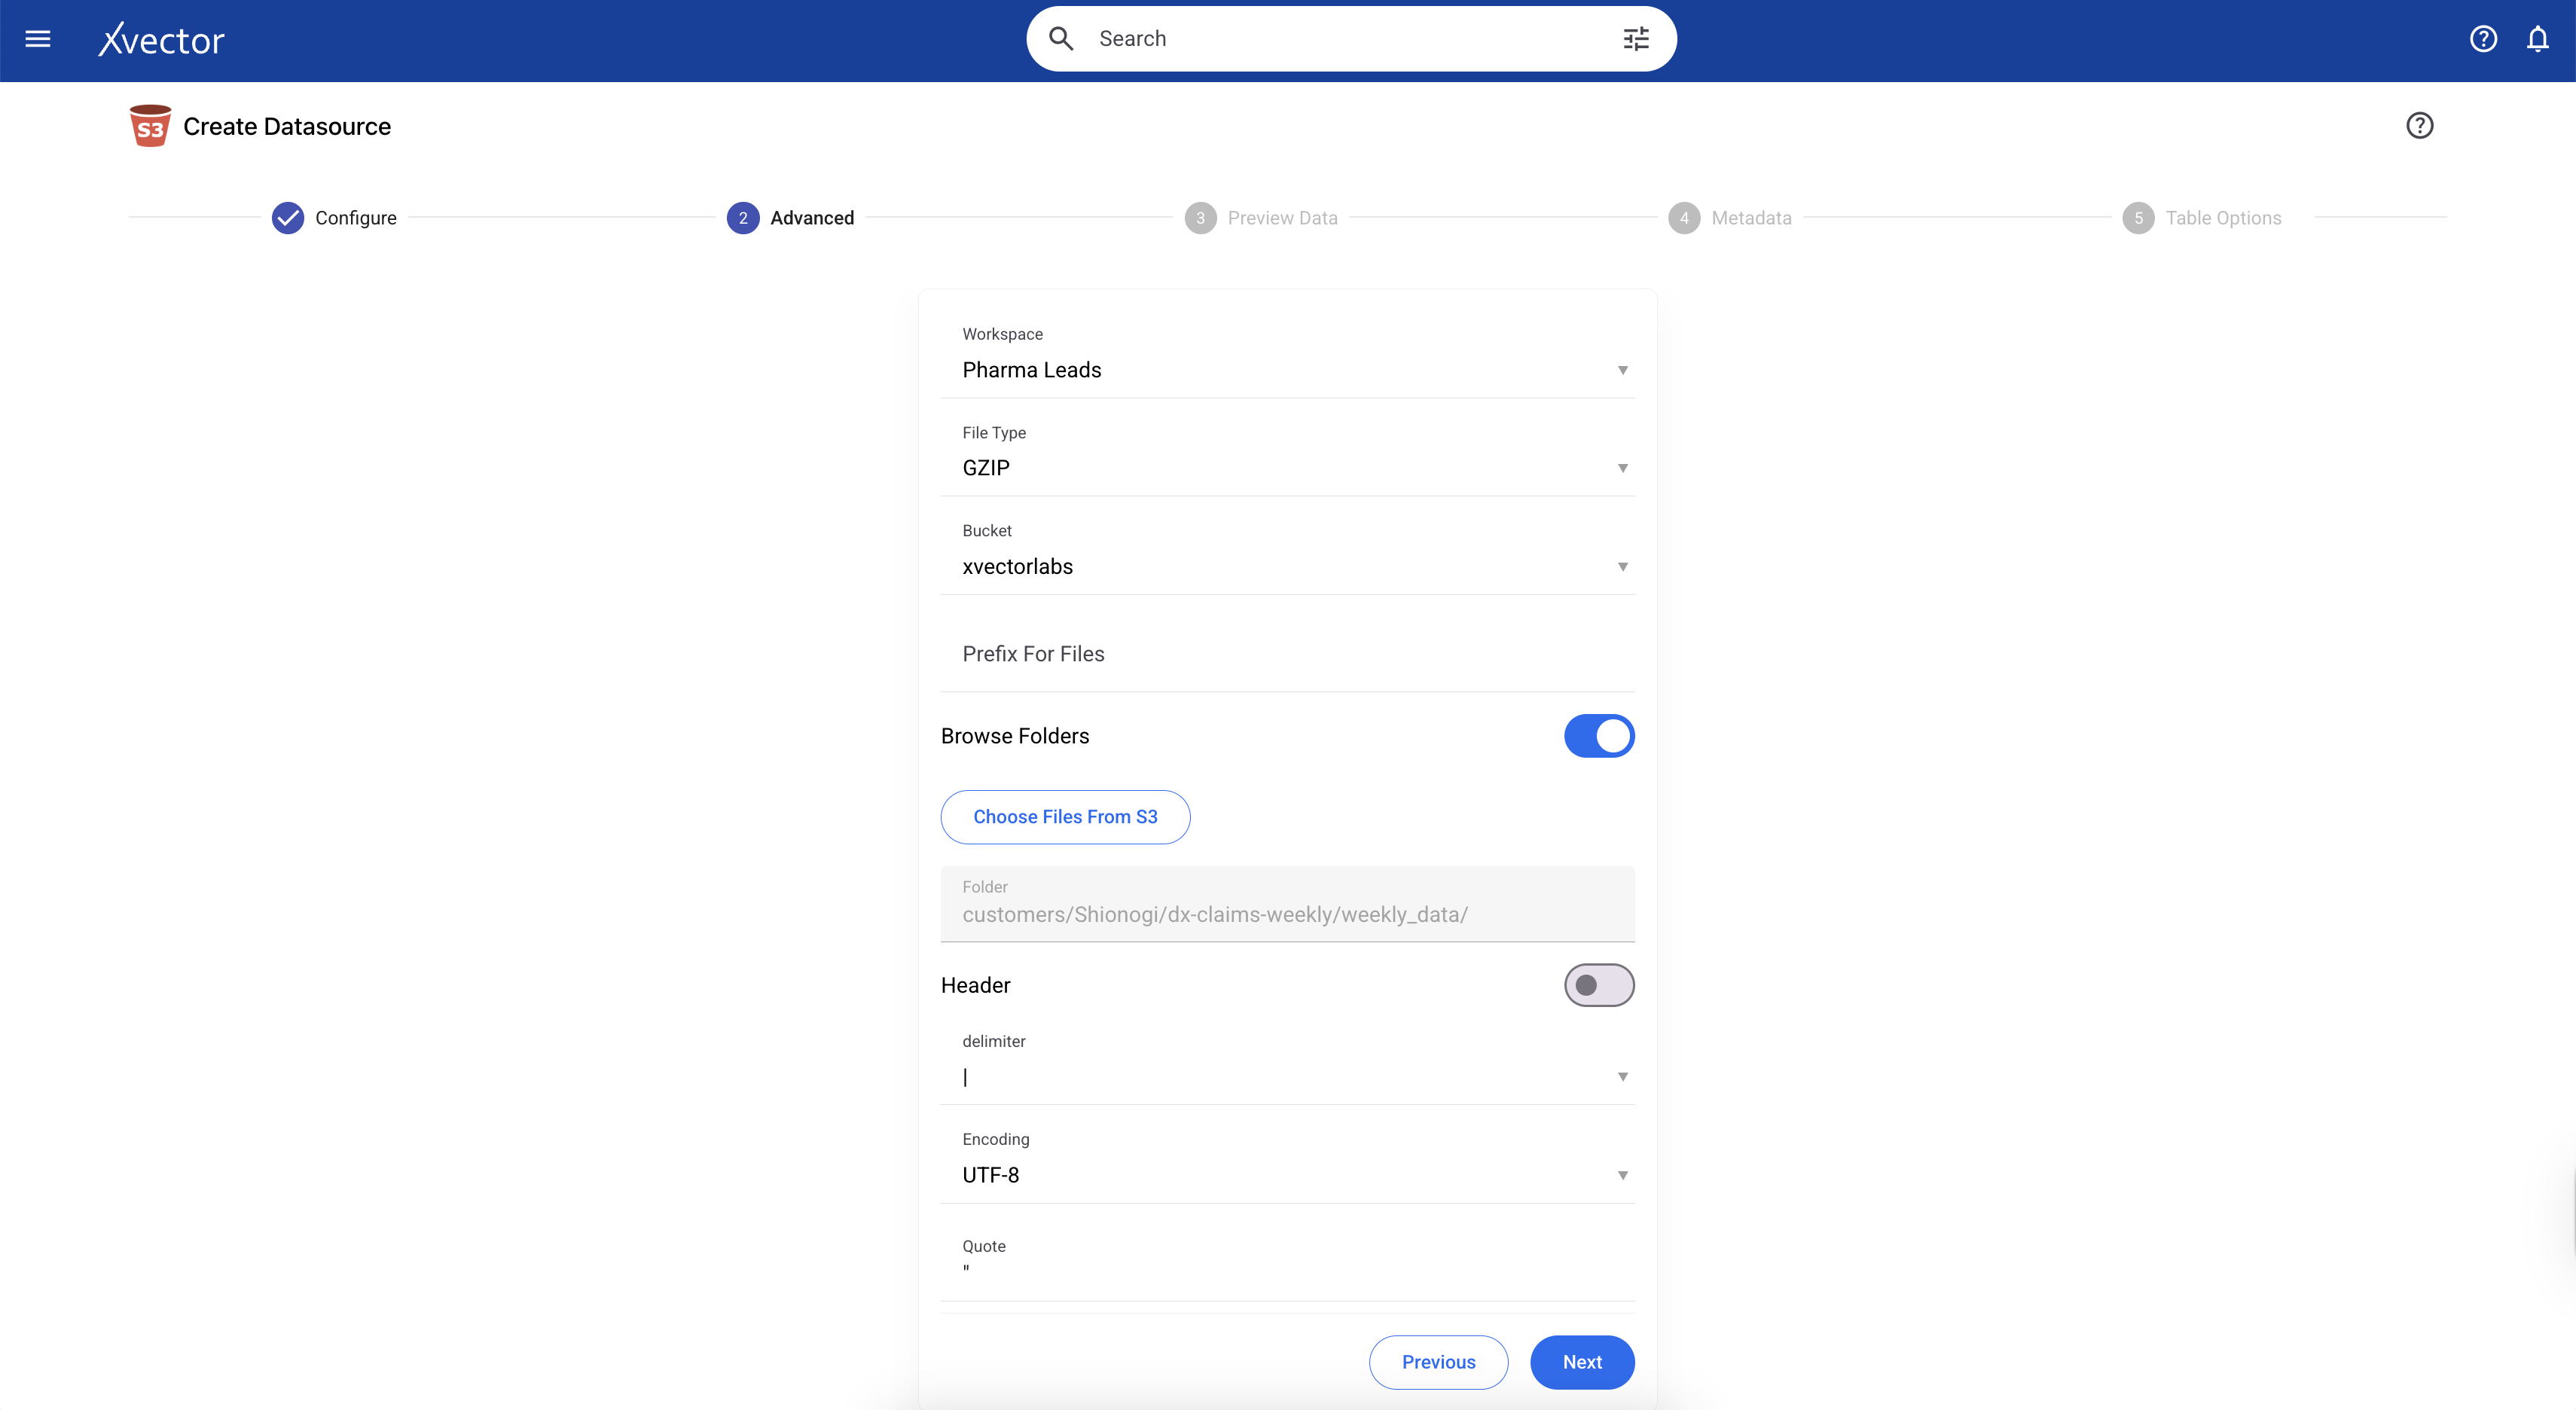
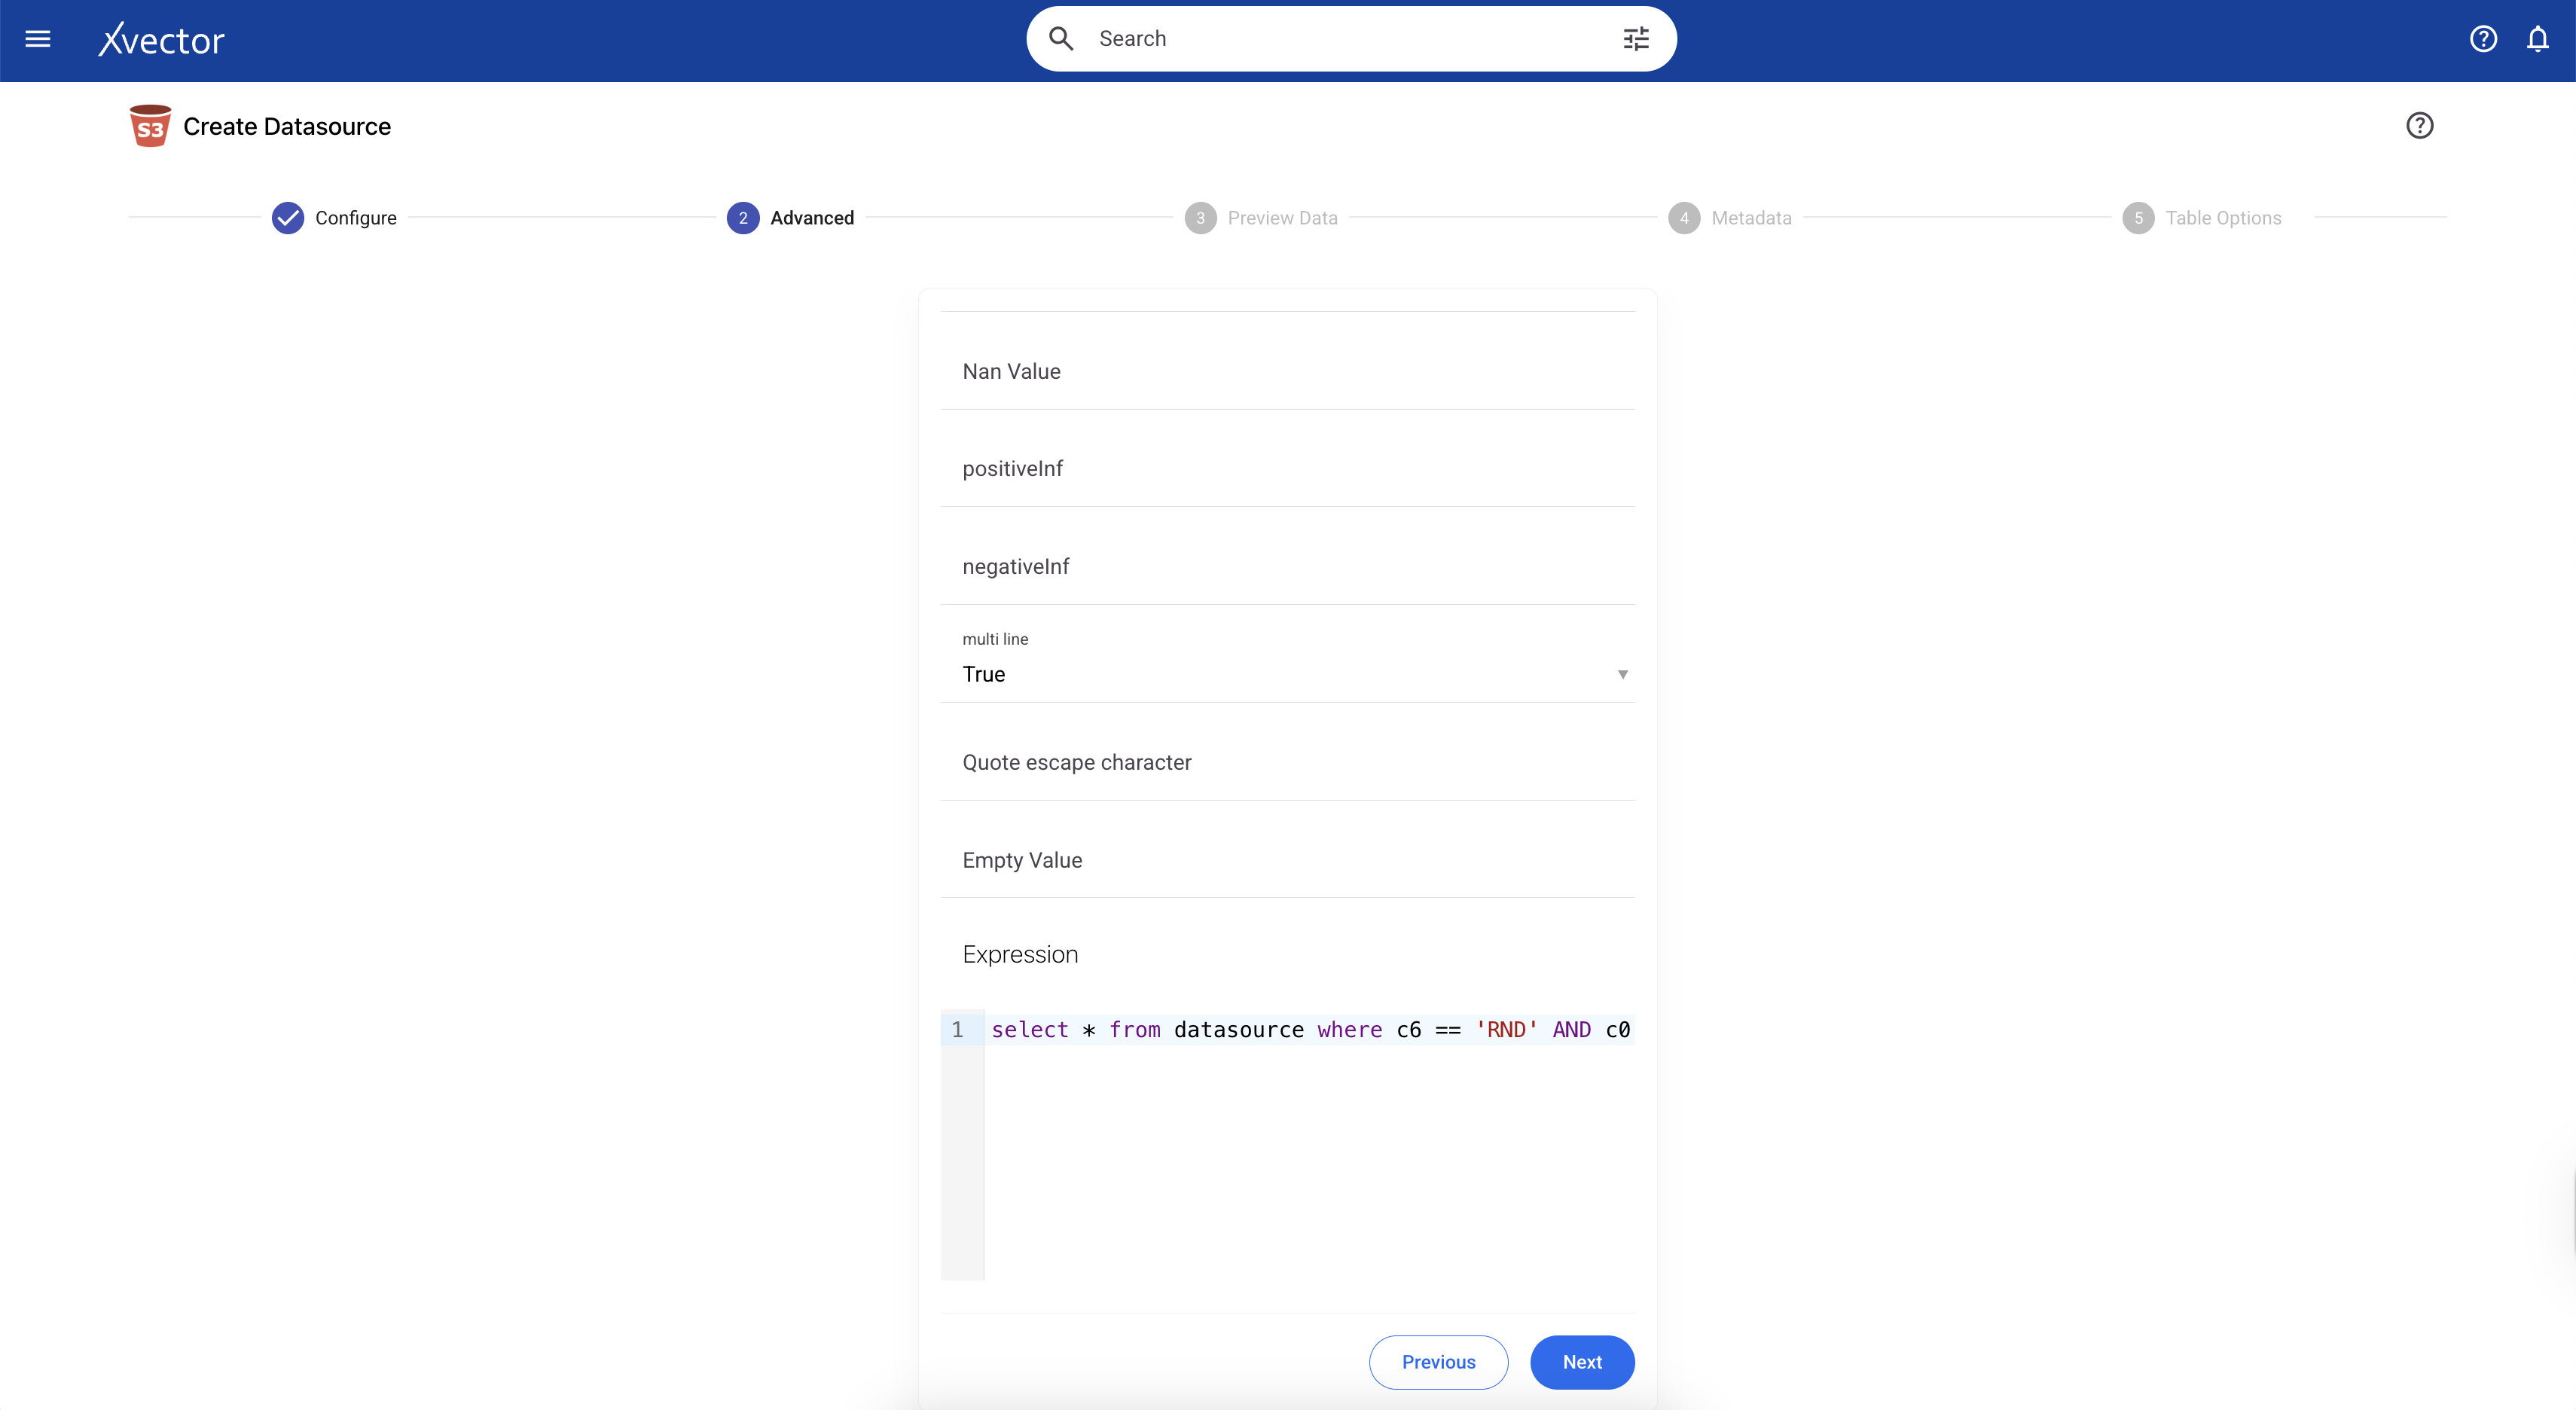
Note: If you want to apply a filter and bring in only a subset of the 800M records into the Platform, we can do so. In the current example, we only want to bring in data where the PRACTITIONER_ROLE = ‘RND’ (Rendering Practitioner). We can apply the filter in the Advanced tab in the Connector. Filtering results in 12.69 GB of uncompressed data in the workspace, stored as Parquet files on S3.
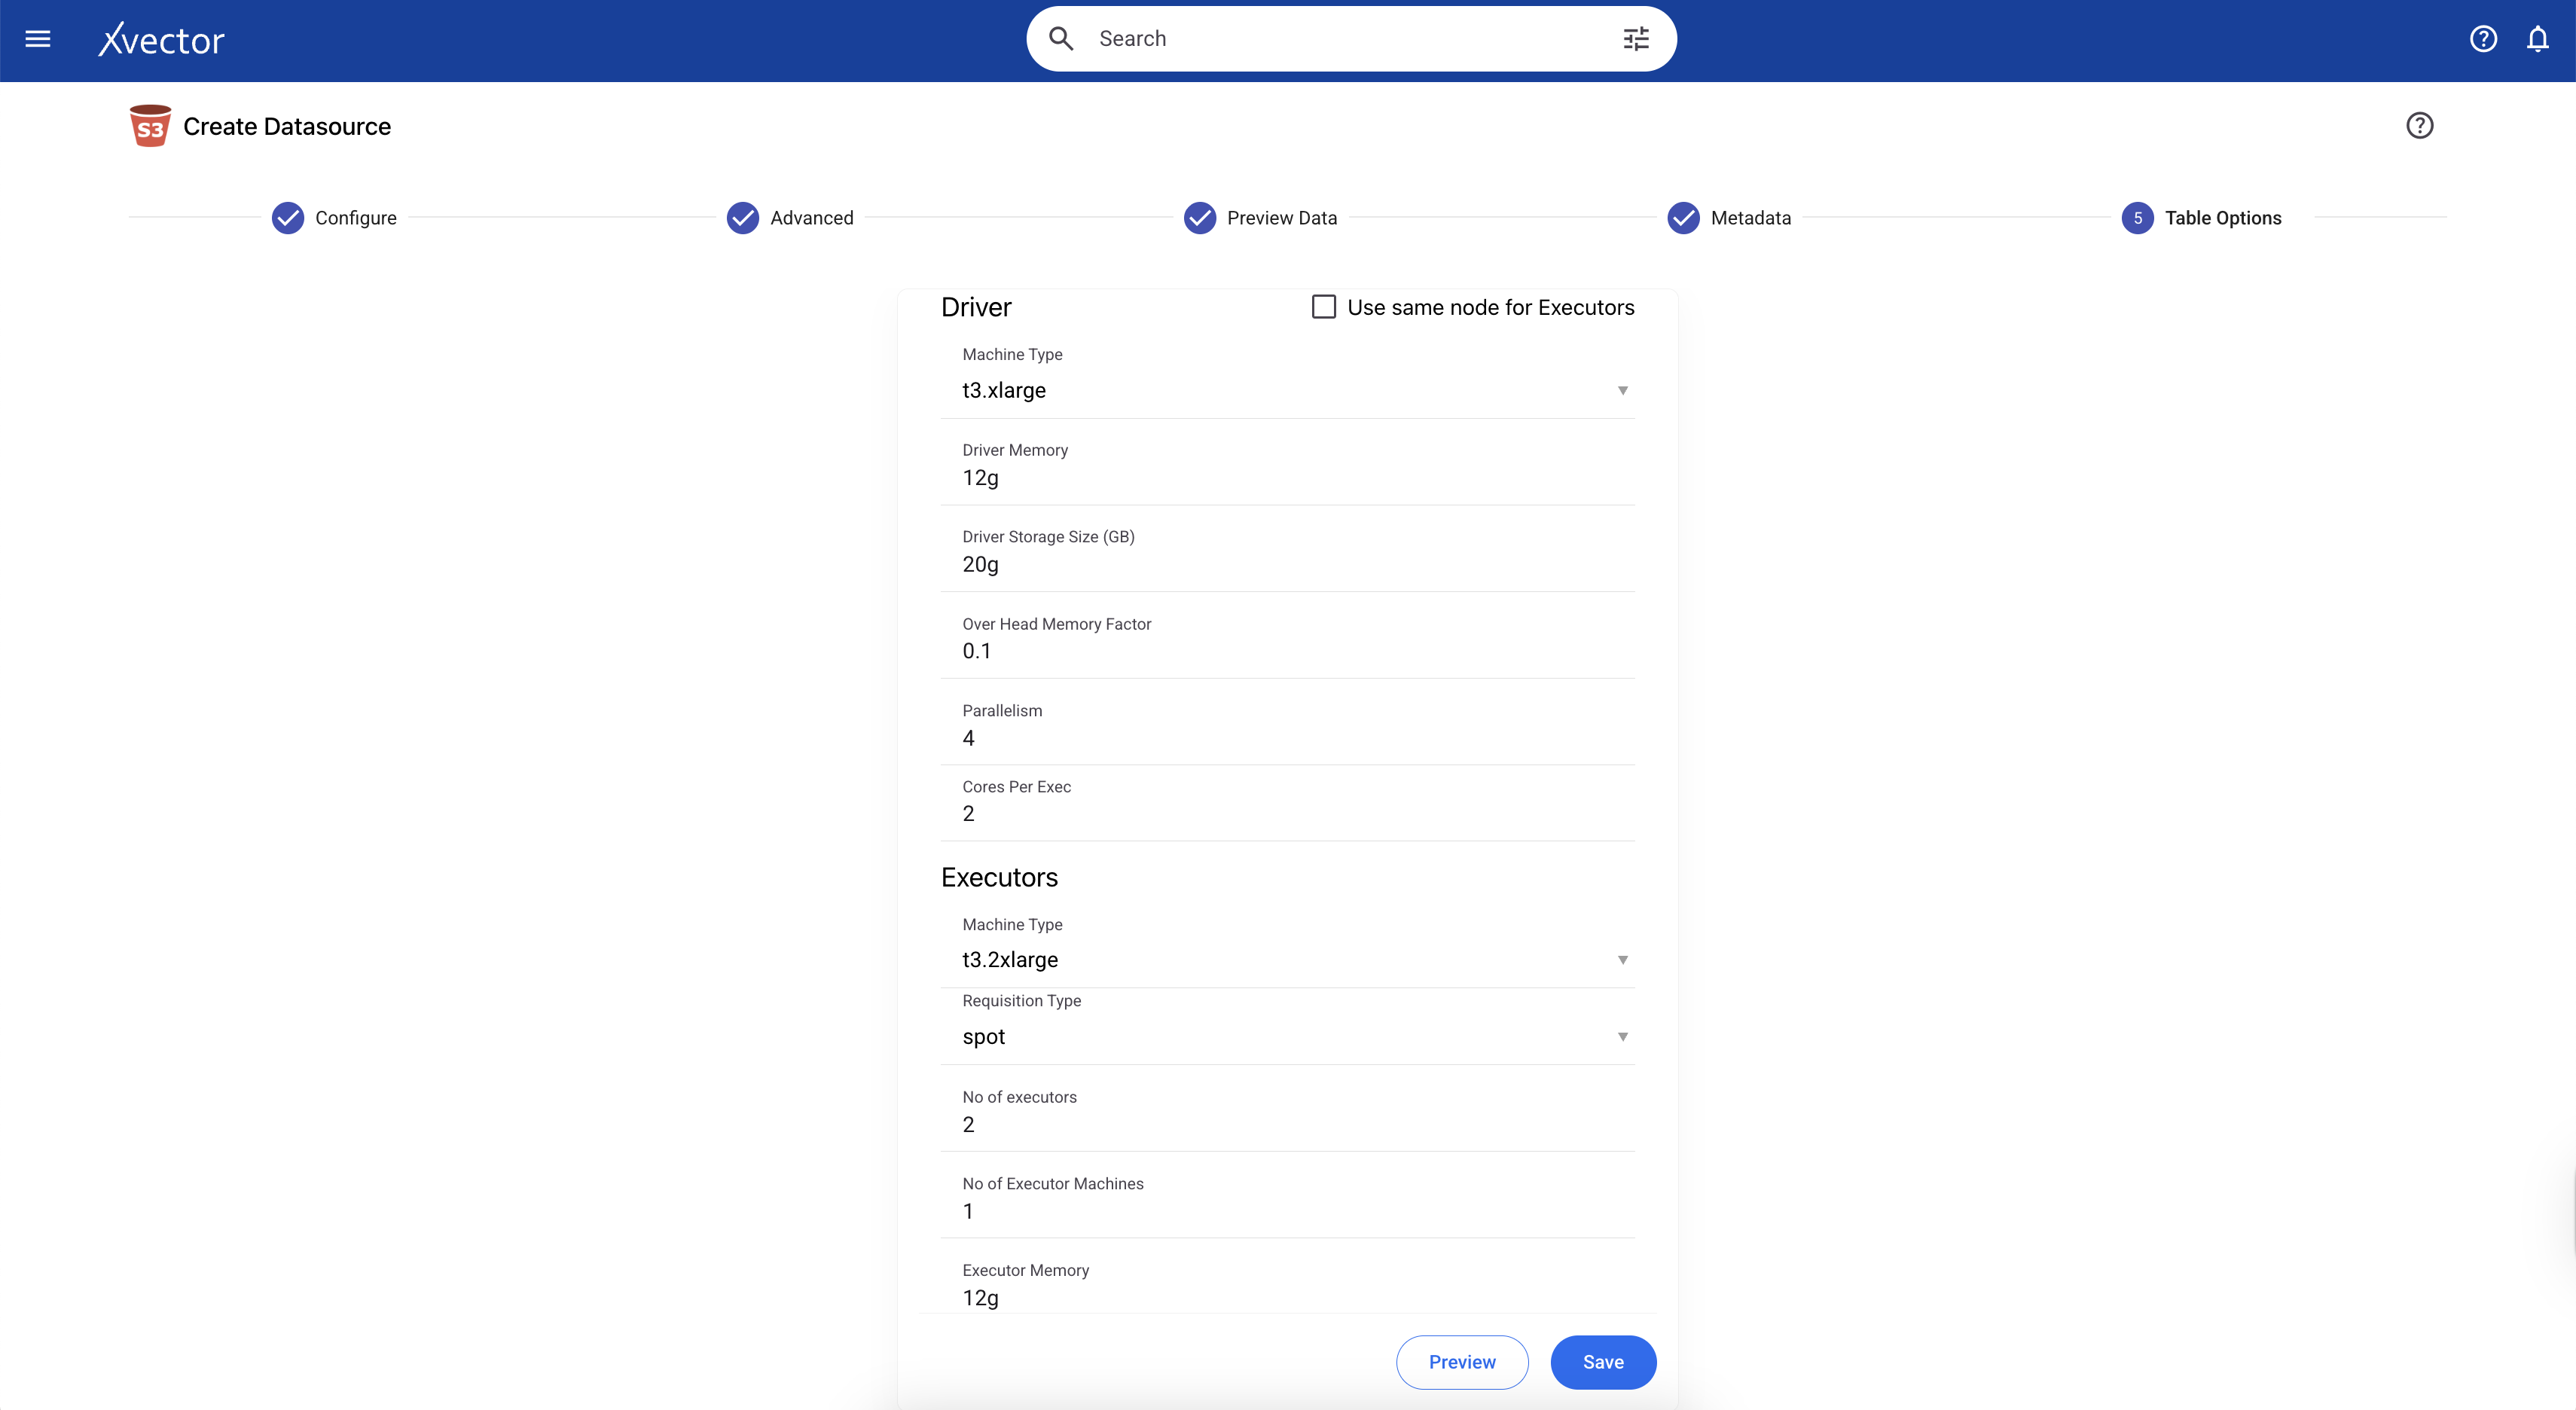
Depending on the volume of data we are ingesting, we can update the machine settings in this tab. In the current example, we can use the default machine specifications:
Machine Type: t3.xlarge
Driver Memory: 12g
Driver Storage Size (GB): 20g
Metadata Updates
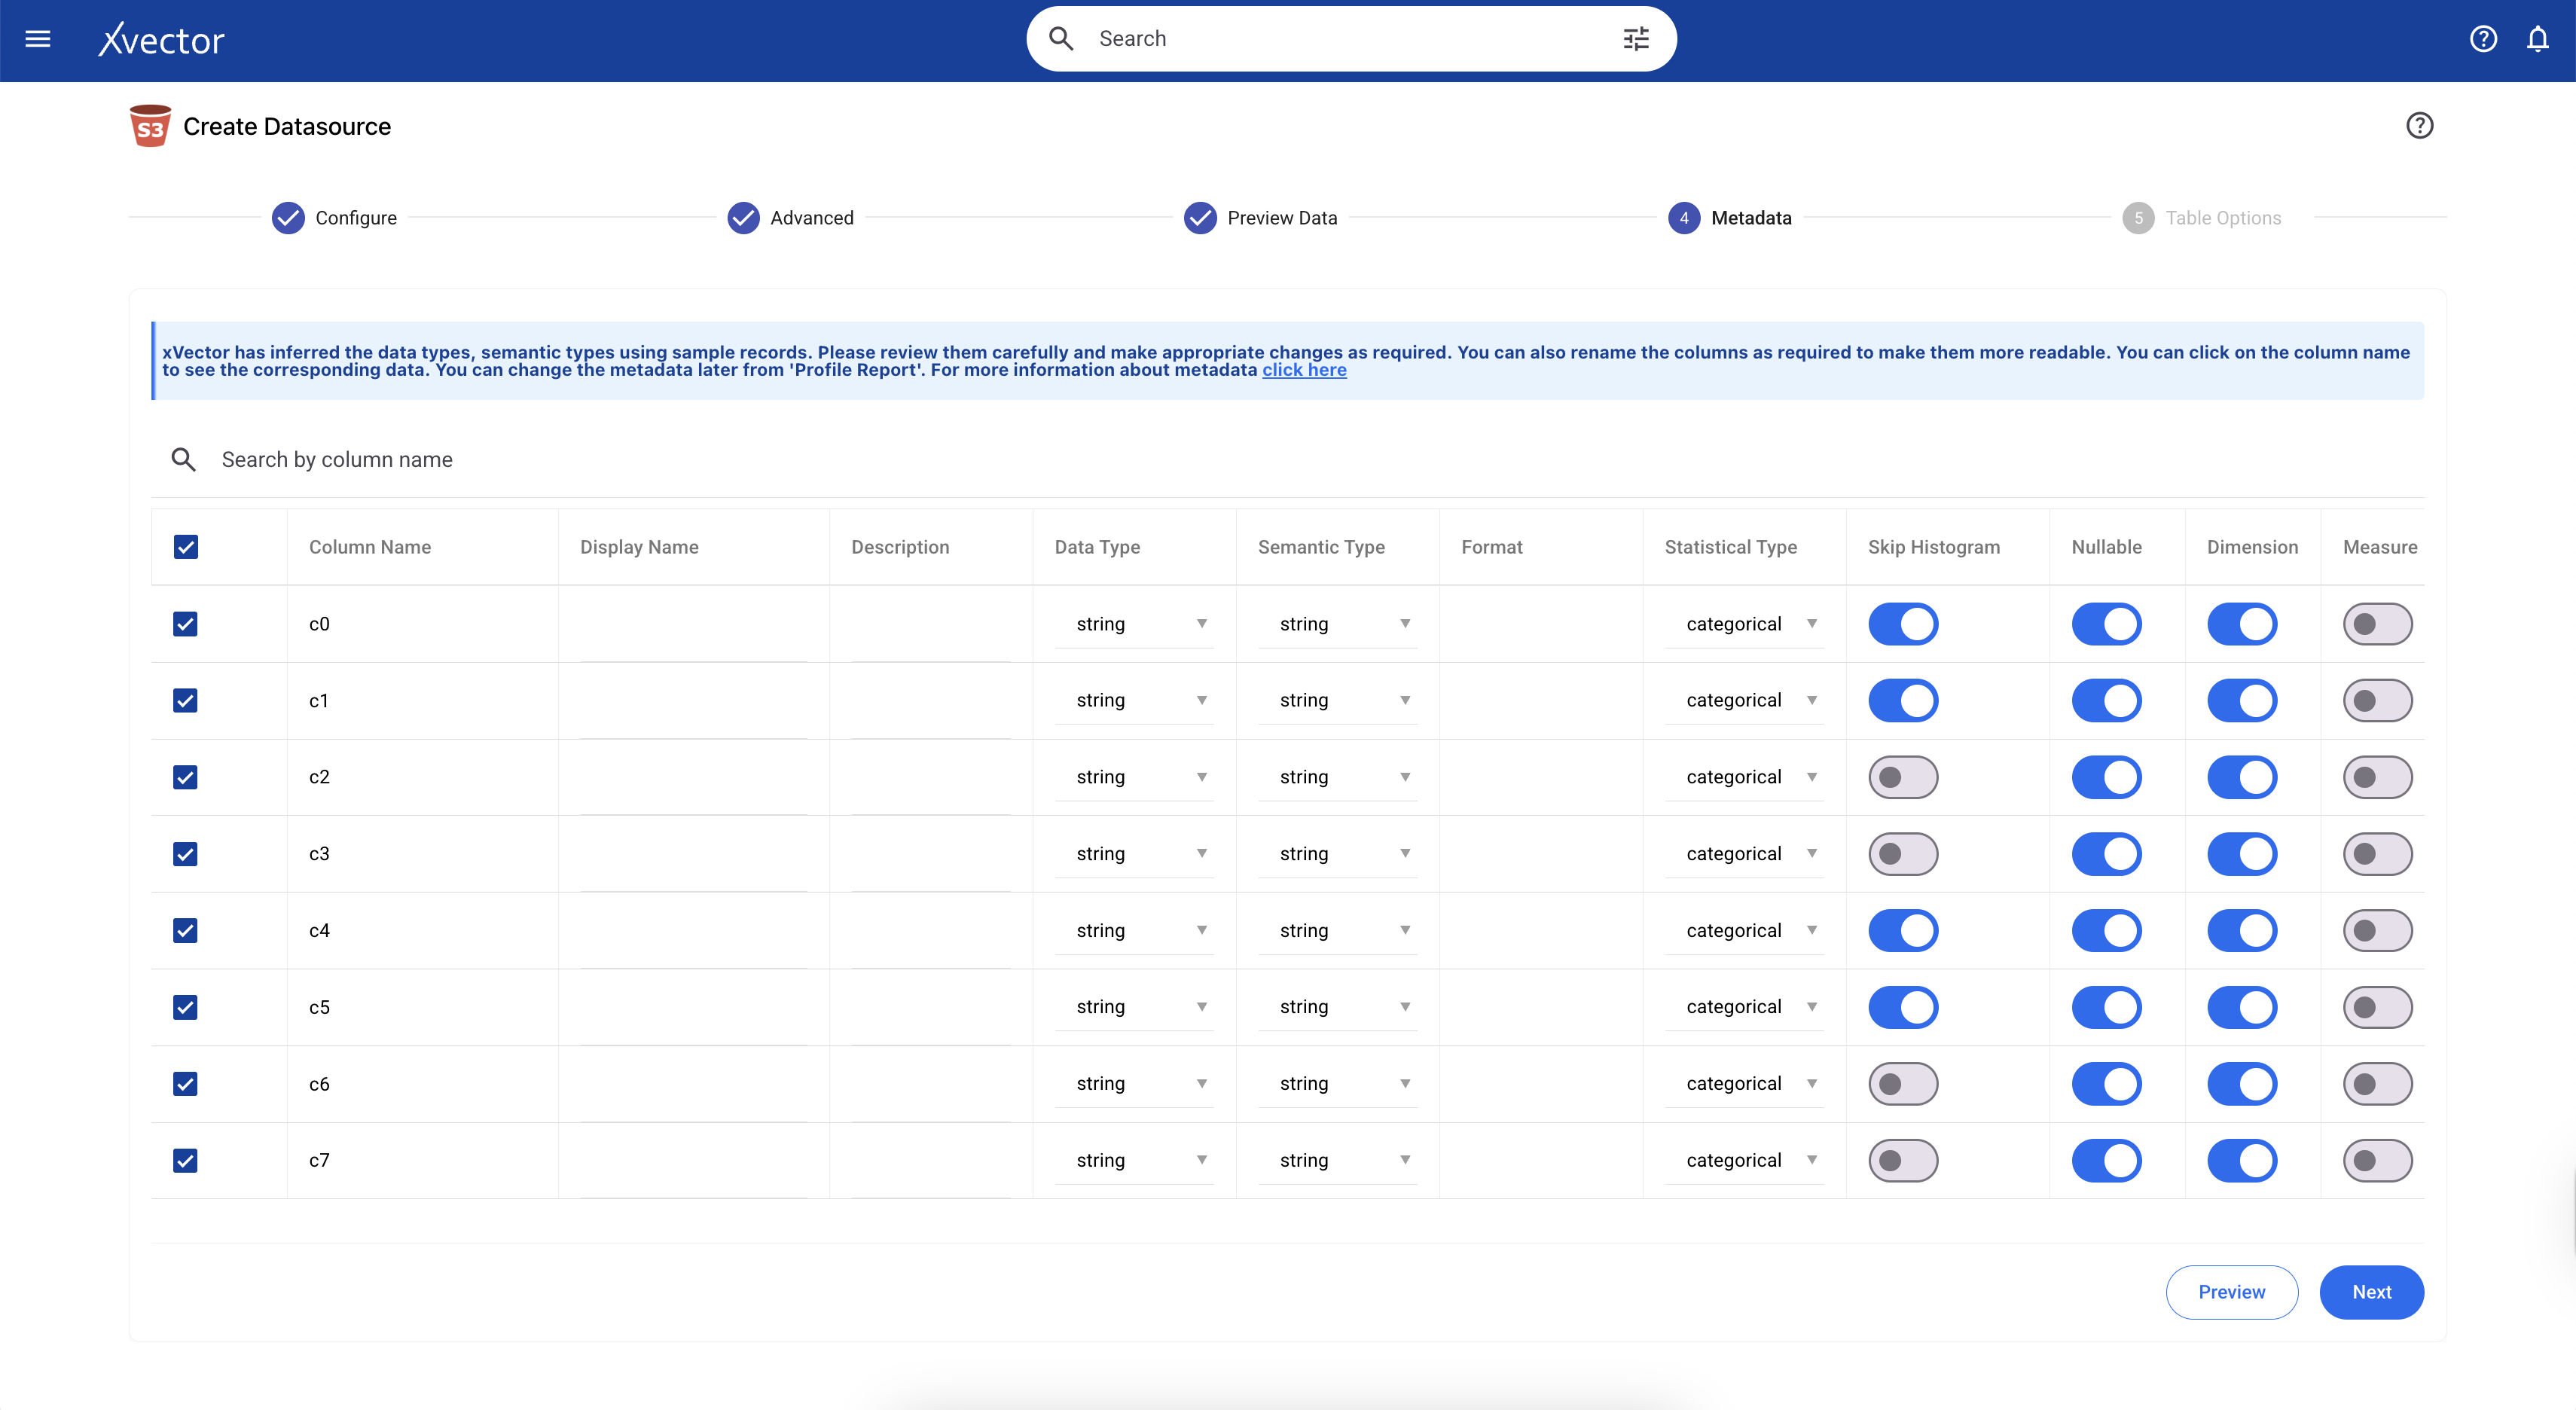
Since we are ingesting a gzip file, all column datatypes will be set to string by default. In xVector, we can update the datatypes of these columns to their actual types in the metadata tab during data ingestion. When we ingest data in other formats, such as CSV files, the data types are automatically inferred, and the user can verify and update accordingly.
Partitioning
Efficient storage layout and partitioning are critical for optimizing data access, ensuring fast query performance, and minimizing infrastructure costs. It determines how data is physically organized on disk or in object storage. When data is partitioned effectively, typically by time, geography, or key business dimensions, query engines can skip irrelevant data (partition pruning), dramatically reducing the amount of data scanned. This translates to faster queries and lower compute costs, particularly important as data volumes grow.
xVector provides an easy mechanism to partition data when creating datasources or datasets. The user can set the Partition Path in the “Table Options” tab as shown below. In our current example of the Pharma Alerts App, partitioning the data by month is the most efficient approach. Time-based partitioning, one of the most common patterns, organizes data by temporal dimensions like date, month, or year, which is what is being applied here.
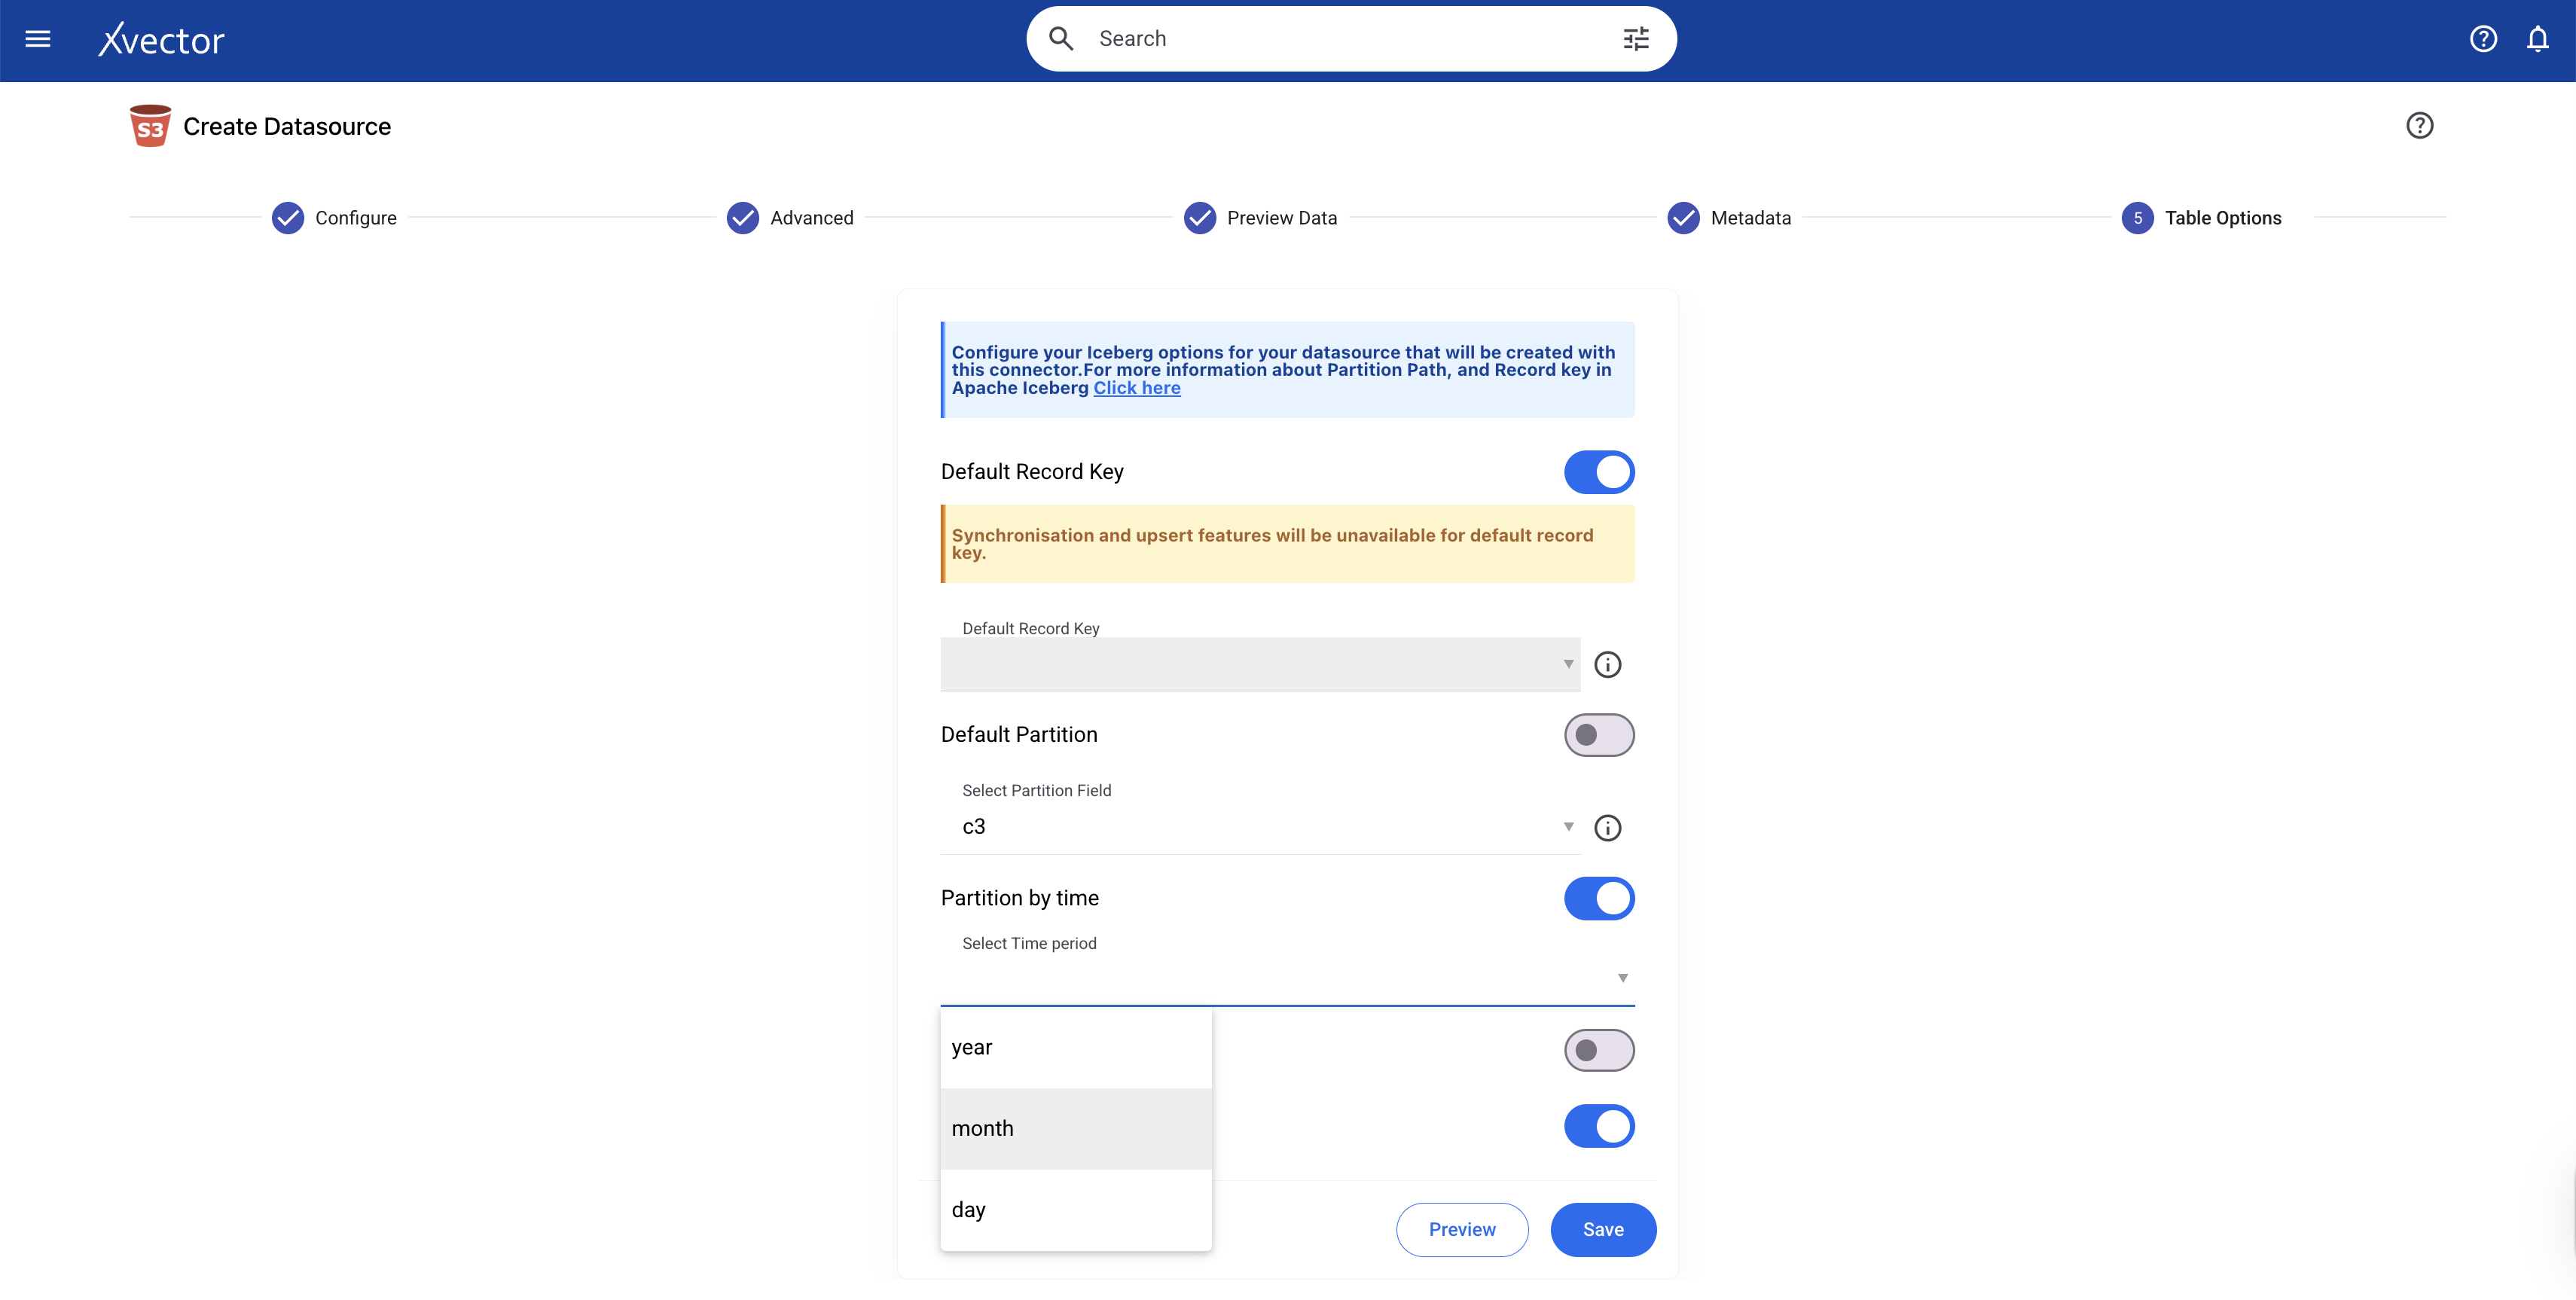
Under the hood, xVector uses Apache Iceberg, which handles storage layout and partitioning through a sophisticated metadata-driven approach that separates logical partitioning from physical file organization.
Partitioning addresses the physical organization of data: how it's laid out on disk or in object storage to optimize access patterns. But there's another dimension to data organization, the logical structure. Physical layout solves only part of the problem. Data systems are not static artifacts. They evolve continuously as source systems change, new data arrives, and errors are discovered. Beyond how data is stored, data engineers must consider how data flows, remains consistent, and evolves. To do so, we look at synchronization, Slowly Changing Dimensions (SCD), backfills, and schema evolution.
Synchronization keeps data current and consistent across systems. SCD tracks how dimensions change over time and maintains historical accuracy. Backfills populate missing historical data to ensure completeness. Schema evolution adapts to structural changes as they happen. Let's understand each in the context of the Apps mentioned above.
Synchronization
Synchronization is the process of keeping data consistent across multiple systems, whether in real time or in batch mode. In a modern data stack, this means keeping operational databases, data warehouses, data lakes, and downstream applications aligned with source systems. Without effective synchronization, organizations face data inconsistencies, duplicate or missing records, and analytics built on stale data that misrepresent business reality.
The challenge intensifies in distributed architectures where data flows through multiple stages: from source systems to staging areas, from raw storage to transformed datasets, and ultimately to dashboards, reports, and machine learning models. Each stage introduces potential synchronization points where timing, dependencies, and update frequencies must be managed.
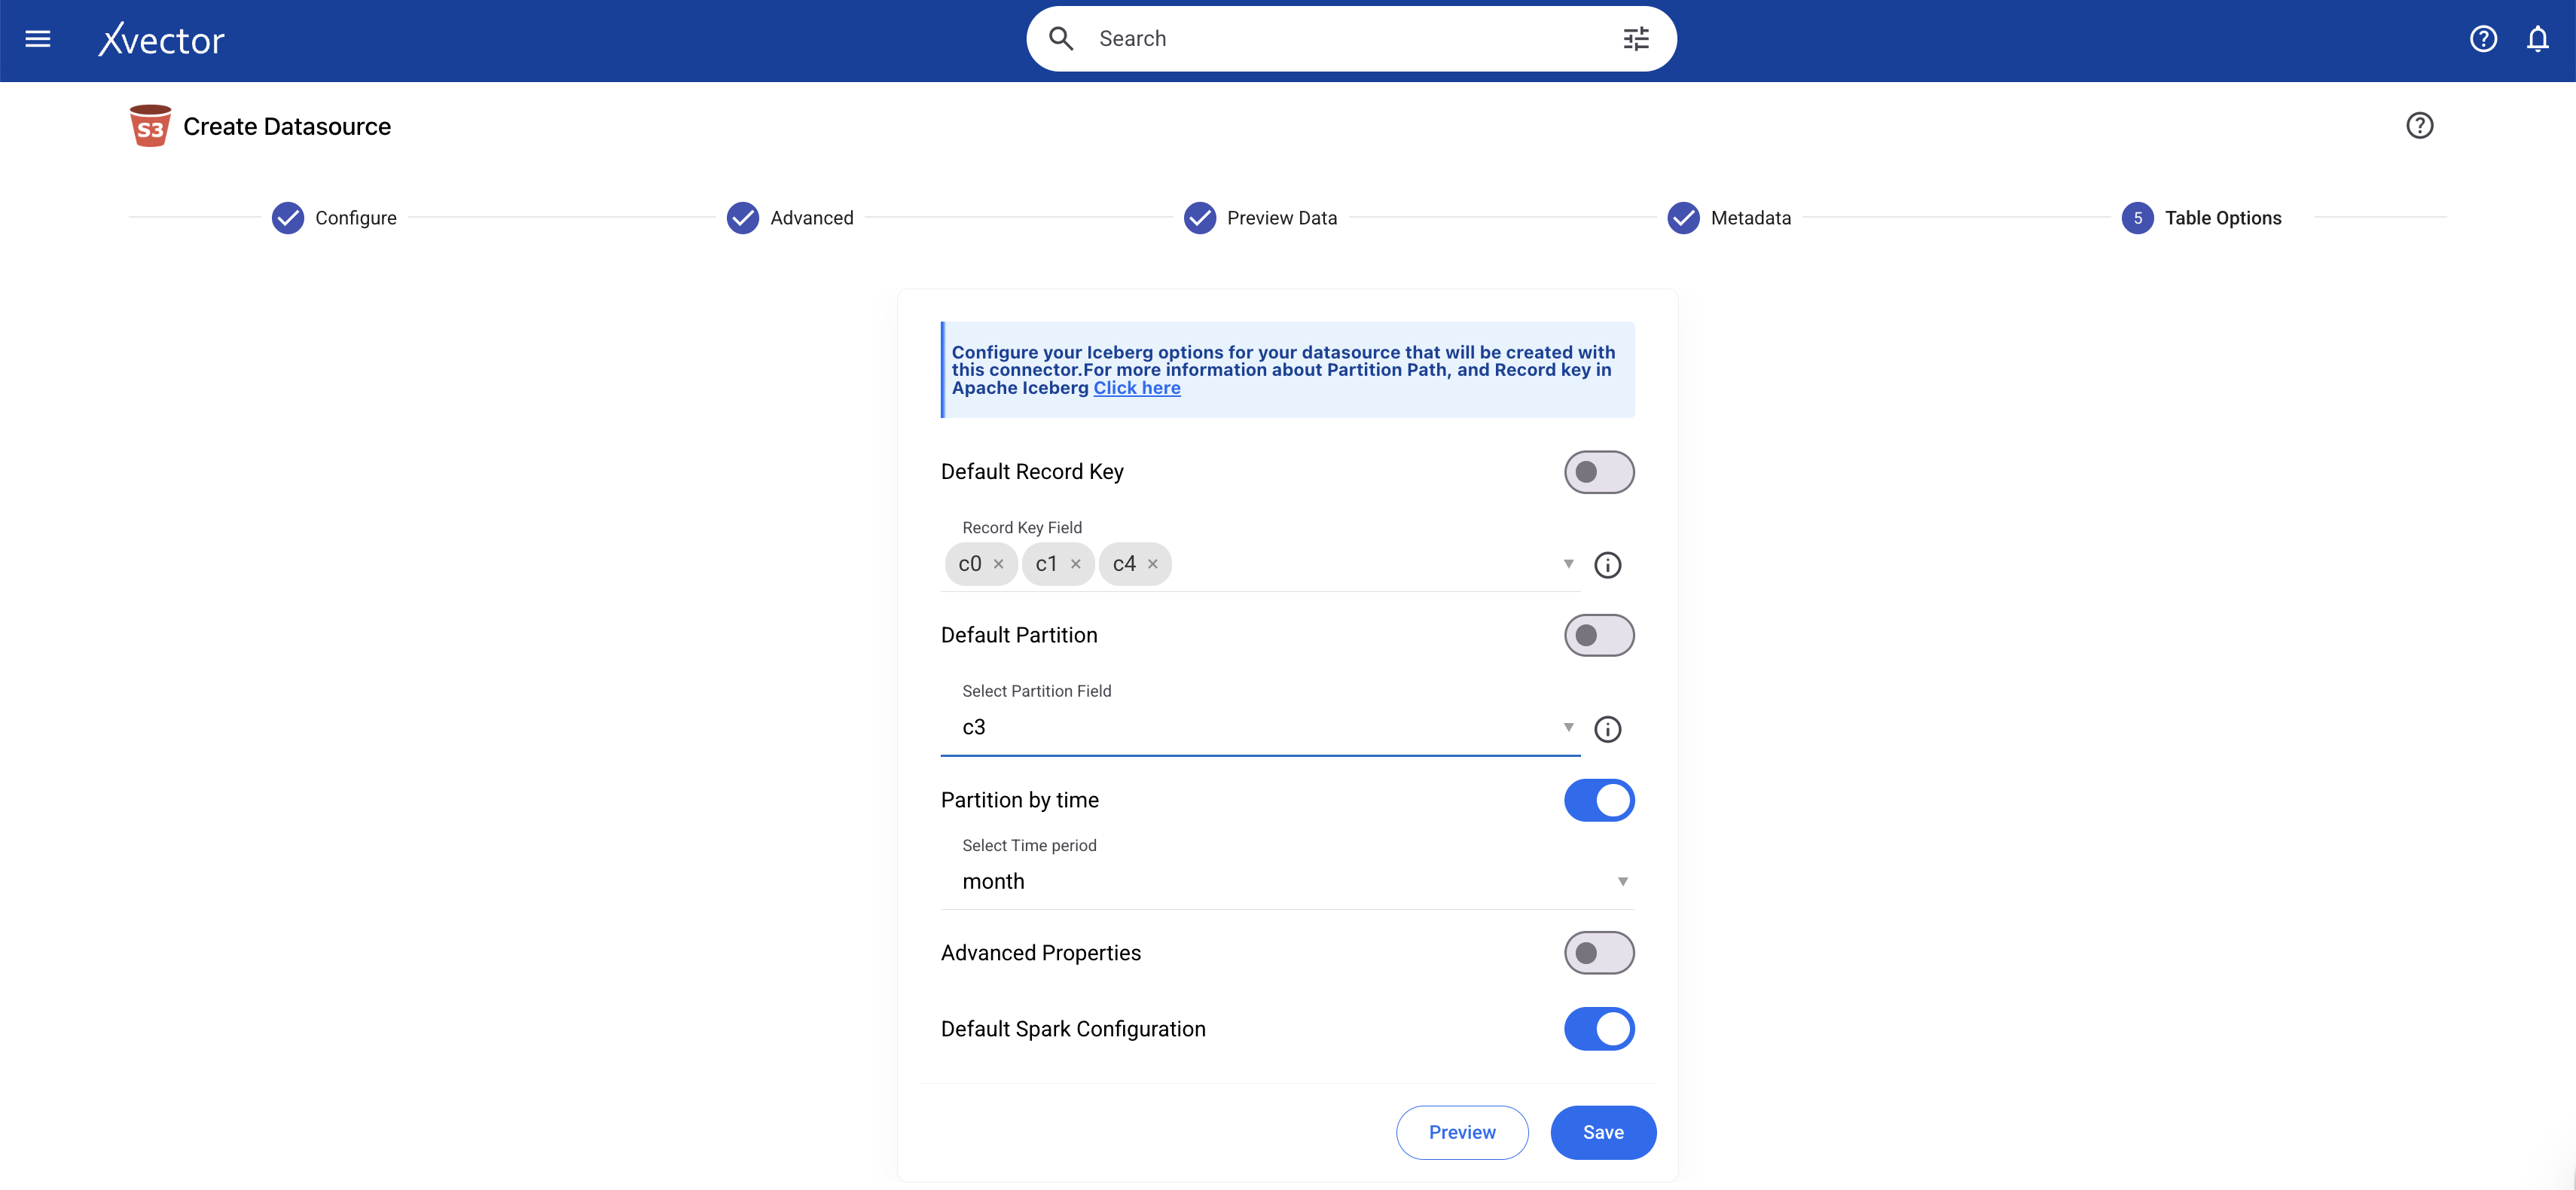
Record Keys
Effective synchronization requires unique identifiers, record keys, to determine which records are new, which need updates, and which should be deleted. In xVector, users define record keys for datasources/datasets to enable proper merge operations during synchronization. For example, a pharmaceutical dataset will use a composite key of (Claim_id, Patient_id, Diagnosis_code) to uniquely identify each record. When new data arrives, xVector uses these keys to match incoming records to existing ones, performing upserts (updating existing records or inserting new ones) rather than appending duplicates. Synchronization requires properly defined record keys.
Implementing Synchronization Policies
xVector addresses synchronization through configurable update policies attached to each resource in a DataApp. Resources can follow four update patterns:
- On-Demand: Manual refresh when triggered by a user
- OnSchedule: Time-based refresh at specified intervals
- Rules: user-defining rules to update
This policy-based approach handles complex dependency chains. For example, in the Pharma Leads App, the claims data gets updated weekly, and reference data like ICD code mappings, physician dimensions, practice affiliations, and KAM targets update only occasionally, perhaps monthly or quarterly, each with different schedules and dependencies. When a source updates, the system notifies dependent resources, which execute based on their configured policies, ensuring consistency without unnecessary recomputation.
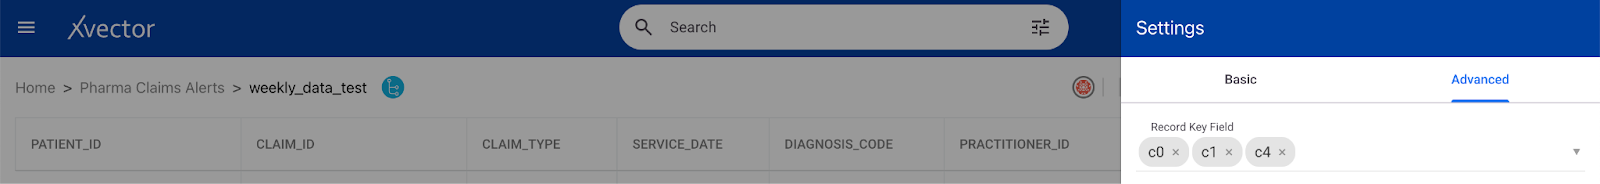
Record keys for synchronization can be configured either during data ingestion or after the datasource is created. The image shows the configuration during data ingestion.
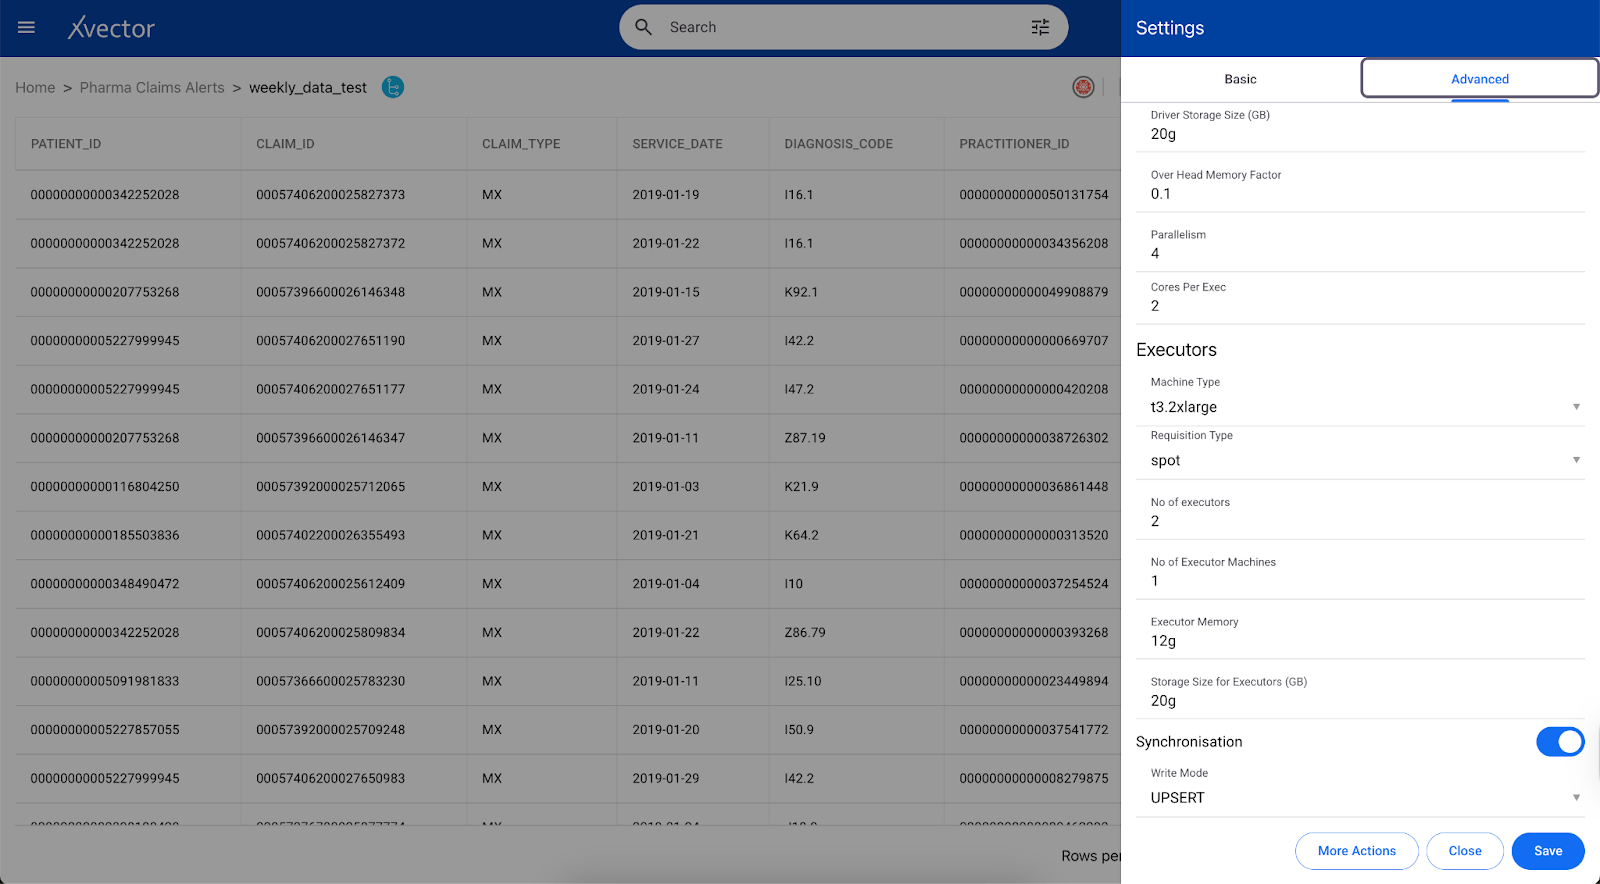
You can set up synchronization after the data source is created on the Datasource view page.
Schema Evolution
Schema evolution is the practice of adapting data pipelines to handle structural changes in source systems without breaking existing functionality. As business requirements shift, data schemas must accommodate new fields, modified data types, renamed attributes, or deprecated columns. Pipelines designed without schema evolution in mind become brittle; a single column addition or type change can cascade into failures across downstream dashboards, reports, and models.
Effective schema evolution requires several strategies working in concert.
Forward compatibility ensures pipelines can handle new fields added to source data, typically by allowing nullable columns or default values.
Backward compatibility maintains support for older schema versions, so historical data remains queryable.
Schema versioning tracks changes over time, documenting when and why structures evolved.
Impact analysis maps how schema changes propagate through downstream systems, identifying which datasets, transformations, and applications need updates before implementing changes.
Consider a customer dataset that initially contains separate first_name and last_name fields. As the business evolves, the source system adds full_name and preferred_name fields to support personalization. Rigid pipelines that expect exactly two name columns will fail. Well-designed pipelines detect the new fields, incorporate them into the target schema, and allow downstream systems to adopt them gradually. Historical records lacking these fields remain valid when populated with nullable columns or default values, whereas new records populate all available fields.
Schema Evolution in xVector
xVector provides alerts to users whenever the schema undergoes structural changes, such as when a new column is added or a column's data type changes. Users will be notified of errors, and they will then manually apply the necessary updates using xVector tools. Users must then decide whether to transform the incoming data, modify the target schema, or update their DataApp logic to handle the new structure. This explicit error handling ensures teams understand and approve schema changes rather than having them propagate silently through the system. For example, consider the case where the datatype of a column, PATIENT_ID, is updated from a string to an integer in the claims dataset in the Pharma Claims Alerts App. When data is ingested after a datatype change, it throws an error and sends an alert to the user. The user would apply an xFlow Action, DataType, to update the datatype in the datasource; after that, the new data is ingested.
Under the hood, xVector follows the Iceberg’s evolution.
Compression
Compression reduces the physical size of data stored on disk or in object storage, directly lowering storage costs and improving query performance. When data is compressed, fewer bytes need to be read from storage during query execution, reducing I/O time, which is often the primary bottleneck in analytical workloads. A 1TB dataset compressed to 300GB not only reduces storage costs by 70% but also enables queries to read less data, completing faster with lower compute requirements.
The choice of compression algorithm involves tradeoffs between compression ratio and CPU overhead. Algorithms like Gzip achieve high compression ratios (often 5:1 or better) but require significant CPU cycles to compress and decompress data, slowing down both writes and reads. At the other extreme, LZ4 offers minimal compression but extremely fast decompression, prioritizing query speed over storage savings.
xVector uses Snappy compression, which effectively balances these trade-offs. Snappy achieves moderate compression ratios (typically 2-3:1) while maintaining high compression and decompression speeds. This makes it ideal for analytical platforms where data is written once but read many times; the slight reduction in compression ratio compared to Gzip is outweighed by significantly faster query performance. For workloads involving frequent data scans, Snappy's low CPU overhead ensures that decompression doesn't become a bottleneck, keeping queries responsive even on large datasets.
GDPR Compliance & Data Privacy
User activity data contains sensitive personal information (Personally Identifiable Information - PII) and requires strict regulatory compliance (e.g., General Data Protection Regulation - GDPR, California Consumer Privacy Act - CCPA).
The General Data Protection Regulation (GDPR) is a European Union (EU) law that governs how organizations collect, store, process, and protect personal data. Enforced on May 25, 2018, GDPR applies to any organization worldwide that processes the personal data of EU residents.
Key GDPR Principles
GDPR mandates organizations to follow seven key principles when handling personal data:
Lawfulness, Fairness, Transparency: Data must be protected legally, fairly, and transparently.
Purpose Limitation: Data should be collected for specific, legitimate purposes and not used beyond those.
Data Minimization: Collect only the data necessary for processing.
Accuracy: Ensure personal data is accurate and up-to-date
Storage Limitation: Retain data only as long as needed and securely delete outdated records
Integrity & confidentiality (security): Use encryption, anonymization, and access controls to protect data.
Accountability: Organizations must document compliance efforts and demonstrate adherence.
GDPR directly impacts data pipelines, storage, and processing. Below are some processes required to be GDPR or PII compliant:
- Anonymization & Tokenization:
- Mask PII fields (email, phone_number) before storing logs.
- Right to Be Forgotten:
- Implement a data-deletion pipeline that allows users to request the removal of their personal data.
- Branching and Tagging of Snapshots in Inceberg:
- Branching and tagging can be used to handle GDPR requirements and retain important historical snapshots for auditing. Branches can also be used in data engineering workflows to enable experimental branches for testing and validating new jobs.
As an example, the customer may want to remove the email address and phone number of a user from the datasources.
Currently, we support only Enterprise Customers. For Enterprise Customers, xVector can bring up the cluster, including the customer database, in the Customer’s cloud environment, where the data stays within their confines. We can also set up a cluster on-prem if required. This will enable the customer to manage data in full compliance with their policies and rules. The customer will be responsible for handling the data in their environment.
Reference Data Layer
Overview
The Reference Data Layer organizes ingested data into logical business domains that align with analytical needs. Rather than maintaining fragmented data across silos, this layer establishes standardized structures, enforces governance policies, and provides the foundation for consistent analytics. In the SaaS Enterprise App, domains include User Activity (use tables such as users, event logs, sessions), Customer Analytics (use tables such as accounts, subscriptions, renewals, etc.), Product Analytics (use tables such as feature usage, adoption), and Marketing Analytics (use tables such as campaigns, leads). This layer serves as the curated foundation for all analytics, dashboards, and models.
Building this layer requires addressing several interconnected challenges: ensuring data quality, enriching raw data with business context, transforming it into analytics-ready formats, keeping it synchronized with source systems, optimizing storage for performance, and monitoring reliability. Each of these concerns shapes how the reference layer is designed and maintained.
Let’s first look at profiling and quality.
Profiling and Quality
Raw data arrives with inconsistencies that compromise analytical accuracy. Data quality frameworks implement systematic validation to detect and remediate issues before they propagate downstream.
Validation Rules enforce required fields and data constraints at ingestion. Critical fields such as user_id and customer_id must be populated depending on the target analytics. Each dataset defines its own required fields based on downstream reporting and analysis needs. xVector handles validation through filtering and enrichment: remove records with null values in required columns during dataset creation, or apply enrichment actions to fill nulls with default values. For complex validation logic, users can write custom expressions that evaluate record validity based on multiple conditions.
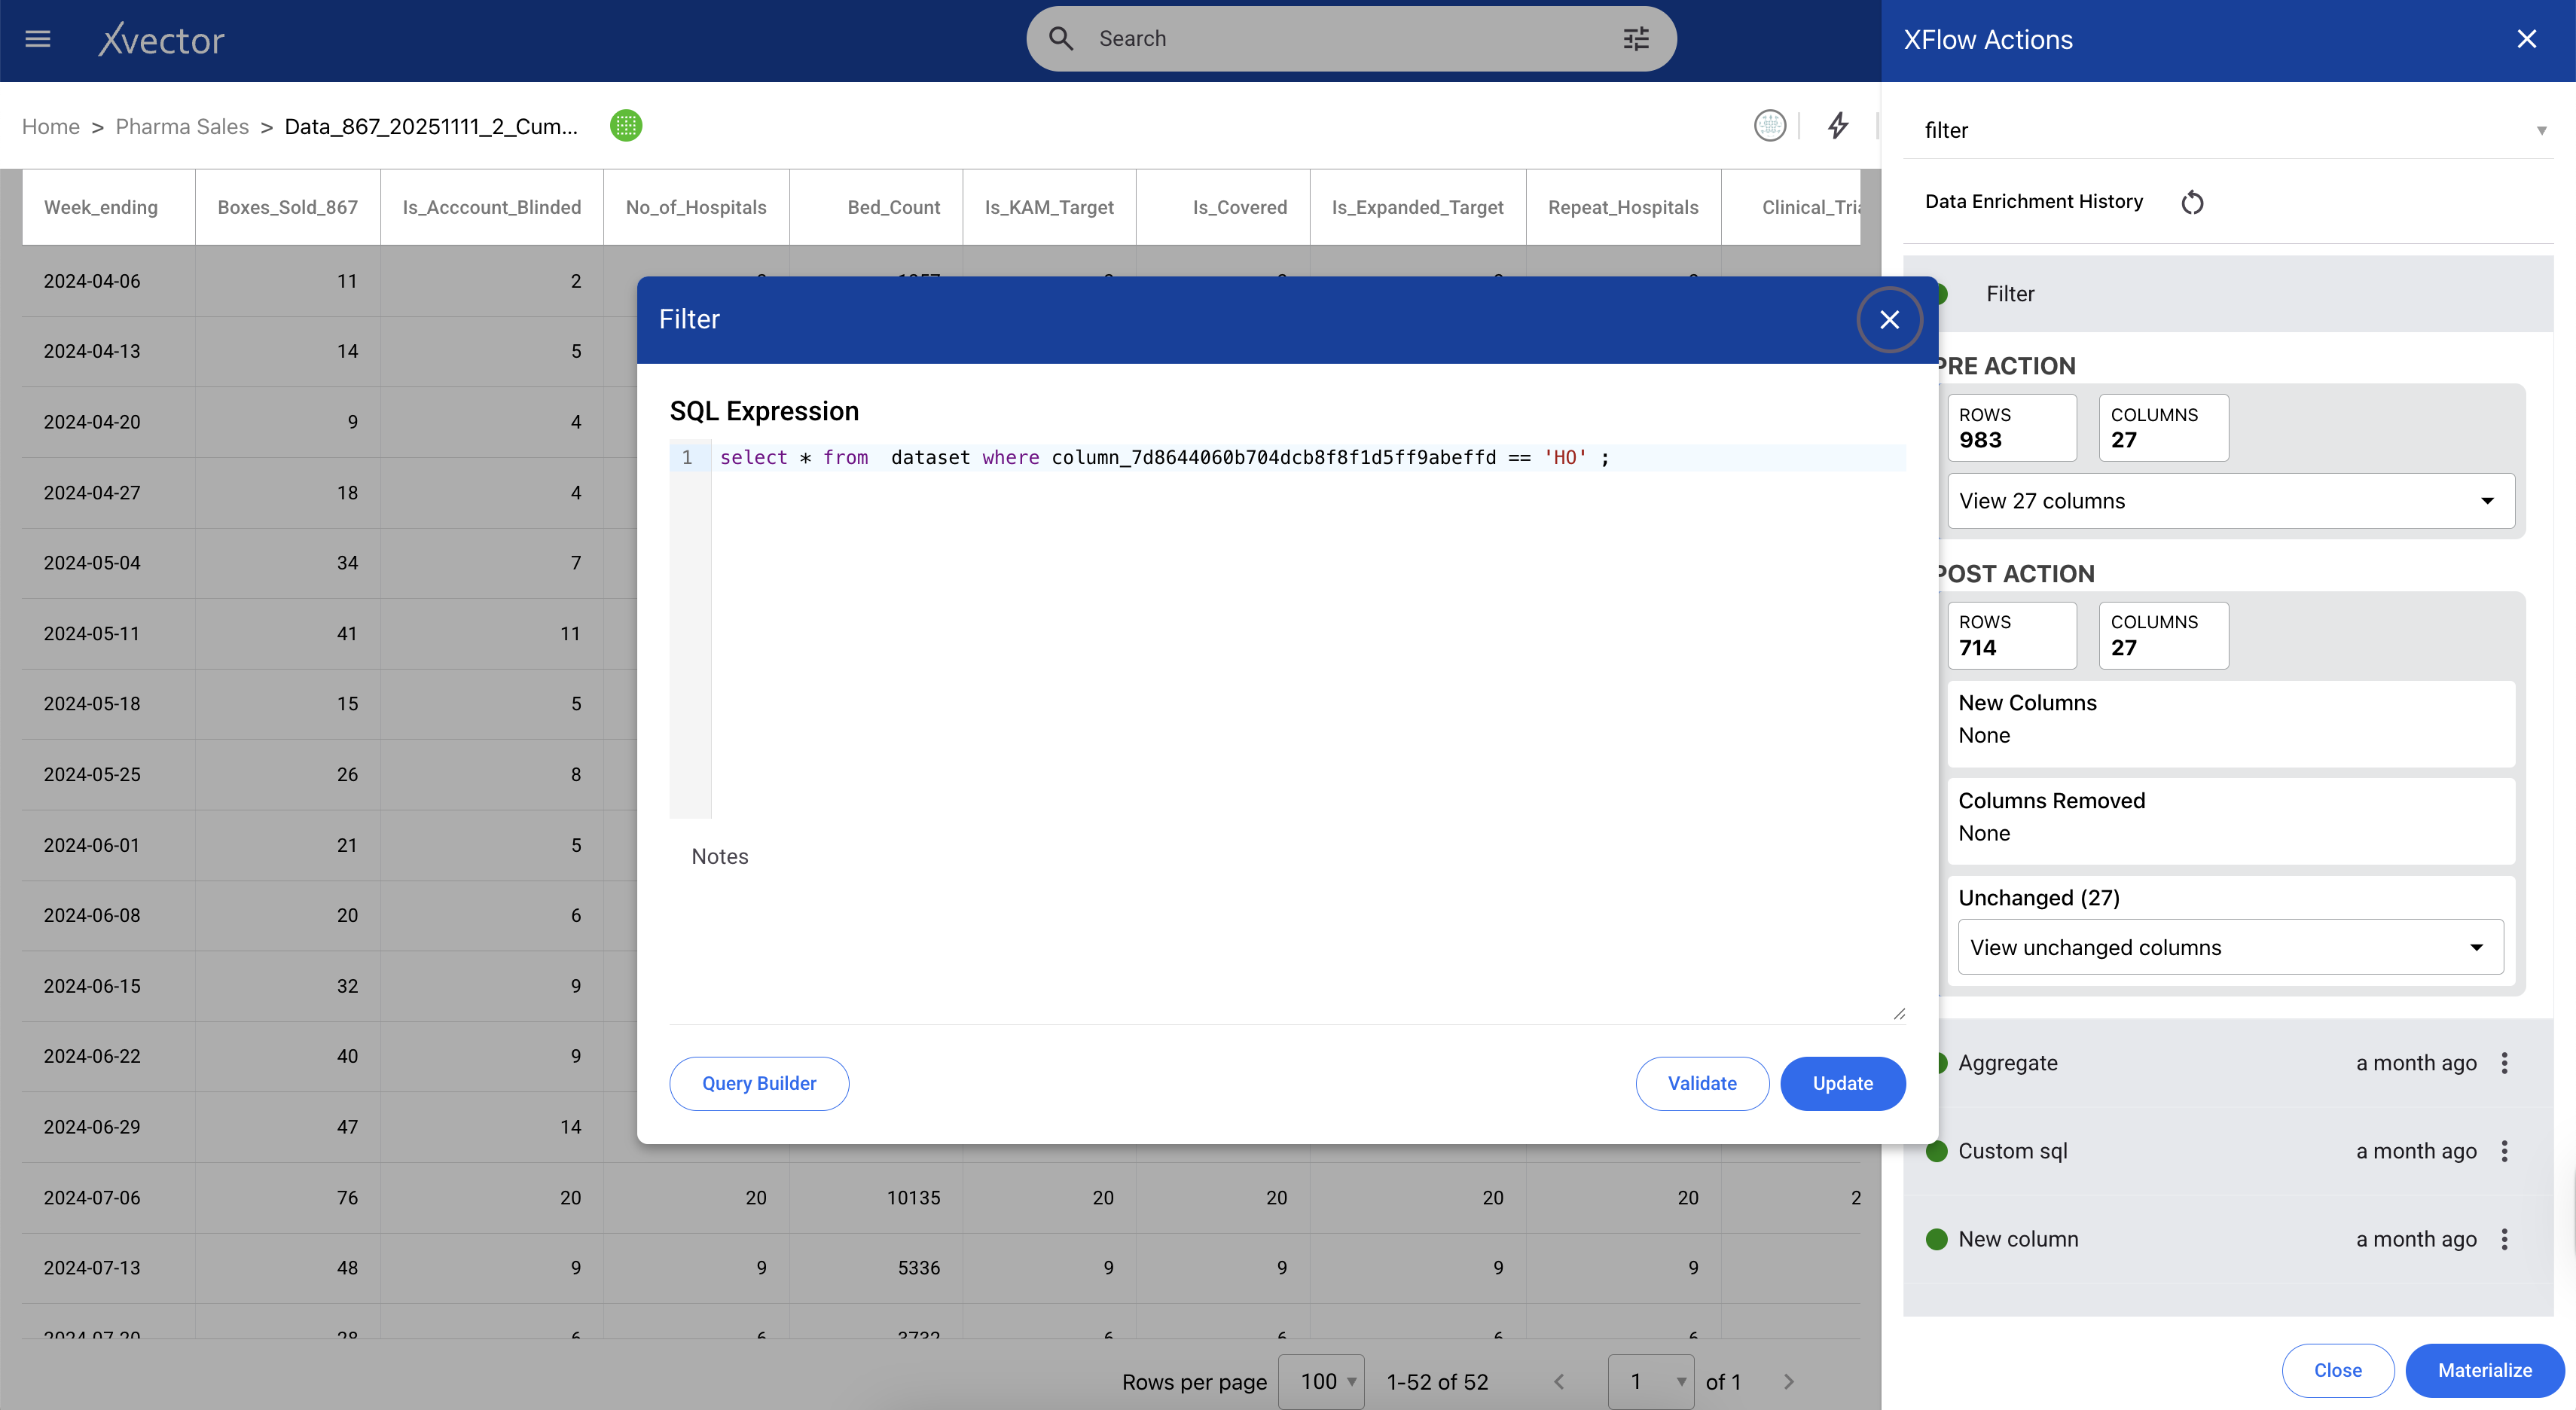
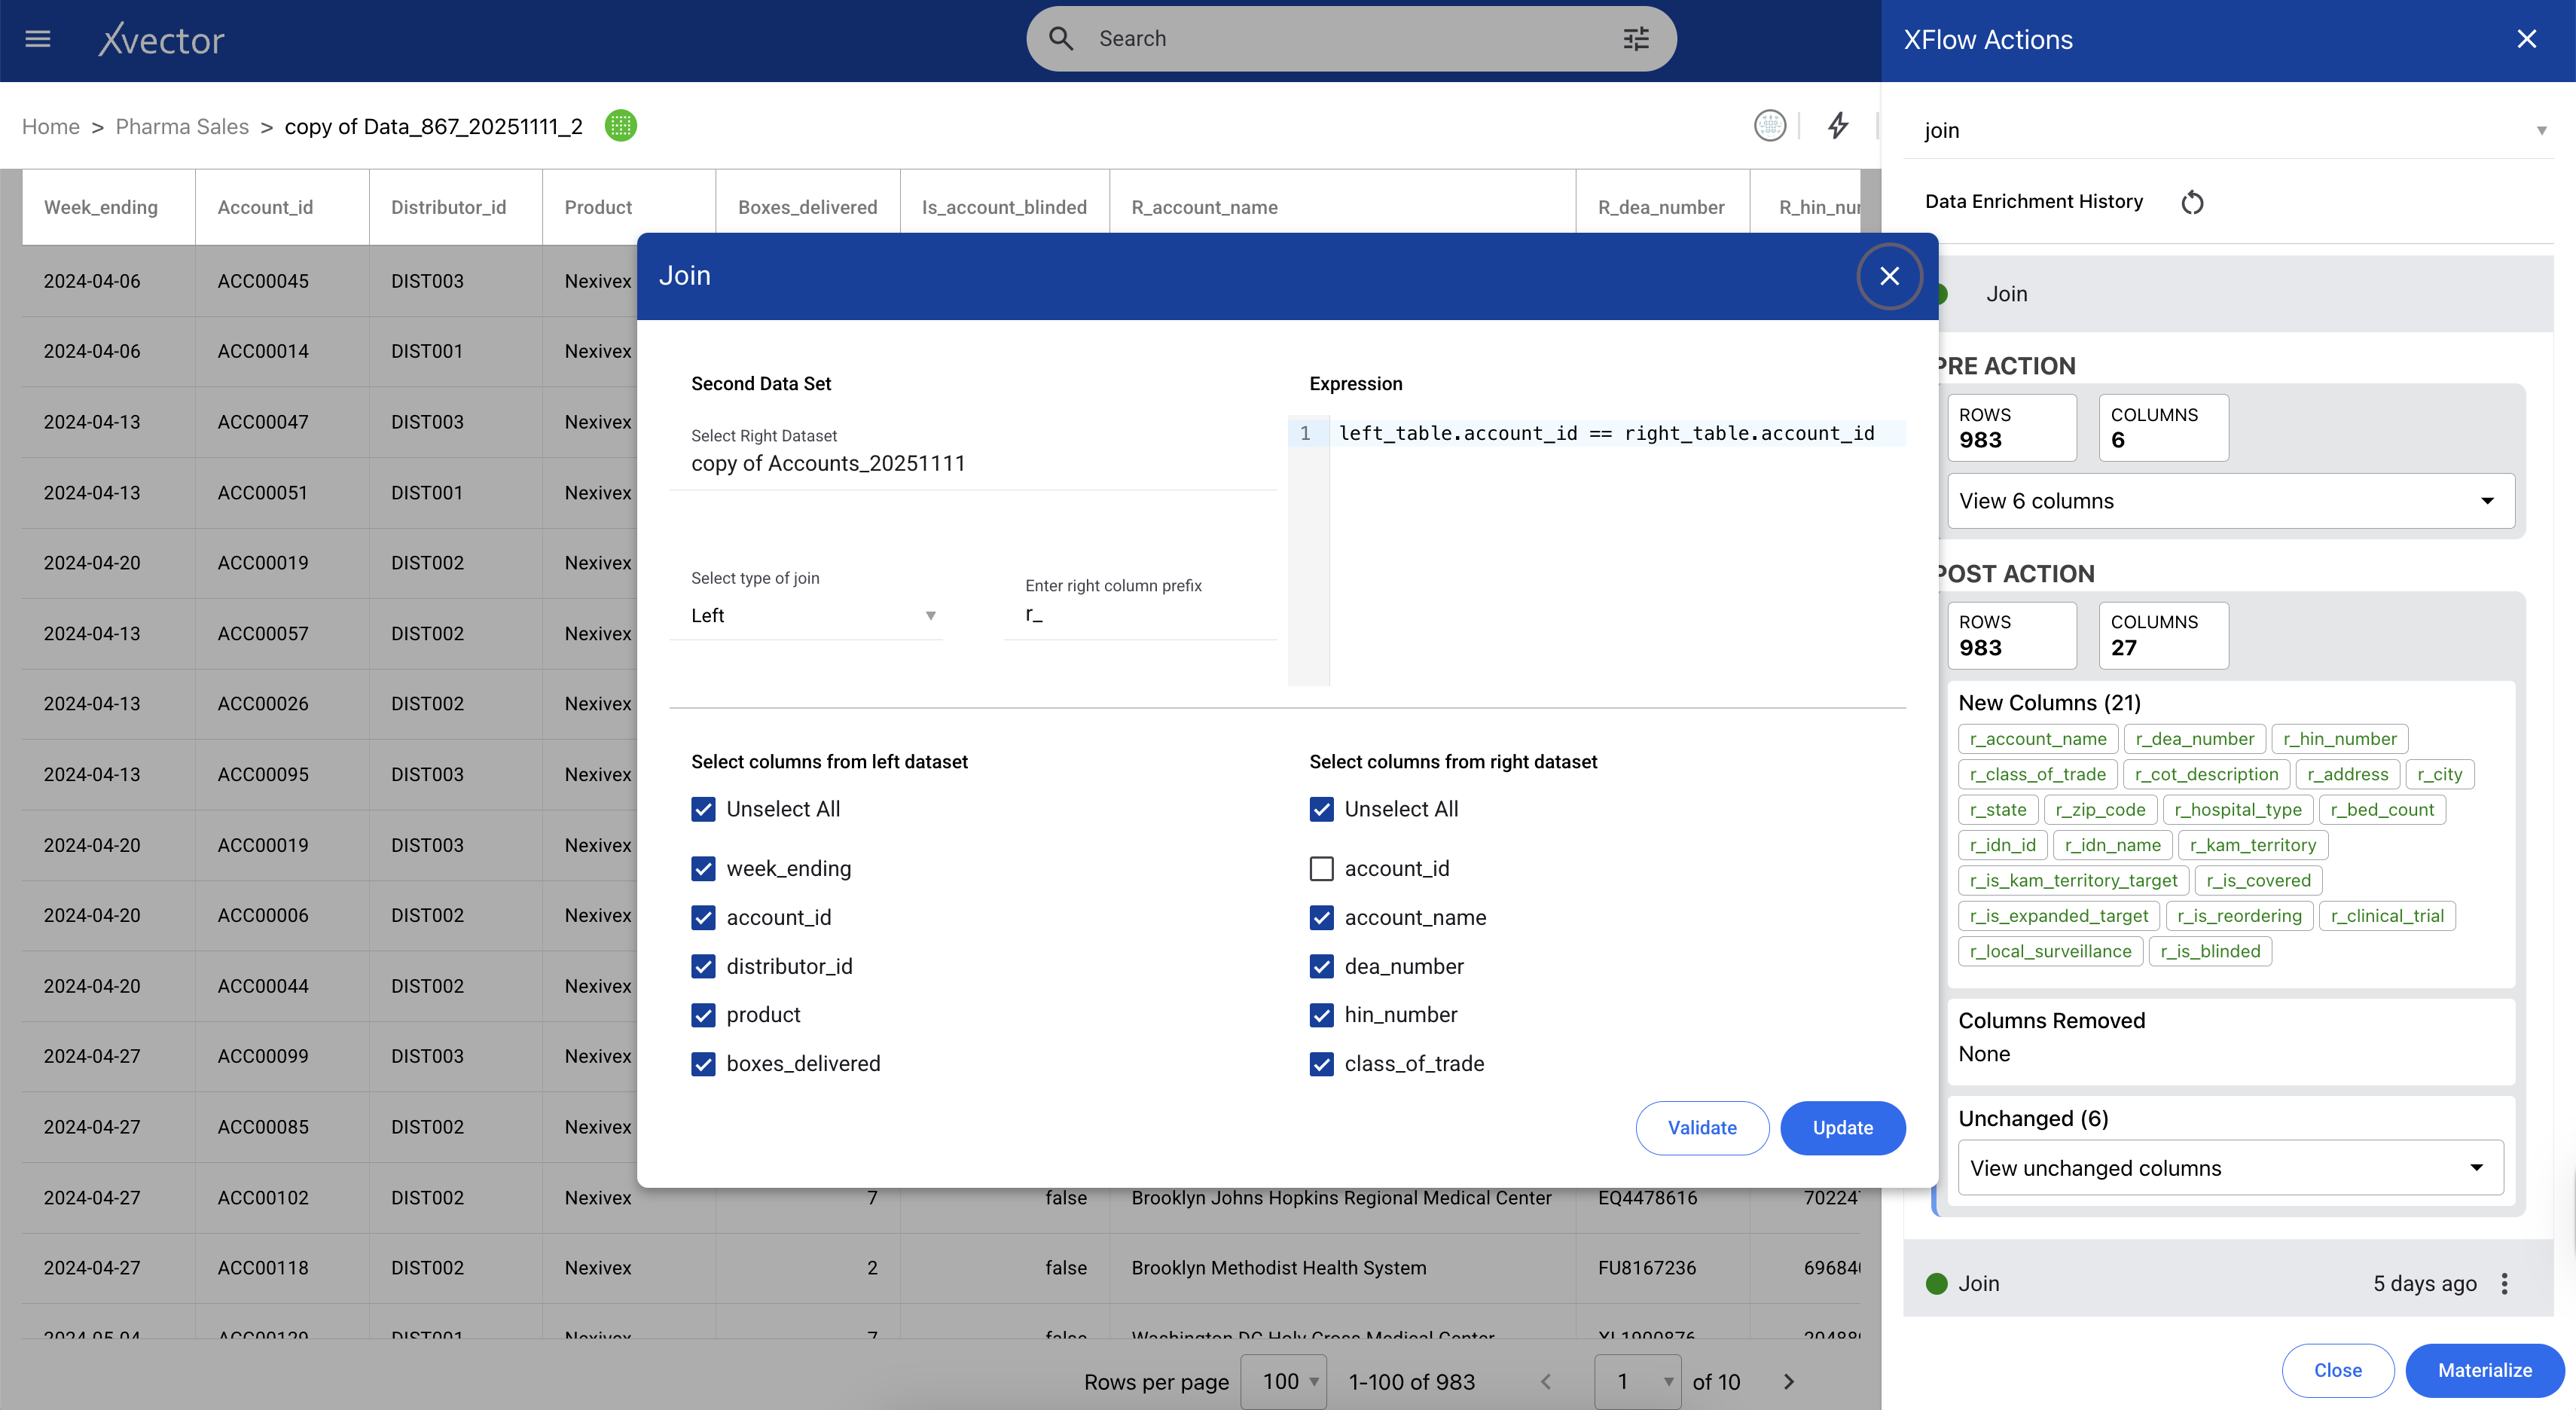
Referential Integrity verifies that foreign keys reference valid parent records. A user activity event requires a valid customer_id in the customer table. Inserting events for non-existent customers creates orphaned records that break joins and skew aggregations. In xVector, we provide join functions that let us write expressions to avoid such scenarios.
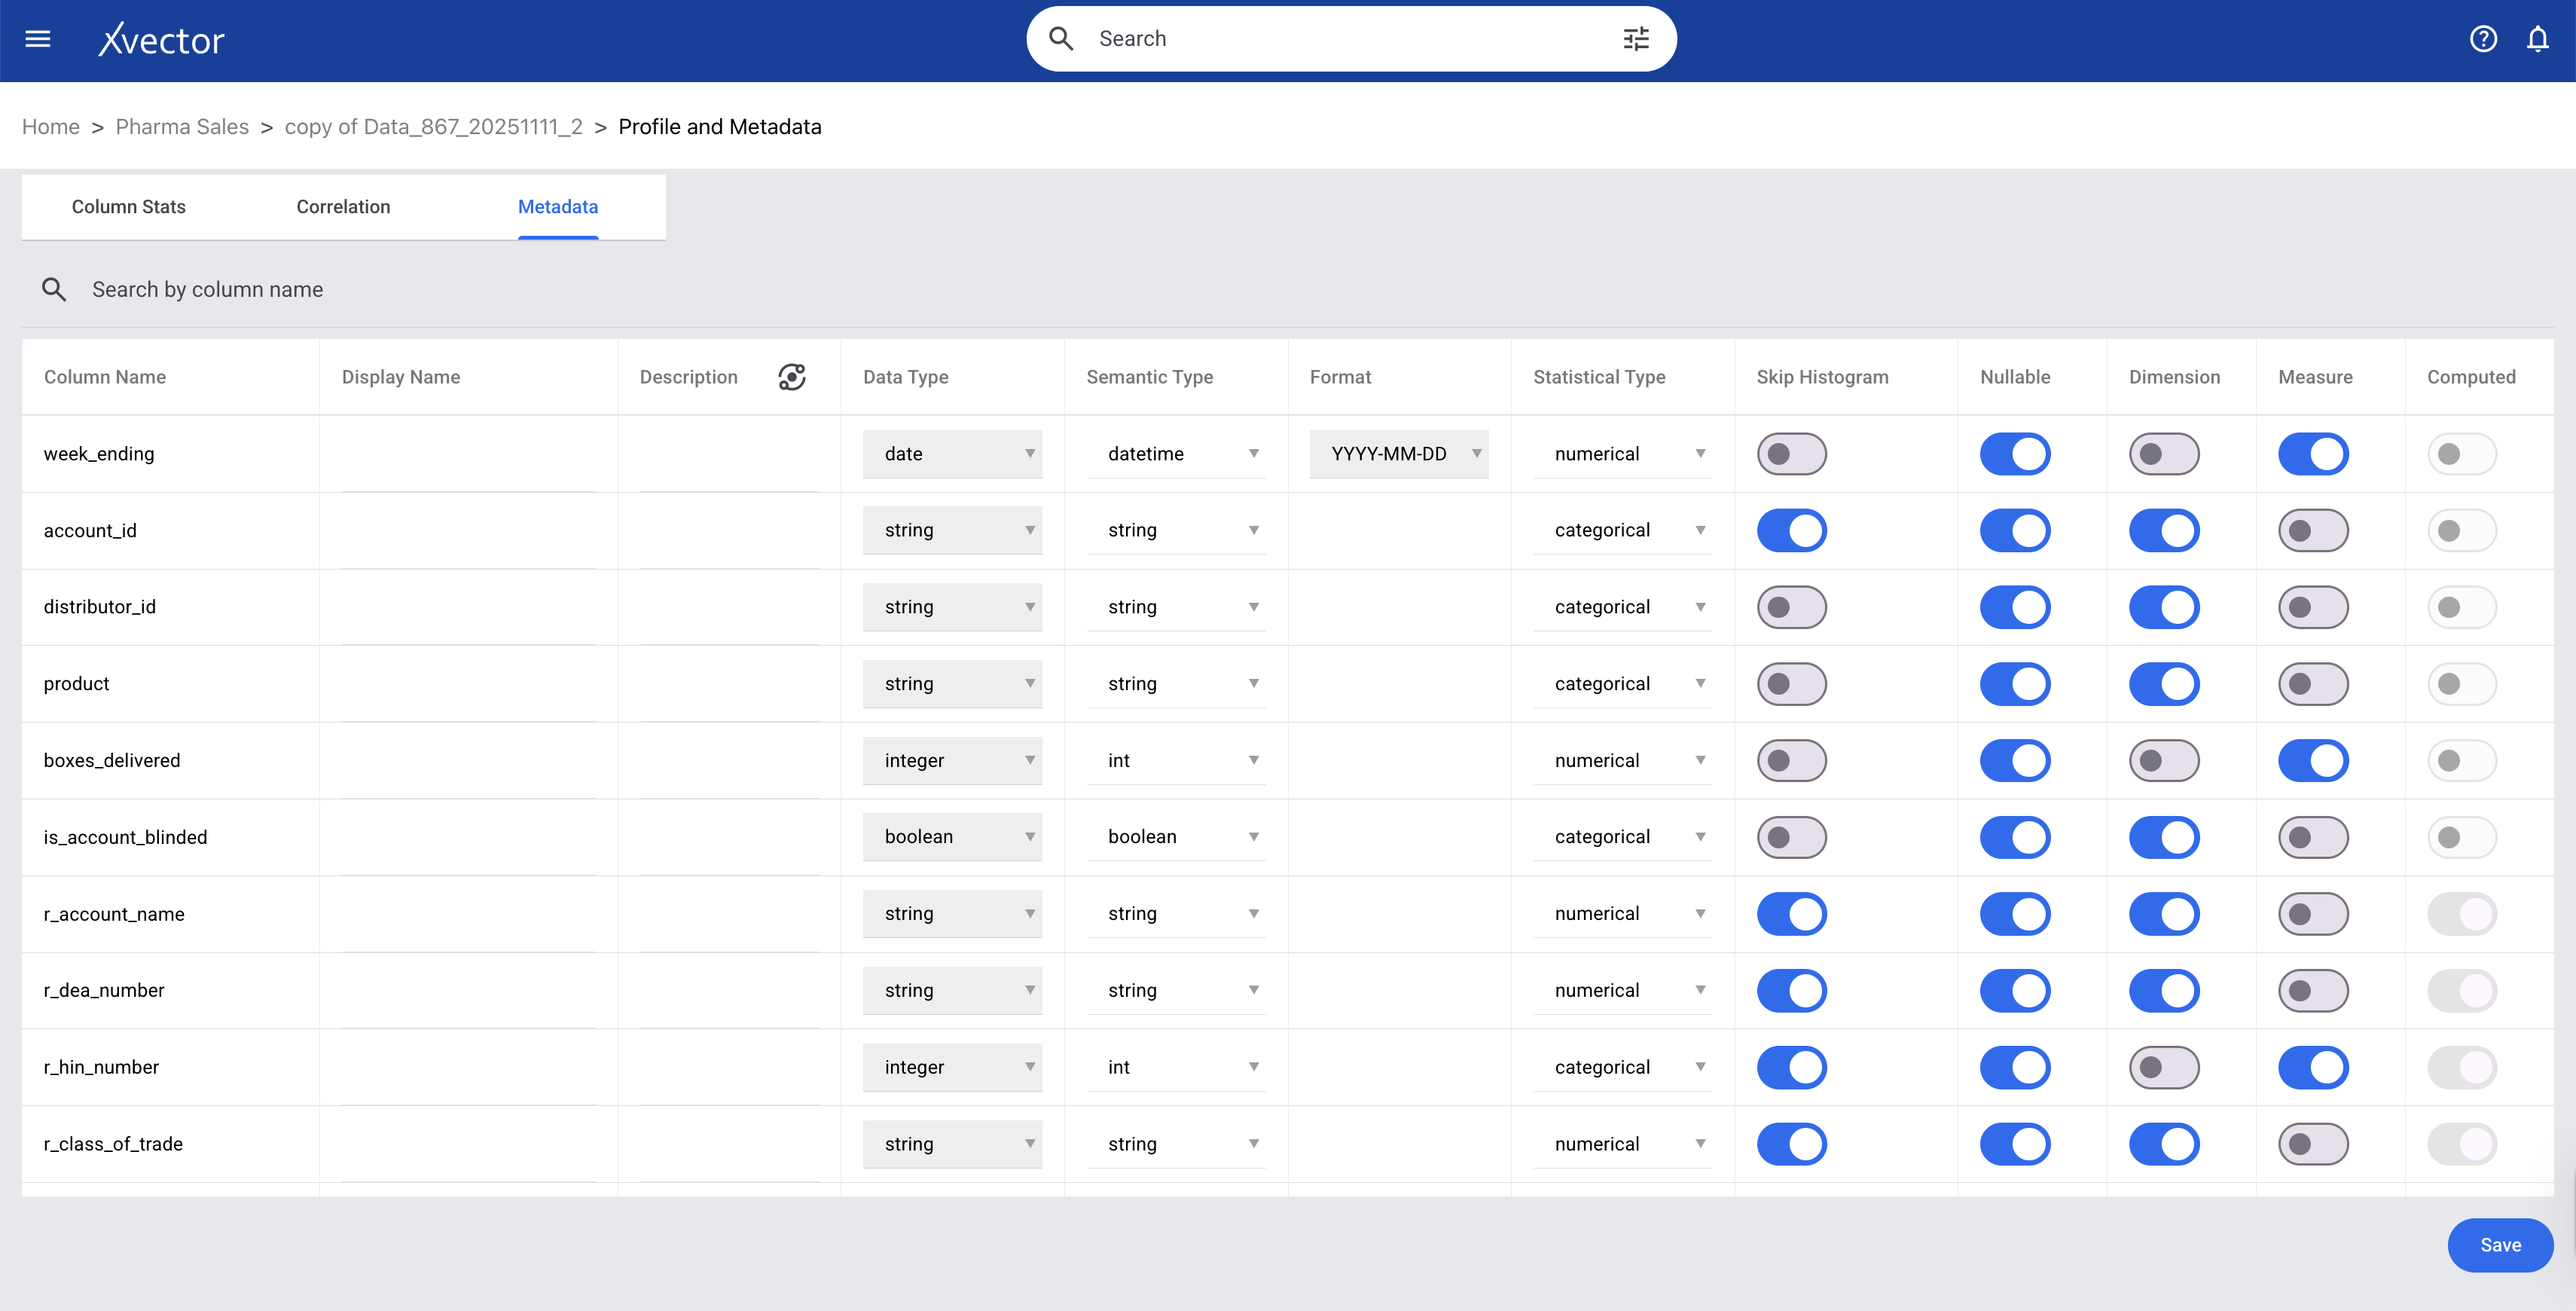
Data Profiling systematically analyzes datasets to understand structure, quality, and statistical properties. Profiling reference datasets tracks completeness (null percentages), uniqueness (duplicate rates), validity (data type conformance), and distribution (outliers and anomalies).
xVector provides out-of-the-box profile reports, custom column-level profiling, and histogram visualizations. The data types of each column in a dataset are available on the metadata page.
- Column Stats - shows histogram and statistical information about the data
- Correlation - shows the correlation matrix
- Column Metadata - metadata of the dataset

Enrichment
Raw data captures what happened but rarely includes the context needed to understand why it matters or what it means for the business. Enrichment augments source data with additional attributes, external context, and derived insights, transforming operational logs into analytical assets. Users can apply appropriate enrichment functions to make the data analytics-ready, adding business context, filling gaps, deriving new attributes, and joining external sources that transform raw events into meaningful insights.
Below are some examples from the Saas Enterprise App and the Pharma Sales and Product App: